Katalin Kovály – Ágnes Erőss
Ch anges in the Number of Hungarians in Tr anscarpathia Based
on the Survey ‘SUMM A 2017’
abstract: According to the last ukrainian census in 2001, 152 thousand people de- clared Hungarian ethnicity in Transcarpathia. Since then, there has been no reliable and up-to-date data on the ethno-demographic development of the region’s population. How- ever, for instance, migration flows, which are particularly salient since the outbreak of the armed conflict in east ukraine in 2014, must have contributed to transformations of the ethnic structure. Thus, this paper aims at exploring the demographic development of Hungarians in Transcarpathia based on the survey “SummA 2017”. The study also in- tends to reveal how certain demographic factors contributed to the change of number of Hungarians. According to the survey results, the number of Hungarians fell to around 130 thousands by mid-2017. The number of Hungarians living in urban areas and in the ethnic contact zone decreased the most. Behind this negative trend one can find emigration as the main reason, however, negative natural change also contributed to the decreasing numbers.
The third factor, assimilation, has not played an important role in the change of the Hun- garian population’s number.
introduction
How many Hungarian live in Transcarpathia? This question has been in the forefront of interest both in the academic and in the political sphere, and among the Hungarians liv- ing in Transcarpathia. However, the answer is not attainable with a simple Google search, as since the last census in 2001, the lack of concise data collection has impeded statistical
1 Patrik Tátrai was supported by the Bolyai János Research Grant.
assessment. It was considered logical that, similarly to other regions in the Carpathian basin, the number of ethnic Hungarian population has been shrinking, although the pub- lished numbers trying to estimate the extent of the decrease show great variety.
According to the above mentioned census in 2001, in Transcarpathia 151,500 people declared Hungarian ethnicity and 158,700 people declared Hungarian mother tongue. For the rather stable, exodus-free 2001–2010 period, molnár and molnár D. counted with a 9,000 decrease, estimating the population number to 142,000, whereas Karácsonyi and Kincses estimated a 15−20,000 decrease based on the immigration statistics in Hungary.2 The difference was primarily due to the techniques of quantification of migration process- es. Nevertheless, since 2010, several newly developing factors impacted the migration of Hungarians in Transcarpathia. First, the Hungarian law on simplified (re)naturalisation, available since 2011, has to be mentioned. The law significantly simplifies the settlement in Hungary (or in other eu states) of former citizens (and their descendants) of any Hun- garian state formation.3 In addition, in ukraine the geopolitical turmoil (euromaidan, Donbas conflict), the significant economic downturn, and the waves of military drafting create a bundle of push factors. As a consequence, emigration of Hungarians received a new impetus.4 Both of the above mentioned factors increase emigration and circular labour migration, but no reliable estimations are available to assess the size of the phenomena.
The social consequences of the above listed geopolitical circumstances (economic dif- ficulties, general precarious living circumstances, shrinking population numbers due to emigration) all influenced the number of births in Transcarpathia.5 Nevertheless, similarly to the migration, no official data is available on natural change, thus only indirect estima- tions could be performed to assess the changes in the birth and death rate of the Hungar- ians, and how those impacted the Transcarpathian Hungarian population.
2 József molnár and István molnár D., Kárpátalja népessége és magyarsága a népszámlálási és népmozgalmi adatok tükrében [Population and the Hungarians in Transcarpathia in the light of census and popula- tion statistics], Kárpátaljai magyar Pedagógusszövetség: Beregszász, (2005); Dávid Karácsonyi and Áron Kincses, “Az elvándorlás hatása a kárpátaljai magyarság helyzetére” [The impact of outmigration to the Transcarpathian Hungarian population]. Földrajzi Közlemények, 134, no. 1 (2010): 31–44.
3 See more: Patrik Tátrai, Ágnes erőss and Katalin Kovály, “Kin-state politics stirred by a geopolitical conflict: Hungary’s growing activity in post-euromaidan Transcarpathia, ukraine”. Hungarian Geo- graphical Bulletin. 66, no. 3 (2017): 203−218.
4 Patrik Tátrai, Ágnes erőss and Katalin Kovály, “migráció és versengő nemzetpolitikák Kárpátalján az euromajdan után”. [migration and kin-state politics in Transcarpathia after the euromaidan]. Regio, 24 no. 3 (2016): 82–110.
5 József molnár and István molnár D., “A születésszámok alakulása Kárpátalján térben és időben”[The dynamics of birth rates in Transcarpathia in space and time], in Magyarok a Kárpát-medencében 2.
[Hungarians in the Carpathian Basin], ed. Gabriella Szónokyné Ancsin:, (egyesület Közép-európa Ku- tatására: Szeged, 2017). 395–409.
Driven by the endeavour to bridge this gap in knowledge, the main goal of the present study is to measure the above listed phenomena, to provide answer to the question “how many Hungarians live in Transcarpathia”, based on the “SummA 2017” demographic survey.6 The study also intends to reveal how certain demographic factors contributed to the change of number of Hungarians. In the followings first we offer an analysis on the main factors that have been determining the number of the Transcarpathian Hungarian population in the last 30 years. This section will be followed by the presentation of recent processes based on the SummA 2017.
The main factors of the demographic processes of Hungarians in transcarpathia
The dynamics of population in a given territory is determined by the balance between natural change (the deficit of natural birth and death) and migration (the difference be- tween emigration and immigration). However, in case of an ethnic group, in addition to the above two factors, the changing ethnic classification, in other words, assimilation, also needs to be taken into account. This latter might refer to shifts in self-identification throughout the individual’s life-course, but, in general, the inter-generational changes (for instance, if a Hungarian mother’s child will be non-Hungarian), or with other words, the difference between demographic and ethnic reproduction, influence the data more significantly.7 As these factors are quite difficult to quantify, usually the occurring con- sequences of those changes become enlisted as factors that cannot be explained either by natural change and/or migration balance.8 However, this method is only applicable when the “total sum” of the equation is available. In our case it means that the total number of
6 SummA 2017 project was supported by the Bethlen Gábor Alap Zrt. The research was carried out by Ágnes erőss, Viktória Ferenc, Katalin Kovály, József molnár, István D. molnár, Krisztián Rákóczi and Patrik Tátrai.
7 See Sándor Szilágyi N., “Az asszimiláció és hatása a népesedési folyamatokra” [The impact of assimilation on population dynamics], in Népesedési folyamatok az ezredfordulón Erdélyben. [Population dynamics in the turn of the century in Transylvania], ed. Tamás Kiss: (RmDSZ Ügyvezető elnöksége: Kolozsvár, 2004). 157–234.
8 See, e.g. Sándor Szilágyi N., “Az asszimiláció és hatása a népesedési folyamatokra” 157–234; Árpád Varga e., “Az erdélyi magyarság asszimilációs mérlege a XX. század folyamán”. [The assimilation balance of Transylvanian Hungarians in the XXth century], Regio, 13, nr. 1, (2002): 171–205.; lászló Gyurgyík, Asszimilációs folyamatok a szlovákiai magyarság körében, [Assimilation processes among Hungarians in Slovakia], (Kalligram: Pozsony, 2004); Tamás Kiss, “Interethnic marriages and Assimilation in Demo- graphic models”, in Perspectives of Diaspora Existance, eds. Balázs Balogh and Zoltán Ilyés, (Akadémiai Kiadó: Budapest, 2006.): 105–137.
the population of a given unit is known (e.g. from census data), and the aim is to better understand the factors shaping the total number of the population. In recent years, grow- ing number of research has avoided treating assimilation as “the rest”, and—depending on the available data sources—has conducted research on this specific topic.9 Primarily the intergenerational assimilation are taken into consideration, since the shifts in the declared identity of individuals’ life-course are statistically impossible to follow.
However, it must be mentioned that among the three main factors not only assimila- tion, but migration is also hard to trace in statistics. while to record the number of births and death is relatively simple—although in ukraine detailed population data are not avail- able, for instance, the data on the number of births on lower levels, including settlement, but even raion10 level, are not accessible—to statistically detect the increasing mobility in the globalising world is almost impossible. The overwhelmingly international mobility that remains unreported and unrecorded in statistics is called “hidden migration” by Gyur- gyík.11 As we will see, this “hidden migration” composes a significant share of emigration from Transcarpathia. we face further challenges since our aim is not to provide a report about the whole population of Transcarpathia, but only about the demography of Hungar- ians. In ukraine, even the minimal necessary, ethnically specified data are not available:
for instance, the registration of the nationality of newborns, deceased or married couples was ceased in 2002.
To follow the demographic trends of the Hungarians in Transcarpathia was quite prob- lematic even in the period between the last two censuses. From 1989 to 2001, the number of ethnic Hungarians decreased with 4,200 people (2.7%), thus their number was 151,500 in 2001. According to the optimistic scenarios, this was translated as the Hungarians’
share in the region’s total population decrease from 12.5% to 12.1%. The decrease was spa- tially imbalanced: while the number of Hungarians living in urban settlements decreased (-8.8%), in villages their number increased (+1%). Additionally, the pace of population
9 For instance: Tamás Kiss and Gergő Barna: “Népszámlálás 2011. Erdélyi magyar népesedés a XXI. század első évtizedében” [Census 2011. Population dynamics of Hungarians in Transylvania in the beginning of the 21st century], (Nemzeti Kisebbségkutató Intézet: Kolozsvár, 2012) (Authors’ translation); Tamás Kiss: “Assimilation and Boundary Reinforcement: ethnic exogamy and Socialization in ethnically mixed Families.” in Unequal Accommodation of Minority Rights, eds. Tamás Kiss, István Gergő Székely, Tibor Toró, Nándor Bárdi and István Horváth, (Palgrave macmillan, 2018): 459–500.
10 Raion is a name of an administration unit in many east european countries, and it is a type of subna- tional entity. It is often translated as district into english, however, we chose to use ‘raion’ in this article, because we find it more precise.
11 lászló Gyurgyík, Népszámlálás 2001. A szlovákiai magyarság demográfiai-, település-, és társadalom- szerkezetének változásai az 1990-es években. [Census 2001. Changes in the structure of demography, settlement and society of the Hungarians in Slovakia in the 1990s] (Kalligram: Pozsony, 2006.): 80.
decrease was faster in the regions where Hungarians live in scattered communities (or
“szórvány” with Hungarian term)12 (-14.3%, Khust, Tyachiv, Rachyv) than in the core ar- eas where they live in an ethnically homogenous bloc (-0.6% in the town of Berehove and raions of Berehove, uzhhorod, mukacheve and Vynohradiv).
The impact of migration was estimated in a very wide range, between 4 and 30 thousand emigrants to Hungary.13 Based on the 2001 census, probably the lower numbers should be taken into account (according to our assessment, around 7,000 people), but, based on the immigration and citizenship statistics of Hungary, the number of those who practi- cally lived outside of Transcarpathia but were still recorded in the census as inhabitants of Transcarpathia is much higher, might be even double. This phenomenon clearly illus- trates the blurred boundary between temporary and permanent migration, and points to the limited applicability of data sources collected with traditional methods (e.g. census) to track mobility.
Previous research has proved probable that besides emigration, natural decrease has also contributed to the decrease of the number of Hungarians in Transcarpathia (with 5,000
12 ‘emerged in the first half of the 20th century, „szórvány” as scholarly approach is a special Hungarian term applied for those Hungarian communities living scattered, dispersed with other ethnic groups in the territory of the historic Hungary (basically in the Carpathian basin). However, there is no one, widely accepted definition of it in the Hungarian academic literature. The Hungarian public, political and scholarly discourses apply “szórvány” for all communities that does not belong to the core Hungar- ian settlement areas where Hungarians live in a bloc (Zoltán Ilyés, “Szórványkutatás, szórványértel- mezés. megjegyzések a Kárpát-medence szórványközösségeinek társadalomtudományi vizsgálatához,”
[Researching and analyzing scattered communities. Remarks to the social scientific research on scattered communities in the Carpahian Basin] In Tanulmányok a szórványról, eds. Zoltán Ilyés and Richárd Papp, (Gondolat – mTA etnikai-nemzeti Kisebbségkutató Intézet: Budapest, 2005) 64–77; Patrik Tátrai,
“A Kárpát-medencei magyar szórványok településszerkezete és főbb demográfiai jellemzői.” [Settlement structure and main demographic characteristics of Hungarian diaspora communities in the Carpathian Basin], Kisebbségi Szemle, 2. nr. 1. (2017: 7−31.) Although “szórvány” is mostly translated to english as
“diaspora”, the meaning of the english term is quite different (see e.g. the paradigm of diaspora stud- ies). Furthermore, Hungarian literature differentiates between “szórvány” and “diaszpóra” based on the latter’s geographic scope (outside the Carpathian basin) and migration background (See: Dániel Gazsó,
“Diaspora policies in theory and practice“, Hungarian Journal of Minority Studies. 1. (2017): 65−87).
13 József molnár and István molnár D., “Kárpátalja népessége’”; Károly Kocsis, Zsolt Bottlik and Patrik Tátrai, “Etnikai térfolyamatok a Kárpát-medence határainkon túli régióiban (1989−2002)” [ethnic spatial processes in the Carpathian Basin beyond the borders of Hungary]. (mTA FKI: Budapest, 2006); Dávid Karácsonyi and Áron Kincses, “Az elvándorlás hatása”; Tamás Kiss, “Demográfiai körkép. A kisebbségi magyar közösségek demográfiai helyzete a Kárpát-medencében”. [Demograhic panorama. The demog- raphy of the Hungarian minority communities in the Carpathian Basin], Educatio, 21 nr. 1, (2012):
24–48.
people).14 As data for natural growth of population for the 1989–2001 period was not pub- lished in ethnic distribution, the number of Hungarians can only be assessed indirectly.
First, this can be done based on the numbers of Berehove raion with a majority Hungarian population and the town of Berehove; secondly, based on the 5-year age structure data of Transcarpathian Hungarians (which serves as the basis for counting the birth rates in 5-year terms) and the mortality data of Berehove raion and Berehove town; and thirdly, we can rely on the different data collections compiled by students of the Ferenc Rákóczi II Transcarpathian Hungarian Institute in settlements in Transcarpathia inhabited by Hun- garians.
Data on natural change in Berehove raion and Berehove are available for the period be- tween the two censuses, except for the 3-year period between 1992–1994. The first years of post-socialist transformation were critical for the dynamics of natural change both in the town and in the raion of Berehove with Hungarian majority: the numbers fell back drastical- ly due to the political shift and economic crisis (in the region of Transcarpathia from 6.6‰
in 1991 to 1.7‰ in 1995, in Berehove raion and Berehove town from 4.5 ‰ to 2.9‰).15 Due to the significant changes in the numbers, leaving out the 3-year data-blank period between 1992–1994 would result in severe deformation in the determination of general population dynamics between 1989–2001, thus we rather decided to use interpolation to fill this gap, based on the 1991 and 1995 data for the region, for the raion and the town of Berehove. As a result of this calculation, the natural change of Berehove raion and Berehove was -0.4‰
for the 1989–2001 period. The similar indicator for the entire Hungarian population most probably was lower, even if we consider the data of the Roma population in the raion (4.1%) and in the town (6.4%)16, which is characterized by higher fertility rates.
14 e.g. Sándor Horvát, “magyarság – számok és kétségek.” [Hungarians - numbers and doubts]. Kárpáti Igaz Szó, 19 nr. 4. (2003); József molnár and István molnár D., “Kárpátalja népessége”; lászló Gyur- gyík, István Horváth and Tamás Kiss, “Demográfiai folyamatok, etnikai és társadalmi reprodukció.”
[Demographic processes, ethnic and social reproduction], in Határon túli magyarság a 21. században.
[Transborder Hungarians in the 21st century], ed. Botond Bitskey Botond, (Köztársasági elnöki Hi- vatal: Budapest, 2010): 69–124.; Patrik Tátrai, József molnár, István molnár D., Katalin Kovály, Ágnes erőss, Viktória Ferenc and Krisztián Rákóczi, “A migrációs folyamatok hatása a kárpátaljai magyarok számának alakulására.” [The impact of migration processes on the population number of Transcarpath- ian Hungarians], Metszetek, 7, nr. 1, (2018): 5–29.
15 József molnár and István molnár D., ”A kárpátaljai magyarság népességföldrajzi viszonyai a 21. század elején.” [The demography of the Transcarpathian Hungarians in the beginning of the 21st century], in Értékek, dimenziók a magyarságkutatásban [Values, dimensions in researching Hungarians] ed. Csilla Fedinec (mTA magyar Tudományosság Külföldön elnöki Bizottság: Budapest, 2008): 218–239.
16 Kárpátaljai megyei Statisztikai Hivatal (Закарпатське обласне управління статистики):
Національний склад населення та його мовні ознаки (статистичний бюлетень). Ужгород, 2003.
[National composition of the population and its linguistic features (statistical bulletin)], uzhhorod, 2003.
with the second method, the rate of average natural change was -0.5‰, that is, it hardly differs from the results of the first method. Based on the results of the third method, i.e. the data collections carried out by students in Hungarian-inhabited settlements char- acterized with high proportion of Roma population, the natural change was determined as -0.1‰ in between the two censuses.
In sum, the natural decrease in the period of 1989–2001, even if we consider the most unfavourable scenario, resulted in a maximum loss of 1000 in the number of Hungarians in Transcarpathia.
All in all, as a consequence of the two factors (migration and natural change) deter- mining population dynamics, the number of Hungarians in Transcarpathia has decreased with approximately 8000. This suggests that, as a result of the changing identification (including intergenerational assimilation), the population benefit of the Hungarian com- munity was about 4000. Three major underlying causes might be identified behind this:
the self-identification of the Roma population, among whom—partially because of the benefits guaranteed by the Hungarian Status law17—more than 4000 declared Hungarian ethnicity according to molnár et al.18 Secondly, some of those who had declared ukrainian or Slovak nationality in the Soviet period due to fear of retaliation, after the regime change they reassured their Hungarian ethnicity in official statistics. This was rather observable in the Greek Catholic community in Vynohradiv raion and in uzhhorod, especially among those who previously had been registered as Slovak.19 The third aspect is the self-iden- tification of the population with indecisive or dual attachment (e.g. people from mixed marriage). At the time of the 2001 census this group—in comparison with the previous period—confirmed Hungarian ethnicity in higher numbers. This phenomenon can be ex- plained most probably with some economic benefits and the presumedly increased prestige of Hungarian ethnicity.20
According to the 2001 census data, 52.8% of children born in Hungarian–eastern Slav mixed marriages were registered Hungarian and 47.2% of them were registered ukrainian.
17 The Hungarian Status law aimed at extending privileges to the transborder Hungarian communities.
Among others it made available visa free entry, limited employment opportunities and access to educa- tional institutions in Hungary for ethnic Hungarians living in neighboring states. Pogonyi Szabolcs,
“Transborder Kin-minority as Symbolic Resource in Hungary”. Journal on Ethnopolitics and Minority Issues in Europe. 14, Nr. 3, (2015): 73−98, Károly Kocsis et al, “etnikai térfolyamatok…”,
18 József molnár, István Csernicskó and lászló Braun, “Cigányok Kárpátalján” [Roma in Transcarpathia], In Roma népesség Magyarország északkeleti határtérségében [Roma in the north-eastern boundary of Hun- gary], ed. Ferenc Szilágyi and János Pénzes (Partium Kiadó: Nagyvárad, 2016): 91–108.
19 József molnár and István molnár D., “Kárpátalja népessége”; Károly Kocsis et al, “Etnikai térfolyamatok”.
20 József molnár and István molnár D., “Kárpátalja népessége”; Károly Kocsis et al, “Etnikai térfolyamatok”.
Thus, in 2001 the ethnic reproduction was nearly symmetric in Hungarian–ukrainian terms, with a slightly minimal Hungarian positive balance (gain).21 Naturally, the ethnic socialization of children with mixed ancestors show great variety according to the type of region where they live (in ethnic bloc or in scattered communities). In general, their ethnic identification correlated with the ethnic composition of the settlement they lived. In the uzhhorod and Berehove raions, and in Berehove town, where Hungarian forms the local majority, most people from mixed marriages self-identified as Hungarians. ethnic sociali- zation in mukacheve, Vynohradiv and Khust raions, where heterogamous families mainly live in settlements with ethnically diverse population, is nearly balanced. However, in the raions home for scattered Hungarian communities, only 15% of the children were regis- tered as Hungarians. Similarly, ukrainian overweight was typical in uzhhorod and Khust towns, and in Tiachiv and Rakhiv raion (25−40% of children raised in mixed marriages became Hungarian), where the Hungarian population live in lower percentage.22 However, these numbers are still more balanced than the similar data deriving from other scattered Hungarian communities in the Carpathian basin.23
recent changes in the number of transcarpathian Hungarians based on SuMMa 2017
As it was mentioned above, census was not conducted since 2001 in ukraine. Since other data sources are very limited, thus to get to know the number and the demographic features of Hungarians was only possible by conducting our own data recording. The main aim of the SummA 2017 research was to measure the number, the settlement distribution, certain demographic characteristics (gender, age), denominational and educational features and the mapping of educational and labour migration of Hungarians in Transcarpathia.
Since a similar survey has not yet been prepared for the Hungarians in the Carpathian
21 József molnár: “Національна ідентичність нащадків етнічно змішаних (українсько−угорських) закарпатських родин за даними перепису населення та анкетного опитування.” [National iden- tity of descendants of ethnically mixed (ukrainian−Hungarian) Transcarpathian families according to the population census data and questionnaire survey], In Társadalomföldrajzi kihívások és adekvát válaszlehetőségek a XXI. század Kelet-Közép-Európájában, [Social Geographical Challanges and Search for Adequate Answers in east-Central europen in the 21st Century], ed. Sándor Berghauer (II. Rákóczi Ferenc Kárpátaljai magyar Főiskola: Beregszász, 2016): 166–174.
22 József molnár, “Національна ідентичність нащадків етнічно змішаних (українсько−угорських) закарпатських родин за даними перепису населення та анкетного опитування.”: 169.
23 Patrik Tátrai, “A Kárpát-medencei magyar szórványok településszerkezete és főbb demográfiai jellemzői”.
Basin—in other words, this research was a pioneer endeavor to our knowledge—there- fore, no developed methodology for the implementation was available. Although Károly Kocsis’s ethnographic map of Transcarpathia24 from 1999 was based on the estimation of Hungarian and other ethnic groups by settlements25, this method can only be used to assess the number of Hungarians and not to estimate other demographic characteristics.
In addition, almost 20 years later, due to increased mobility and uncertainties caused by geopolitical changes, this method was not applicable. Another important preview was the migration research of József molnár and István molnár in 2016–201726, from which we incorporated several elements into the SummA 2017 methodology.
Methods of the SUMMA 2017
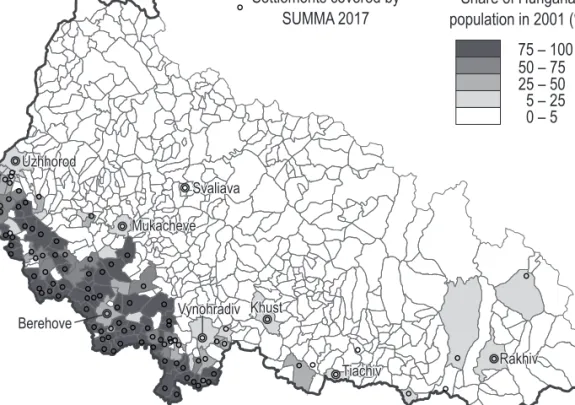
The demographic survey covered 111 settlement in Transcarpathia where, according to the 2001 census, at least 100 Hungarians lived (Figure 1.). Field research took place at 312 sampling points, with random sampling, and it incorporated 15% of the Transcarpthian Hungarian population in 2001. The number of sampling points per settlement was deter- mined on the basis of the 2001 census, depending on the distribution of the Hungarian population. This way, each sampling point covered 500 Hungarians in Transcarpathia (according to the 2001 data) on average. A sampling point consisted of 20 partially or en- tirely Hungarian households, and we collected the relevant basic demographic information about each of them (including those who emigrated and deceased since 2001). Interviewers asked all households in the given sampling point about the gender, age, nationality, mother tongue, denomination, highest level of education, main occupation of the members of the household, the length and place of their stay abroad extending 1 month, and their place of residence at the time of the last 2001 census.
24 Károly Kocsis, Kárpátalja mai területének etnikai térképe 1941, 1999 (1:266.000). [ethnic map of present day Transcarpathia 1941, 1999 (1:266.000)], (mTA FKI – mTA KKI: Budapest, 2001).
25 estimations were provided by local administrators, and/or experts, who were familiar with local situa- tions. Thus the data published by Kocsis—in contrast to for instance census data—were not based on self-identification, but heteroidentification.
26 József molnár and István molnár D., Állandó és ideiglenes migráció a kárpátaljai magyarok körében az utóbbi években. [Permanent and temporary migration among Transcarpathian Hungarians in recent years]. Rese- arch report, submitted to Domus Group Homeland Grant, research report, 2017. manuscript.
Figure 1. Settlements covered by SUMMA 2017 according to the ratio of Hungarian population
one of the crucial issues of the research was sampling. For our investigations—taking into account the settlement conditions of the Transcarpathian Hungarians—we used three sampling methods:
• In settlements with a Hungarian majority. the territorial method was applied: 20 Hungarian families (households) living contiguously formed one sampling point.27 The initial household (starting point) and the direction of progress of the survey were jointly appointed by a surveyor, who was familiar with local conditions, and the research leaders, in order to secure that the sampling points do not overlap and that 20 Hungarian families can be reached in a geographically coherent area. Al- though in general there is no significant segregation in the villages with Hungarian majority in Transcarpathia, the residential segregation of the Roma population is widespread. This research did not undertake the survey of the Hungarian-speaking Roma population.
27 The surveyors were asked to register each household on the route where they passed until they managed to compile the data for the requested 20 Hungarian households Thus, the empty and non-Hungarian households were also enlisted.
Uzhhorod
Mukacheve
Khust
Rakhiv Vynohradiv
Berehove
Tiachiv Svaliava
Share of Hungarian population in 2001 (%):
75 – 100 50 – 75 25 – 50 5 – 25 0 – 5 Settlements covered by
SUMMA 2017
• In cities (uzhhorod, mukacheve), where the Hungarians generally live dispersedly, population registers formed the base of the sample. In this case, we collected a list of typical Hungarian family names from the population register compiled at the turn of the millennium (Nomer.org), and the households were randomly selected from that list.
• Due to ethnic diversity, in settlements only sparsely populated by ethnic Hungarians (the so called Hungarian “szórvány”, see in footnote 15.), Hungarian family names do not necessarily occur. Additionally, due to the scattered character of residence of Hungarian families, the first method was also not applicable. Therefore, we in- troduced a third method called “spatial snowball”. According to this method, not a predetermined neighborhood, but the nearest Hungarian household was surveyed (in total 20 Hungarian households formed a sampling point in these cases, but not necessarily contiguously).
The question arises: who did we consider as Hungarian? we accepted the self-identifi- cation of respondents, or the assessment of the surveyor of the given household, thus, both methods were essentially identical with the procedures of the census. we also included residents of other nationalities living in the sample area, many of whom lived in mixed marriages with Hungarians, and the surveyor did not always have prior information on the ethnic belonging of those living in the household. Naturally, we did not take into ac- count the data of non-Hungarians in the evaluation of data the regarding Hungarians. we determined that in the course of the query, 20 partially or completely Hungarian house- holds should be surveyed, but the data of the non-Hungarian or empty households in the sample also needed to be recorded in a separate questionnaire. The latter also played a role in calculating the change in the number of Hungarians (i.e. the decrease due to death and migration), since Hungarian residents had lived at the time of the 2001 census in some of the households that were empty or inhabited in 2017.
The research was completed in the summer of 2017. A total of 23,033 persons’ data were recorded during the survey. The number of Hungarians living in the sample area on January 1, 2002 was 19,993, which represented over 13% of the Hungarian Transcar- pathian population (based on the recorded 151,516 people in the census on the reference date of December 5, 2001). In 2017, the number of Hungarians in the sample was 18,553,
of whom 6.6% declared multiple ethnic ties. 28 In the Hungarian households, in addition to the Hungarians and the people with multiple ethnic ties, there were 658 ukrainian and 125 other nationalities (mainly Roma and Russians) living.
Calculating the number of Hungarians
The number of the Hungarian population was calculated on the basis of the natural change, migration balance, and intergenerational assimilation of the sampled population by continuing the data of the 2001 census. Since the research—due the above explained method—did not cover the Roma population living in the settlements, we counted the number of Hungarians but did not include the Hungarian-speaking Roma.
At the end of the calculations—for the sake of comparability with the 2001 census—we also calculated the number of Hungarians by adding the Roma population that is presum- ably Hungarian. of course, this is a hypothetical calculation, since in 2016 more than 20,000 Hungarian-speaking Gypsies lived in Transcarpathia.29 Among them, the ratio of those who declare Hungarian ethnicity can vary in a wide scale depending on actual social- economic circumstances. Thus, we carried on the number of Gypsies who declared them- selves Hungarian in 2001, and did not investigate further issues of their self-identification.
At the same time, we emphasize that in the above number of population the data of Hungarian Roma is not included, neither in the other demographic indicators (e.g., gender, age, education, etc.) nor in the population components (natural change, migration, assimi- lation, assimilation).
on the basis of the data received, we determined the birth and death rates per settle- ment for the period 2002–2016. Given that mortality data have been found deficient30 and that we have more reliable mortality data from other sources, we decided to use the
28 This data is far behind the 15%, published in TANDem 2016, which was based on a representative sam- ple (Viktória Ferenc, “A nemzeti-etnikai identitás építőkövei kárpátaljai ukránok és magyarok körében”
[Building blocks of national and ethnic identity among ukrainians and Hungarians in Transcarpathia].
Kisebbségi Szemle, 2 nr. 2 (2017): 21–39. The difference can be explained by the different conceptualisa- tions of the term “nationality” (See, for instance: Kornélia Hires-lászló, “etnikai kategóriák a beregszás- ziak mindennapi diskurzusaiban” [Categories of ethnicity in the everyday discourses of inhabitants of Berehove], In Többnyelvűség, regionalitás, nyelvoktatás [multilinguality, regionality and language educa- tion], eds. Anita márku and enikő Tóth, (RIK-u: ungvár, 2017) 121−136.
29 József molnár et al., “Cigányok Kárpátalján”.
30 It was not always possible to obtain information about those who had died several years ago, which shows that informants could not always recall memories for such a long time period (15 years).
mortality data collected by the local municipalities. The fact that the death rates by ethnic groups in the Transcarpathian settlements do not differ significantly also reinforced this methodological decision.
Two methods were used to determine migration rates. According to the “direct” meth- od, those who settled in the sample between 2002 and 2017 appeared as a plus, and those who disappeared from the sample were interpreted as minus. In theory, the net ratio of the emigrated and immigrated people within the circle of settlements in the sample should have been identical. However, due to the inaccuracy of the data collection in some sam- pling locations we found that the number of emigrated people counts only 87% of the immigrated people. As a correction, the number of emigrated people was divided by 0.87.
Accordingly, using the “direct” method, the settlement migration balance (SmB) can be calculated with the following formula:
SmB1 = |moved in | - (|moved out| + |moved out with family, whose data were recorded in the „non-Hungarian or empty house“ questionnaire|)/0,87
However, these motion vectors have two possible outcomes: those who moved into the sample had moved out of somewhere else, and those who had moved out of that unit moved in somewhere else. If the data on the other end of the vectors is not examined, it would be a serious loss of information.
with the “indirect” method, the settlement migration balance can be calculated as follows:
SmB2 = (|moved out from another settlement within the sample, moved in to this set- tlement| + |moved out with family from another settlement and moved in to this settlement, whose data were recorded in the „non-Hungarian or empty house“ questionnaire|)/0,9631 – | those who moved in to another settlement within the sample and had moved out of this settlement|/0,4432
The results obtained with the two methods may differ significantly from place to place, which can be explained both with the objective sampling errors as well as with the possible errors due to the subjective superficiality of the surveyor. The actual situation is best ap- proximated by taking the average of the results of both methods; therefore, we determined the migration rates based on the SmBs obtained as the average of the two methods.
31 0,96 – the proportion of those moving from Hungarian-inhabited Transcarpathian settlements within those who move in to Transcarpathian Hungarian settlements.
32 0,44 – the proportion of those moving from Hungarian-inhabited Transcarpathian settlements within those who move out of Transcarpathian Hungarian settlements.
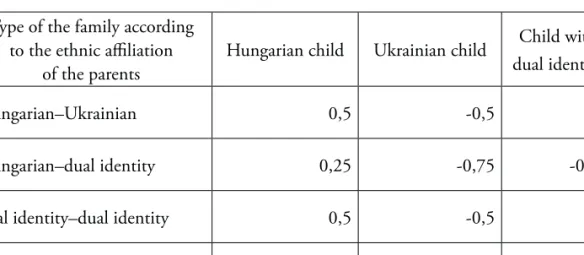
Regarding the estimation of the third factor modifying the number of people, assimila- tion, we limited our research to the assessment of intergenerational assimilation, because the data collected are not suitable for tracking the identification changes through the lives of individuals. Considering the fact that in the case of Hungarian minority communities living in the Carpathian Basin, the intergenerational assimilation highly outnumbers intra- generational assimilation33, assessing the former provides us with an adequate approxima- tion of the processes of assimilation.34 To enumerate this, we had to determine how many out of the children born in mixed families between 2002 and 2016 were indicated as Hun- garian in the questionnaire. The evaluation was further complicated by the fact that the SummA 2017 survey allowed the informants to claim dual (eg. Hungarian–ukrainian) identities, as opposed to the 2001 census. The various possible combinations of net assimi- lation were quantified according to Table 1.
Table 1. Quantification of Hungarian assimilation gain (with positive sign) and loss (with negative sign) generated by the data on ethnic affiliation of children born in ethnic mixed marriages.
Type of the family according to the ethnic affiliation
of the parents Hungarian child ukrainian child Child with dual identity
Hungarian–ukrainian 0,5 -0,5 0
Hungarian–dual identity 0,25 -0,75 -0,25
dual identity–dual identity 0,5 -0,5 0
ukrainian–dual identity 0,75 -0,25 0,25
The appropriate values in the table assigned to children born in mixed marriages were multiplied by the weight of settlements determined by the sample size, and then we calcu- lated the raw numbers of net assimilation by summing up the obtained values. we consid- ered these raw data because the survey’s sampling was not representative for assimilation.
33 lászló Gyurgyík, “Asszimilációs folyamatok”; Sándor Szilágyi N., “Az asszimiláció és hatása”; Tamás Kiss and Gergő Barna, “Népszámlálás 2011”.
34 However, this is not the case in the Roma-Hungarian relationships. Self-identification of Hungarian speaking Roma individuals is very situative, depending on the current socio-economic situation, thus its contribution to the demographics of Hungarians is hard to estimate.
Firstly, it did not cover settlements where Hungarians live in low numbers (less than 100);
in these locations, assimilation patterns are significantly different from the assimilation patterns of those who live in an ethnic bloc. Secondly, sampling in scattered communities was closely related to Hungarian institutional networks and communities. Thirdly, the fact that surveyors were Hungarians could have influenced the ethnic self-identification of the informants.
How can these raw data be corrected? The data on the proportion of Hungarian chil- dren born in ethnically mixed marriages based on the 2001 census are available on raion level.35 we can rightly assume that the difference between the census data and the cor- responding assimilation indicators for those born before 2002 used in the SummA 2017 is mainly due to the difference in the sampling method. The difference between the two thus quantifies the error resulting from the sampling, in percentages, by district. Assuming that the sampling error was not significantly different for those who were born before or after 2001, this correction value was deducted from the assimilation index of those born after 2001, and thus we obtained the assimilation indicator that was valid at the time of the survey.36
After determining the rates of natural reproduction, migration and assimilation, we deducted the mortality rates from the birth rates, and added the migration rates. This way we obtained the rates of change in the number of Hungarian population according to settlements for the period 2002–2017. with this value we multiplied the number of Hungarians in settlements compiled at the 2001 census. The net assimilation was deducted from the value of natural reproduction, as the latter gave the value of the total demographic reproduction, while natural change combined with the value of assimilation provided the numbers of ethnic reproduction.
The number of Hungarians in 2017
By aggregating birth rates, deaths and migration rates per settlement, we found that the number of Hungarians in the surveyed 111 settlements was 123,200 in 2017. This
35 József molnár, “Національна ідентичність”
36 For instance, in Berehove raion, according to the census, 75.4% of the descendants raised in mixed mar- riages declared Hungarian ethnicity, while in the SummA the same rate was 63.5%. Based on this, the sampling error on raion level is 63.5 - 75.4 = -11.9%. For those born after 2001, the raw data (60.0%) was amended with the above -11.9%. As a result, we received the actual assimilation rate, which is 71.9%.
figure also includes the temporarily absent population, but it does not include the small scattered Hungarian communities, thus it is not directly comparable to the 2001 census value. For the scattered communities we applied the average rates of small communities included in the sample, and this way their number was estimated at 2000. Another crucial, but much more difficult issue is the number of Hungarian-speaking Roma who possibly declare Hungarian ethnicity. The self-identification of the Roma is situational: it varies ac- cording to external factors. For the sake of comparability, we drew their number from the estimated number of Roma registered as ethnic Hungarian in 2001 (approximately 4,200).
Thus, by 2017, we counted 5500 Roma of Hungarian ethnicity, which, of course, is far from the actual number of Hungarian-speaking Gypsies in Transcarpathia (which is more than 20,000).37 Summing up all previous data, the number of Hungarians in the middle of 2017 could be around 131,000.
However, we wish to emphasize that a census might obtain radically different values, mostly due to the registration of the Transcarpathian Hungarians living abroad for a long time, and the self-declaration of the Gypsy population. The methodological classification of those who are temporarily staying abroad is crucial in this regard, as in Transcarpathia, working abroad and cross-border educational migration have been important livelihood strategies for decades.38 In this research, we assigned those people in this category who were said to be living in Transcarpathia—despite the fact that they might spend up to 11 months in another country. According to the survey results, more than 20% of the total Hungarian population was reported to have spent at least 1 month abroad during 2016.
If we did not count those Hungarians who spend at least half of the year abroad, then the number of Hungarians would be about 11−12 thousands fewer. Consequently, we rather emphasize that by taking into account the above factors in our estimation, the realistic number of Hungarians can range between 125 and 135 thousands today.
If we consider the 131,000 value, the number of Hungarians decreased with 21,000 since the 2001 census, or by 13.7%, which is somewhat more favorable than the scenarios based on the immigration statistics of Hungary. In addition, the annual rate of population loss (-1.0%) is much lower than that of other transborder Hungarian communities between 2001 and 2011 (Slovakia: -1.2%, Vojvodina: -1.4%, Transylvania: -1.5 %, Croatia: -1.6%).
37 József molnár et al., “Cigányok Kárpátalján”.
38 Katalin Kovály, Ágnes erőss and Patrik Tátrai, “„Hát megpróbálunk küzdeni”: átalakuló boldogulási stratégiák Kárpátalján az euromajdan után” [“So we try to thrive” − livelihood strategies in transition in Transcarpathia after the euromaidan], Tér és Társadalom, 31. nr. 2. (2017): 3–22.; eleonóra Szanyi F., Julianna Faludi and Gergely Illyés, “elvágyódás, elvándorlás – legújabb migrációs folyamatok Kár- pátalján” [longing, emigrating − latest migratory processes in Transcarpathia], Kisebbségi Szemle, 2. nr.
2. (2017): 85–108.
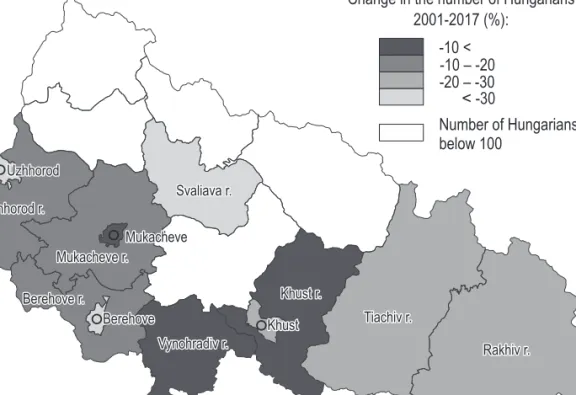
Naturally, the decrease is territorially uneven. The decline in the number of Hun- garians living in scattered communities (16.6%) was significantly higher than that of the Hungarians living in a bloc (13.0%), and this tendency is true for other transborder Hungarian communities as well. There is an even greater difference between urban (-17.9%) and rural (-11.3%) Hungarians, which is primarily due to the higher emigration rates of urban populations. The greatest decrease in the number of Hungarians is regis- tered in uzhhorod (-32.6%) and Berehove (-26.4%). Among the rural areas, the decline of the Hungarians is significant in villages between uzhhorod and Chop—except for the narrow agglomeration of uzhhorod, where the number of Hungarians only slightly reduced, most probably as a result of suburbanisation,—and in the western part of the Berehove district (Figure 2.).
Figure 2. Population dynamics of Hungarians by settlements between 2001 and 2017
In contrast to the above, the smallest decrease occurred in the eastern part of the Hungarian block area (eg. Vynohradiv raion), which is traditionally characterized by high birth rates. In some settlements in the Vynohradiv raion, the number of Hungarians slightly increased (Appendix 1). The relatively good result of the Khust raion is due to the
Uzhhorod
Mukacheve
Khust
Rakhiv Vynohradiv
Berehove
Tiachiv Svaliava
Change in the number of Hungarians 2001-2017 (%):
0 – 5 -10 – -0.1 -20 – -10.1 -42 – -20.1
Settlements excluded from the survey
fact that it includes the data of only one settlement, Vyshkovo, which cannot be consid- ered a classic scattered community (Figure 3.).
Figure 3. Population dynamics of Hungarians by raions between 2001 and 2017
The rate of decline is generally inversely proportional to the rate of Hungarians in set- tlements, namely the higher the proportion of Hungarians, the lower the weight loss is. In case the proportion of Hungarians is above 75%, the decrease is 10.3% on average. The av- erage decrease is 15.3% for settlements where the ratio of Hungarians is between 50−75%.
If Hungarians live in a minority, there is no significant difference: the ratio of population decrease is 18.5% where the Hungarian population composes between 25 and 50% of lo- cal inhabitants, and 17.3% if it composes less than 25%. The role of settlement size in the change is only observable in case of the urban–rural difference mentioned above: there is no significant difference amongst settlements of less than 10,000 (the rate of decrease is 11.3% on average in these), but the difference is significantly higher amongst settlements of 10,000 and above (21.5%).
Change in the number of Hungarians 2001-2017 (%):
-10 <
-10 – -20 -20 – -30
< -30
Number of Hungarians below 100
Uzhhorod Uzhhorod r.
Mukacheve
Berehove
Rakhiv r.
Tiachiv r.
Vynohradiv r.
Svaliava r.
Khust Mukacheve r.
Berehove r. Khust r.
Components of the population dynamics of Hungarians
The most important factor defining the decline of the number of Hungarians—just like in the previous period—is emigration. Between 2001 and 2017, the migration loss was more than 15,000 people, out of whom 14,700 left the country39, and 600 moved to other parts of ukraine. This is a much smaller value than one would expect from the migration statistics of Hungary, but the accuracy of the latter is greatly impaired by multiple registra- tions due to circular migration, by the difficulty to follow commuting, and by the planned settlements in Hungary that never happened in reality.40 on average, migration reduced the number of Hungarians by 7.2‰ annually since 2001, which translates to an increas- ing migration intensity compared to the previous period.41 The emigration of Hungarians increased especially in the period following the euromaidan, which induced probably the biggest migration wave in the history of Transcarpathia after the collapse of the Soviet union.
The intensity of emigration from Transcarpathia proved to be quite unequal. Primarily, the level of settlement hierarchy influenced the process: the proportion of those who mi- grated from cities and towns was much higher (on average -10.2‰ per year) than in rural areas (-6.1‰).42 Similarly to the population dynamics of Hungarians, uzhhorod, Berehove and Svaliava stand out from the point of view of migration as well: in these locations the average annual migration rate exceeded 11‰. migration was less influenced by the core area/scattered community dichotomy and the geographical location: only the values of the Tiachiv raion are significantly higher than the average (-9.5 ‰), where emigration and working abroad have been significant phenomena since the 1990s. The rate of emigration is the highest in the settlements where Hungarians live in a minority (0−25%: 8.5‰;
25–50%: 9.1 ‰). In settlements with Hungarian majority, usually the rate of emigration decreases as the proportion of Hungarians increases. This can be related to the fact that in
39 majority of them, approximately 10 000, moved to Hungary.
40 For details see: Tátrai et al., “A migrációs folyamatok hatása”.
41 Between 1989 and 2001, migration contributed to the drop of Hungarian population by 3.6 ‰ on an annual average. However, this value can be compared with the above value only with caution, because the 7.2 ‰ value obtained from the „SummA 2017” does not contain the data of the Hungarian Roma and of the small scattered communities.
42 we classified the transitional category of the settlement system of ukraine, the so-called “urban type settlements”, as villages, because these are closer to rural settlements both in terms of population number and demographic behavior.
ethnically mixed settlements, in addition to Hungarian migration networks, Hungarians are often involved in other migration networks, which exacerbates emigration.43
In addition to migration, the number of Hungarians was also significantly reduced by the natural decrease of the population. Between 2001 and 2017, the balance of births and deaths was estimated at -6.7 thousand, representing an average annual decline of 3.1 ‰.
This is much less favorable than the balance of just below 0 in the period 1989–2001. How- ever, amongst the Hungarian communities in the Carpathian Basin, this value represents the smallest decrease. The value of natural reproduction began to rise since 2006 after the low point in 2001, but dropped significantly after the euromaidan, in parallel with the mass emigration of the working age population.44
In the values of natural reproduction, there is a significant difference between the vil- lage and the city: in urban areas, natural decrease was generally higher (average -5.7‰
per year), while rural areas were characterized by more favorable values (-2.0 ‰). on the other hand, the east–west divide is even more important than the urban–rural difference.
The western raions of Transcarpathia were characterized by higher natural decrease, the eastern parts (traditionally fertile areas of historic maramures region) with lower natural decrease.45 The most favorable values were registered in Vyshkovo (average -0.9 ‰ per year), Tiachiv raion (-0.3 ‰) and Khust raion (this practically means Vishk); the latter is the only raion where the number of birth exceeded the number of deaths in the Hungarian population. In spite of this east–west dichotomy, the values of natural change in scattered Hungarian communities, which are mainly located in the eastern part of Transcarpathia, are less favorable than those in the core areas.46 examining natural reproduction according to the ethnic composition of settlements, we can basically come to the same conclusions as in the case of migration: where the Hungarians live as a local minority, the values of natu- ral reproduction are below the average, whereas where Hungarians compose the majority (and especially the strong majority, over 75%), the values are above average.
43 The analogy of this was described in case of Transylvania by Tamás Kiss: “In scattered communities, the migration loss of the Hungarians is also higher than the already high values of the Romanians, because in ad- dition to the outflow towards western Europe, typical for Romanians as well, the Hungarian networks are also continous.” In: Kiss Tamás, “Demográfiai körkép”: 28. (Authors’ translation).
44 István molnár D., Perifériáról perifériára. Kárpátalja népessége 1869-től napjainkig. [From periphery to periphery. The population of Transcarpathia from 1869 till nowadays], (mTA TK Kisebbségkutató In- tézet – Kalligram: Budapest, 2018).
45 József molnár and István molnár D., “A születésszámok alakulása”.
46 Transcarpathia is not unique in this matter either: the asymmetry between bloc and scattered population of Hungarians is a general phenomenon in the Carpathian basin. (See details in Tátrai Patrik, “A Kárpát- medencei magyar szórványok”).
examining intergenerational assimilation, it can be stated that the proportion of Hun- garian children born in ethnically mixed marriages in Transcarpathia between 2002 and 2016 was 53.0%, which is almost the same as the value in the 2001 census.47 This means that in the Carpathian basin, outside the boundaries of Hungary, Transcarpathia is the only region where the ethnic reproduction of the Hungarian minority exceeds demograph- ic reproduction. This is primarily due to the economic strength of Hungary, and thus to the usefulness and the recently growing prestige of the Hungarian language.48
The most important factor influencing regional differences in assimilation is the local demographics. Accordingly, there is a slight assimilation gain in the territories where Hun- garians live in a bloc (0–0.2‰ per year), while in scattered communities and in the towns along the linguistic boundary, a slight loss (-0.2–1.8 ‰) can be detected.49 Compared to 2001, the assimilation gain of the Hungarians living in a bloc slightly decreased, while the assimilation loss detected in scattered Hungarian communities and in cities somewhat de- creased; therefore, the regional differences of assimilation processes have become somewhat more even. As for the aggregate assimilation balance, it is calculated to be +156 people. This is well within the margin of error, meaning that assimilation in the 21st century has not significantly affected the number of Hungarians in Transcarpathia (Appendix 2).
Summary
The research was an attempt to track the population of Transcarpathian Hungarians in the absence of available census data. As a result of the SummA 2017, it can be stated that the number of Hungarians has decreased, however, the rate of decline is smaller than it was suggested by pessimistic scenarios, or than it was expected based on Hungarian migra- tion statistics. According to our survey, in 2017 the number of Hungarians was estimated between 125 and 135 thousands, most likely around 130 thousands. Notwithstanding, based on the data collection on the field, it can be clearly stated that this number may be much lower if we do not consider the long-term absent population (those working abroad,
47 See József molnár, “Національна ідентичність”
48 However, ethnic assimilation is somewhat different from linguistic assimilation. According to the TAN- Dem 2016 survey, the proportion of those who use the ukrainian language at home in their family but did not use to speak ukrainian in their childhood has slightly increased in the Hungarian sub-sample (see István Csernicskó, “language, language skills and language usage in Transcarpathia based on data from the TANDem 2016 research,” Minority Review, 2. nr. 2. (2017): 41–63).
49 It should be emphasized that this does not include the data of small scattered Hungarian communities, which are likely to have less favorable values.
students) as Transcarpathian residents. Similarly, if a significant proportion (more than a quarter) of the 20,000 Hungarian-speaking Roma—as a result of the current socio- economic conditions—declare Hungarian ethnicity, the number of Hungarians will move towards the upper limit of the specified interval.
These constraints highlight the weaknesses of today’s population and ethnic statistics:
on the one hand, because of increased mobility and multiple residencies, it is difficult to identify a large part of the population as resident of one particular region; on the other hand, ethnic dynamics and demographic processes can be completely divergent—for ex- ample, due to the changing self-classification of the Roma.
In spite of the uncertainties described above, the research SummA 2017 found that the ethno-demographic trends of 1989 and 2001 barely changed after 2001. emigration continues to be the main component (70%) of the decline of the Hungarian population, while—despite some shorter, more favorable periods—natural decrease has grown, caus- ing about 30% of the decline of the 21,000 population loss. However, the extent of the intergenerational assimilation seems to be rather constant and has only a minor influence on the demographics of the Hungarian population, indicating stable ethnic boundaries in the Hungarian-Slavic relation.
In terms of migration, the most important structural explanatory factor is the urban–
rural dichotomy (or differences according to the size of settlement), which confirms that, despite the better employment opportunities and favourable wage conditions available in urban areas, the greater human capital and economic resources of urban residents play an important role in emigration. The urban–rural difference is also a decisive factor in the structural explanation of natural change, but persistent east–west dichotomy seems to be even more important despite the changing demographic conditions. Furthermore, the bal- anced ethnic reproduction, which is unique in the Central and eastern european region, draws attention to the fact that the “demand for ethnicity” is significantly influenced by the economic differences between Hungary and ukraine, by the advantages provided by the kin-state policies of Hungary, and, as a consequence of these two, by the ascribed pres- tige of ethnic groups in Transcarpathia.
appendixes
Appendix 1. Hungarian population in settlements of Transcarpathia inhabited by Hungarians in 2001 and 2017 (in settlements surveyed in SUMMA 2017). The resident population, the number and ratio of Hungarians is based on the 2001 census data for 2001, and on the results of SUMMA 2017 for 2017.
Urban type settlements are indicated with bold, towns with bold and underlined.
Settlement administrative unit resident population (2001) number of Hungarians (2001) ratio of Hungarians, % (2001) number of Hungarians (2017) Shift in the number of Hungarians, % (2001–2017
)
Berehove Berehove town 26 050 12 779 49,1 9410 -26,4
Chop Chop town 8870 3496 39,4 2982 -14,7
Khust Khust town 28 559 1706 6,0 1487 -12,8
Mukacheve mukacheve
town 81 637 6975 8,5 6455 -7,5
uzhhorod uzhhorod town 115 568 7972 6,9 5370 -32,6
Astei Berehivskyi
raion 677 590 87,1 605 2,5
Badalovo Berehivskyi
raion 1714 1682 98,1 1601 -4,8
Bakosh Berehivskyi
raion 988 496 50,2 439 -11,5
Balazher Berehivskyi
raion 816 737 90,3 712 -3,4
Batovo Berehivskyi
raion 3023 1894 62,7 1632 -13,8
Settlement administrative unit resident population (2001) number of Hungarians (2001) ratio of Hungarians, % (2001) number of Hungarians (2017) Shift in the number of Hungarians, % (2001–2017
)
Batrad Berehivskyi
raion 1846 1304 70,6 1137 -12,8
Bene Berehivskyi
raion 1409 1270 90,1 1091 -14,1
Berehuifalu Berehivskyi raion 1926 1407 73,1 1183 -15,9
Borzhava Berehivskyi
raion 1502 1426 94,9 1273 -10,7
Chetfalva Berehivskyi
raion 755 731 96,8 717 -1,9
Choma Berehivskyi
raion 916 807 88,1 653 -19,1
Dyida Berehivskyi
raion 2013 1607 79,8 1465 -8,8
Halabor Berehivskyi
raion 752 738 98,1 616 -16,5
Hat Berehivskyi
raion 3122 2561 82,0 2435 -4,9
Hecha Berehivskyi
raion 1030 913 88,6 775 -15,1
Heten Berehivskyi
raion 761 749 98,4 641 -14,4
Horonhlab Berehivskyi raion 797 632 79,3 590 -6,6
Hut Berehivskyi
raion 1353 1295 95,7 973 -24,9
Settlement administrative unit resident population (2001) number of Hungarians (2001) ratio of Hungarians, % (2001) number of Hungarians (2017) Shift in the number of Hungarians, % (2001–2017
)
Kidosh Berehivskyi
raion 895 781 87,3 812 4,0
Koson Berehivskyi
raion 2338 2087 89,3 1830 -12,3
mala Byi-
han Berehivskyi
raion 1300 1003 77,2 810 -19,2
male
Popovo Berehivskyi
raion 210 204 97,1 208 2,0
mochola Berehivskyi
raion 675 545 80,7 516 -5,3
muzhiievo Berehivskyi
raion 2086 1714 82,2 1362 -20,5
orosiievo Berehivskyi
raion 895 852 95,2 742 -12,9
Popovo Berehivskyi
raion 929 909 97,8 743 -18,3
Rafainovo Berehivskyi
raion 974 936 96,1 701 -25,1
Shom Berehivskyi
raion 1091 1040 95,3 873 -16,1
Svoboda Berehivskyi
raion 854 284 33,3 263 -7,4
Vary Berehivskyi
raion 3147 2552 81,1 2082 -18,4
Velyka
Bakta Berehivskyi
raion 1047 326 31,1 307 -5,8
Settlement administrative unit resident population (2001) number of Hungarians (2001) ratio of Hungarians, % (2001) number of Hungarians (2017) Shift in the number of Hungarians, % (2001–2017
)
Velyki
Berehy Berehivskyi
raion 2540 2004 78,9 1665 -16,9
Velyka
Byihan Berehivskyi
raion 1893 1657 87,5 1401 -15,4
Yanoshi Berehivskyi
raion 2030 1657 81,6 1375 -17,0
Zapson Berehivskyi
raion 1799 1657 92,1 1471 -11,2
Vyshkovo Khustskyi raion 8142 3699 45,4 3473 -6,1
Barkasovo mukachivsyi
raion 2236 1452 64,9 1102 -24,1
Chomonyn mukachivskyi raion 2265 2116 93,4 1824 -13,8
Dertsen mukachivskyi
raion 2793 2727 97,6 2499 -8,4
Fornosh mukachivskyi
raion 1455 1412 97,0 1263 -10,6
Rakoshyno mukachivskyi raion 3280 1493 45,5 1215 -18,6
Serne mukachivskyi
raion 1979 1690 85,4 1438 -14,9
Zhniatyno mukachivskyi
raion 2243 1435 64,0 1358 -5,4
Botar Vynohradivskyi
raion 924 882 95,5 876 -0,7
Settlement administrative unit resident population (2001) number of Hungarians (2001) ratio of Hungarians, % (2001) number of Hungarians (2017) Shift in the number of Hungarians, % (2001–2017
)
Chepa Vynohradivskyi
raion 1943 1110 57,1 920 -17,1
Chornoty-
siv Vynohradivskyi
raion 2232 715 32,0 734 2,7
Chornyi
Potik Vynohradivskyi
raion 1074 999 93,0 1010 1,1
Diula Vynohradivskyi
raion 1421 1360 95,7 1216 -10,6
Fanchykovo Vynohradivskyi raion 2059 770 37,4 734 -4,7
Ferteshol-
mash Vynohradivskyi
raion 1070 989 92,4 867 -12,3
Forholan Vynohradivskyi
raion 890 861 96,7 870 1,0
Hudia Vynohradivskyi
raion 592 241 40,7 183 -24,1
Karachyn Vynohradivskyi
raion 400 336 84,0 307 -8,6
Koroleve Vynohradivskyi
raion 8064 510 6,3 401 -21,4
matiivo Vynohradivskyi
raion 1079 715 66,3 624 -12,7
Nevetlen-
folu Vynohradivskyi
raion 1632 1401 85,8 1310 -6,5
Nove
Klynove Vynohradivskyi
raion 314 215 68,5 207 -3,7
Settlement administrative unit resident population (2001) number of Hungarians (2001) ratio of Hungarians, % (2001) number of Hungarians (2017) Shift in the number of Hungarians, % (2001–2017
)
Nove Selo Vynohradivskyi
raion 1865 1252 67,1 1067 -14,8
okli Vynohradivskyi
raion 366 350 95,6 260 -25,7
okli Hed Vynohradivskyi
raion 611 597 97,7 600 0,5
Perekhrestia Vynohradivskyi raion 927 687 74,1 528 -23,1
Pyiterfolvo Vynohradivskyi raion 2016 1937 96,1 1955 0,9
Shalanky Vynohradivskyi
raion 3110 2738 88,0 2480 -9,4
Tekovo Vynohradivskyi
raion 1546 418 27,0 392 -6,2
Tysobyken Vynohradivskyi
raion 2216 2144 96,8 2221 3,6
Velyka
Palad Vynohradivskyi
raion 1824 1773 97,2 1603 -9,6
Verbovets Vynohradivskyi
raion 1206 1088 90,2 1084 -0,4
Vilok Vynohradivskyi
raion 3422 2772 81,0 2635 -4,9
Vynohradiv Vynohradivskyi
raion 25 383 3633 14,3 3149 -13,3
Kobilecka
Poliana Rakhivskyi
raion 3392 491 14,5 441 -10,2
Settlement administrative unit resident population (2001) number of Hungarians (2001) ratio of Hungarians, % (2001) number of Hungarians (2017) Shift in the number of Hungarians, % (2001–2017
)
yasinia Rakhivskyi
raion 8043 809 10,1 764 -5,6
Velikyi
Bichkiv Rakhivskyi
raion 9423 341 3,6 259 -24,0
rakhiv Rakhivskyi
raion 14 969 1037 6,9 847 -18,3
Svaliava Svaliavskyi
raion 16 983 335 2,0 257 -23,3
Solotvino Tiachivskyi
raion 8956 2193 24,5 1742 -20,6
Bushtino Tiachivskyi
raion 8506 341 4,0 302 -11,4
okruhla Tiachivskyi
raion 573 20 3,5 15 -25,0
tiachiv Tiachivskyi
raion 9519 2306 24,2 2078 -9,9
Batfa uzhhorodskyi
raion 231 183 79,2 107 -41,5
Botfalva uzhhorodskyi
raion 579 379 65,5 347 -8,4
Chaslivtsi uzhhorodskyi
raion 820 424 51,7 372 -12,3
Chervone uzhhorodskyi
raion 869 126 14,5 120 -4,8
esen uzhhorodskyi
raion 1677 1607 95,8 1384 -13,9