Effect of carbon limitation on photosynthetic electron transport in Nannochloropsis oculata
Tomáš Zavřel, Milán Szabó, Bojan Tamburic, Christian Evenhuis, Unnikrishnan Kuzhiumparambil, Petra Literáková, Anthony W.D.
Larkum, John A. Raven, Jan Červený, Peter J. Ralph
PII: S1011-1344(17)31068-0
DOI: doi:10.1016/j.jphotobiol.2018.02.020
Reference: JPB 11154
To appear in: Journal of Photochemistry & Photobiology, B: Biology Received date: 20 August 2017
Revised date: 17 February 2018 Accepted date: 17 February 2018
Please cite this article as: Tomáš Zavřel, Milán Szabó, Bojan Tamburic, Christian Evenhuis, Unnikrishnan Kuzhiumparambil, Petra Literáková, Anthony W.D. Larkum, John A. Raven, Jan Červený, Peter J. Ralph , Effect of carbon limitation on photosynthetic electron transport in Nannochloropsis oculata. The address for the corresponding author was captured as affiliation for all authors. Please check if appropriate. Jpb(2017), doi:10.1016/j.jphotobiol.2018.02.020
This is a PDF file of an unedited manuscript that has been accepted for publication. As a service to our customers we are providing this early version of the manuscript. The manuscript will undergo copyediting, typesetting, and review of the resulting proof before it is published in its final form. Please note that during the production process errors may be discovered which could affect the content, and all legal disclaimers that apply to the journal pertain.
ACCEPTED MANUSCRIPT
1
Effect of carbon limitation on photosynthetic electron transport in Nannochloropsis oculata
Tomáš Zavřel#1,*, Milán Szabó#2,3,*, Bojan Tamburic2, Christian Evenhuis2, Unnikrishnan Kuzhiumparambil2, Petra Literáková1, Anthony W. D. Larkum2, John A. Raven2,4, Jan Červený1, Peter J. Ralph2
1 Global Change Research Institute CAS, Bělidla 986/4a, 603 00, Brno, Czech Republic
2 Climate Change Cluster (C3), University of Technology Sydney, Ultimo, NSW 2007, Australia
3 Institute of Plant Biology, Biological Research Centre, Hungarian Academy of Sciences, H- 6726 Szeged, Temesvári krt 62., Hungary
4 Division of Plant Science, University of Dundee at the James Hutton Institute, Invergowrie, Dundee DD2 5DA, UK
#: these authors contributed equally to the study
*Corresponding author(s): Tomáš Zavřel and Milán Szabó Abstract
This study describes the impacts of inorganic carbon limitation on the photosynthetic efficiency and operation of photosynthetic electron transport pathways in the biofuel-candidate microalga Nannochloropsis oculata. Using a combination of highly-controlled cultivation setup (photobioreactor), variable chlorophyll a fluorescence and transient spectroscopy methods (electrochromic shift (ECS) and P700 redox kinetics), we showed that net photosynthesis and effective quantum yield of Photosystem II (PSII) decreased in N. oculata under carbon limitation. This was accompanied by a transient increase in total proton motive force and energy-dependent non-photochemical quenching as well as slightly elevated respiration. On the other hand, under carbon limitation the rapid increase in proton motive force (PMF, estimated from the total ECS signal) was also accompanied by reduced conductivity of ATP synthase to protons (estimated from the rate of ECS decay in dark after actinic illumination).
This indicates that the slow operation of ATP synthase results in the transient build-up of PMF, which leads to the activation of fast energy dissipation mechanisms such as energy-dependent non-photochemical quenching. N. oculata also increased content of lipids under carbon limitation, which compensated for reduced NAPDH consumption during decreased CO2
fixation. The integrated knowledge of the underlying energetic regulation of photosynthetic processes attained with a combination of biophysical methods may be used to identify photo- physiological signatures of the onset of carbon limitation in microalgal cultivation systems, as well as to potentially identify microalgal strains that can better acclimate to carbon limitation.
ACCEPTED MANUSCRIPT
2 Keywords
Photosynthesis, microalgae, bioenergetics, photobiology, stress physiology, photobioreactor
1. Introduction
Microalgae are a diverse group of unicellular organisms with a wide range of metabolic and photosynthetic strategies. This makes them extremely successful inhabitants of a broad range of ecological niches, from nutrient-rich freshwaters, across marine habitats, to extreme environments such as sea ice. Besides their crucial role in global primary productivity and biogeochemical cycling of key elements such as carbon, nitrogen, phosphorus and sulphur, microalgae have also been identified as a rich source of metabolites or ‘high value products’
including proteins, polysaccharides, lipids, pigments, vitamins and antioxidants [1,2].
Most microalgae are photoautotrophs, meaning they are able to produce biomass from solar energy, carbon dioxide, water and other essential elements, and they are therefore considered as potential renewable energy feedstocks. Light and carbon availability are two essential factors that determine algal productivity, especially in large scale cultivation systems when microalgal cell density is high [3]. The conversion of light energy to biomass is driven by photosynthesis, a process in which the energy of (sun)light is used to extract electrons from H2O whilst also generating O2 as a by-product. The electrons are transported through a series of thylakoid- bound proteins including photosystem II (PSII), plastoquinone (PQ) pool, the cytochrome b6/f complex (cyt b6/f) and photosystem I (PSI), and they are used in the reduction of Ferredoxin (Fd) and NADP+. This electron transfer process is denoted as linear electron flow (LEF). The LEF is coupled to the movement of protons into the internal space of the thylakoids (lumen), which is connected to the build-up of an electrochemical potential (alternatively called proton motive force, PMF), which consists of a proton gradient component, ΔpH and a membrane potential component across the thylakoid membrane, Δψ. The proton flow determines production of ATP and the electron flow determines production of NADPH. Together, both pathways determine cellular energetic balance, the ATP/NADPH ratio, which needs to be maintained at sufficient level in order to supply cellular processes, including CO2 fixation, with energy from conversion of ATP to ADP+Pi and reducing equivalents [4]. ΔpH also has an important function in regulating photoprotective responses, such as non-photochemical quenching (NPQ). An increase in ΔpH, reflecting acidification of the thylakoid lumen, activates the so-called energy-dependent component of NPQ, qE, which acts as a fast energy dissipative mechanism that helps cells to avoid photo-oxidative stress (e.g. [5]). Both ATP and NADPH are subsequently used in the Calvin-Benson cycle to produce glyceraldehyde-3- phosphate from CO2 by the enzyme ribulose bisphosphate carboxylase oxygenase (RuBisCO), a key enzyme in this cycle (reviewed e.g. in [6]). Fixation of 1 CO2 molecule requires an ATP/NADPH ratio of at least 3/2; however it has been shown that LEF can only generate an ATP/NADPH ratio of 2.57/2, and mechanisms other than LEF are thus required to supply additional ATP to enhance this ratio [4]. This increased ATP demand may be supplied via alternative electron flow pathways such as the cyclic electron flow around PSI (PSI-CEF) (for
ACCEPTED MANUSCRIPT
3
review, see e.g. [4,7]). Carbon concentrating mechanisms (CCMs) maintain the CO2/O2 ratio sufficiently high at the site of RuBisCO to greatly restrict oxygenation reactions, and hence photorespiration [8]). CCMs are energized mainly via the photosynthetic reactions of the thylakoid membrane; however, in some cases CCMs are energised via mitochondrial ATP synthesis [9] (recently reviewed in [8]). In air-equilibrated seawater, CCMs operate to provide the required CO2/O2 favouring the carboxylation reactions; however, this might be counterbalanced by CO2 leaking from the internal inorganic carbon (Ci) pool [10]. Irrespective of the exact source of energy supply for CCMs, the circulating electrons in alternative electron flow pathways increase PMF and supply additional ATP required to balance the ATP/NADPH ratio (note that NADPH is not produced via alternative electron flow pathways).
Carbon availability determines photosynthetic performance. The dependence of photosynthesis on inorganic carbon concentration as well as carbon dioxide leakage have been investigated extensively using oxygen electrode and membrane-inlet mass spectrometry (MIMS) techniques [9,11–13] (also reviewed in [8]). The non-invasive chlorophyll fluorescence/kinetic spectroscopy techniques such as variable chlorophyll fluorescence [14–16], absorbance changes of PSI reaction centres (P700+) [17] or a combination of these non-invasive bio-optical methods [18–20] give information about the photosynthetic proton and electron transfer processes when carbon availability changes. More recently, the impact of carbon limitation on net photosynthesis and growth of N. oculata (Eustigmatophyceae) has been investigated thoroughly in a photobioreactor, and it was identified that the efficiency of gas transfer and gas exchange is a crucial factor that determines the degree of carbon limitation and thus primary productivity [21]. Nannochloropsis sp. is a promising biofuel-candidate alga, therefore understanding the photosynthetic processes and dissipative light energy mechanism in Nannochloropsis sp. has received increasing attention recently [22–25].
Although the light energy utilisation and energy dissipation mechanisms have been extensively investigated in Nannochloropsis sp., there is still a significant gap in knowledge regarding the operation of LEF and PSI-CEF, particularly at the onset of inorganic carbon limitation in this species. The main aim of this study was to identify the effect of inorganic carbon (Ci) limitation on photosynthesis in N. oculata. The specific objectives were to investigate i) the photochemical efficiency, electron transport rate and non-photochemical energy dissipation under CO2 limitation, ii) the impacts of CO2 limitation on the energetic balance of photosynthesis, in particular changes in the PMF and ATP synthesis, and iii) the potential induction of PSI-CEF under CO2 limitation. N. oculata is known for accumulation of fatty acids under nitrogen starvation (e.g. [22]). Therefore, the profile of fatty-acid methyl esters (FAME) under carbon limitation was also investigated to determine whether FAME synthesis was affected under these conditions.
2. Materials and Methods 2.1. Algal material
ACCEPTED MANUSCRIPT
4
Stock cultures of the microalga Nannochloropsis oculata (Droop) Green (Australian National Algae Culture Collection; strain CS-179) were cultivated in Guillard’s F seawater medium:
artificial sea water (salinity 33, HCO3-: ~152 mgL-1) enriched with 109 mgL-1 NO3, 9 mgL-1 PO4, micronutrients (FeCl3.6H2O, CuSO4.5H2O, ZnSO4.7H2O, CoCl2.6H2O, MnCl2.4H2O, Na2MoO4.2H2O) and vitamin mix (Vitamin B12, Vitamin B1, Vitamin H) according to Guillard RRL & Ryther JH (1962) [26]. The cultures were grown in 200 mL Erlenmeyer flasks at 20 °C under cool-white fluorescent light with an irradiance of 50 μmolphotons m-2 s-1 and 12/12 light/dark cycle according to [21].
2.2. Experimental photobioreactor setup
During experiments, N. oculata was cultured in a 400 mL flat panel photobioreactor (FMT- 150, Photon Systems Instruments, Brno, Czech Republic). The photobioreactor illumination consisted of red and blue LEDs ((red: λmax ≈ 633 nm, λ1/2 ≈ 20 nm, Luxeon LXHLPD09; white:
Luxeon LXHL-PW09; blue: λmax ≈ 445 nm, λ1/2 ≈ 20 nm, Luxeon LXHL-PR09; all manufactured by Future Lighting Solutions, Montreal, QC, Canada). The photobioreactor continuously measured optical density at 680 nm and 720 nm by an inbuilt densitometer and steady-state pigment fluorescence emission yield by an inbuilt fluorometer, both described in detail in [27]. The culture was mixed by aeration (200 mL min-1, instrument grade air, BOC Australia, North Ryde, NSW, AU) complemented by stirring with a magnetic bar. Dissolved O2 was monitored by a microelectrode (InPro6800), pH and temperature were monitored by a combined electrode (InPro3253, both manufactured by MettlerToledo, Inc.).
2.3. Experimental design
N. oculata was inoculated into the photobioreactor vessel by diluting the stock culture with F medium to the final concentration of 5x10⁶ cells mL-1 (OD720 ~ 0.15). The cells were cultivated under a 12/12 light/dark cycles (each light cycle started at 09:00 hr, the dark cycles started at 21:00 hr) for several days until the culture density reached approximately 2x10⁷ cells mL-1, which corresponded to OD720 ~ 0.5. After this point, the culture continued to grow, but it was diluted daily back to OD720 ~ 0.5 using a peristaltic pump (Photon Systems Instruments, Brno, Czech Republic) after 2.5 h of every dark cycle.
In the photobioreactor, algae were cultured in F medium at a constant temperature of 20°C.
The irradiance during each light cycle was set to 120 μmolphotons m-2 s-1 of red light supplemented with small portion of blue light (25 μmolphotons m-2 s-1), which provided sufficient irradiance for growth, without initiating excess energy dissipation mechanisms (as indicated in section Results). During each diel light period, pH increased gradually from the initial value of 8.2 to the maximal value of 10.2 as a consequence of bicarbonate uptake by N. oculata cells [21]. Previous work showed that this pH shift is connected with carbon limitation and with a decrease in N. oculata biomass production [21].
A series of measurements was performed during the light periods at two time points, when:
a) pH was still low enough not to limit photosynthesis (pH ~ 8.9, the sampling was performed after 1:50 hours of light cycle, i.e. at 10:50 hr every day) and b) pH reached the daily maximum and photosynthesis was limited significantly (pH ~ 10.2, the sampling was performed after
ACCEPTED MANUSCRIPT
5
10:50 hours of light cycle, i.e. at 19:50 hr every day). At these two time points, samples were extracted to measure variable chlorophyll fluorescence (estimate of LEF), ECS changes (estimate of proton movement across the thylakoid membrane) and redox changes in PSI (estimate of PSI-CEF), as described in the following sections. The photobioreactor was used to continuously monitor steady-state and maximum chlorophyll fluorescence as well as effective quantum yield of PSII (using both red and blue light, with a saturating pulse at 2000 μmolphotons m-2 s-1). In addition, net photosynthesis and respiration were evaluated by measuring oxygen evolution every three hours during the light cycle. The oxygen evolution/respiration measurements were performed in the photobioreactor vessel by turning off aeration for 10 min, during a 5 min dark period followed by a 5 min light period. Net photosynthesis was calculated from the oxygen evolution rate (P) and respiration (R) as net photosynthesis = P - R.
2.4. Variable chlorophyll fluorescence
Variable chlorophyll fluorescence was measured using a Multi-Colour Pulse-Amplitude Modulated (MC-PAM) fluorometer (Heinz-Walz GmbH, Effeltrich, Germany). The photochemical efficiency was estimated by measuring parameters linked to the induced chlorophyll fluorescence, such as relative electron transport rate of PSII (rETR(II)), quantum yield of PSII and non-photochemical quenching (NPQ). In addition, fluorescence induction curves (O-P-S-M-T) were recorded to provide additional insight into NPQ as well as the formation of trans-membrane proton gradients (∆pH). rETR(II) was calculated from photosynthesis vs. irradiance measurements as previously described for N. oculata [28] using the 625 nm light source for both measuring and actinic light (AL). The cells were acclimated to each light intensity including initial dark period for 40 s, and the model of Eilers and Peeters (1988) was used to fit the ETR curves [29]. rETR(II) is expressed in μmolelectrons m-2 s-1 (see also Schreiber et al., 2012 [30]). Fluorescence quenching analysis was performed using ‘induction- recovery curve’ measurements; after recording fluorescence parameters in the dark-acclimated state, 625 nm AL with an intensity of 120 μmolphotons m-2 s-1 was applied for 300 s (induction phase), then AL was switched off and the samples were kept in darkness for an additional 400 s (recovery phase). For saturation pulses (SP), the 625 nm light source was set to an intensity of 3900 μmolphotons m-2 s-1.
Fluorescence induction curves (O-P-S-M-T) were assayed in the same setup as described above using the ‘fast-kinetics’ feature of the MC-PAM to record chlorophyll fluorescence kinetics at high temporal resolution. The same AL was used for illumination (625 nm, 120 μmolphotons m-
2 s-1).
2.5. Electrochromic signal measurements and parameters
To explore the dynamic response in proton movement across the thylakoid membrane in detail, changes in electrochromic absorption shift (electrochromic signal, ECS) were recorded using a Joliot-type LED pump-probe spectrometer (JTS-10, Bio-Logic Science Instruments, USA) at 520 nm. ECS is based on the rapid absorption changes caused by the light-induced build-up of
ACCEPTED MANUSCRIPT
6
a charge difference across the thylakoid membrane by electron movements, and proton movement between the stroma and lumen, which causes a shift of a few nm in the bandwidth of the carotenoid absorption [31]. Since protons are positively charged, the membrane potential difference becomes less lumen-positive as a result of net proton efflux during darkness. With this knowledge, it is possible to derive several parameters that are proportional to the trans- thylakoid PMF [32]; according to this rationale, the following parameters were used in this study: i) ECSt and ii) gH+. ECSt is the total rapid (<1s) ECS change between the ECS signal in the light and the minimum ECS signal in the dark after actinic light (AL) is switched off. ECSt
is proportional to the total light-dark difference in trans-thylakoid PMF. gH+ is the reverse time constant of the single-parameter exponential decay model of ECS signal (ECS) over a few hundred milliseconds after switching off AL and it reflects the proton conductivity of thylakoid membrane, predominantly determined by the activity of ATP synthase [31] (although energy slippage and leakage of protons through the thylakoid membrane might influence the proton concentration available for ATP synthesis; see e.g. [33]).
ECS was measured in differential absorbance mode, based on the absorption difference between a measuring beam that passes through the sample and a reference beam. Cells sampled from the PBR were concentrated and suspended in a thin glass cuvette with an optical path length of 1 mm (Hellma GmbH, Mullheim, Germany). An automated script was used to detect induction and recovery of the ECS signal. A baseline was recorded for 10 s in the dark (zero ECS signal), then AL (630 nm, 120 μmolphotons m-2 s-1) was applied for 10 s to induce ECS changes during photosynthesis induction, and finally AL was switched off to record the dark- relaxation of ECS signal for another 10 s. In the case of ECS induction during steady-state photosynthesis, AL was switched on for 180 s. The ECS signal was analysed according to [32].
Two parameters were calculated from the measurements: ECSt and gH+. The same ECS measurement protocol at 520 nm was also performed in N. oculata suspension incubated with ammonium-chloride (NH4Cl at a concentration of 200 mM) and with nigericin (at a concentration of 50 μM) in order to determine the ECS signal when the transthylakoid proton gradient was completely dissipated (according to [24]) as a negative control.
2.6. P700 redox kinetics measurements
Changes in the redox state of the PSI reaction centre (P700) were measured with a Joliot-type LED pump-probe spectrometer (JTS-10, Bio-Logic Science Instruments, USA) at 705 nm. The measurement is based on the principle of partial oxidation of P700 under continuous AL. It has to be emphasized that formation of P700+,observed as a decrease in absorption at 705 nm (denoted as ΔA705 signal), was assessed without applying a saturation pulse. Therefore, ΔA705
measurements as applied here reflect the redox kinetics of P700+ at near growth irradiance conditions. . After switching off AL, P700+ becomes re-reduced by the LEF (re-formation of P700, increase in absorbance at 705 nm [34]). Under conditions when linear electron flow from PSII is inactive (e.g. in the presence of DCMU), P700+ re-reduction rate slows down significantly, which reflects the impairment of electron flow from PSII. Acceleration of P700+
re-reduction rate in DCMU treated samples indicates the activation of alternative electron flow processes, possibly PSI-CEF.
ACCEPTED MANUSCRIPT
7
An automated script was used to detect induction and recovery of light-induced redox changes of P700. A baseline was recorded for 10 s in the dark, AL (630 nm, 120 μmolphotons m-2 s-1, similar to growth irradiance,refer to ‘Experimental design’) was switched on for 10 s to oxidise P700 (conversion of P700 to P700+), then AL was switched off to record the re-reduction of P700+
(conversion of P700+ to P700). The re-reduction rate is expressed as 1/, where is the time constant of re-reduction kinetics, obtained by a single parameter exponential decay fitting (see [23]). To determine the rate of PSI-CEF under the actinic light conditions that represent near growth irradiance, the same measurements were performed on cells that were incubated with 80 μM 3-(3,4-dichlorophenyl)-1,1-dimethylurea (DCMU) to block LEF. LEF was then calculated as CEF subtracted from total electron flow (when P700+ re-reduction rate was measured in the absence of DCMU).
2.7. Fatty-acid methyl ester (FAME) analysis
Washed cell pellets were freeze-dried with a lyophilizer and lipids were extracted with 3 mL of chloroform/methanol (2/1, v/v) by vortexing and centrifugation. The supernatants were collected and residues were re-extracted three times with 2 mL of chloroform/methanol mixture (1/1, v/v). The pooled supernatants were washed with 2 mL of saturated sodium chloride solution. The lower organic phases were collected and evaporated to dryness under nitrogen and the total lipid content was determined gravimetrically.
Extracted lipids were trans-methylated to fatty acid methyl esters (FAME) as previously described [35]. In short, dried lipid mass was treated with 1 mL of 1% NaOH in MeOH, followed by heating for 15 min at 55 °C, addition of 2 ml of 5% methanolic HCl, again heating for 15 min at 55 °C and addition of 1 mL MilliQ water. Nonadecanoic acid (C19:0) was used as the internal standard. FAME were extracted by hexane (3 × 1 mL), evaporated to dryness under nitrogen, redissolved in 200 μL of hexane and stored at −20 °C in glass vials until GC–
MS analysis.
FAME analysis was carried out using gas chromatography system (Agilent 6890 Series) with a mass detector (Agilent 5975, Delaware, USA). Chromatography was carried out using HP- 5MS fused capillary column (5%-phenyl-methylpolysiloxane, 30 m long, 0.25 mm internal diameter, film thickness 0.25 μm, Agilent Technologies) with the inlet temperature held at 280°C. The injection volume was 5 µL. The oven temperature was programmed for 50°C (2 min) to 220°C (4°C/min); 220°C to 300°C (60°C/min) and held for 3 min. FAME peaks were identified by comparison of their retention times with authentic standards and quantified by area normalization and response factor measurements.
2.8. Cell density
N. oculata cell density was determined according to [21]. Briefly, 1 mL of culture was fixed with 1 % glutaraldehyde and stored in the dark at 4°C. For analysis, 10 µL of the fixed suspension was pipetted into a haemocytometer chamber (Neubauer, Germany) and placed under a light microscope (BX50 with analySIS software, Olympus, Victoria, Australia). After 5–10 min of cells settling, images of 15–30 haemocytometer squares were recorded. For
ACCEPTED MANUSCRIPT
8
quantification of N. oculata cells, the resulting JPEG files were processed with a custom ImageJ script.
2.9. Statistical analysis
To test statistical differences between the carbon replete (pH 8.9) and carbon limited conditions (pH 10.2), one-way ANOVA followed by the Tukey’s HSD post-hoc test was used.
3. Results
3.1. Nannochloropsis oculata dynamics across the light-dark cycle
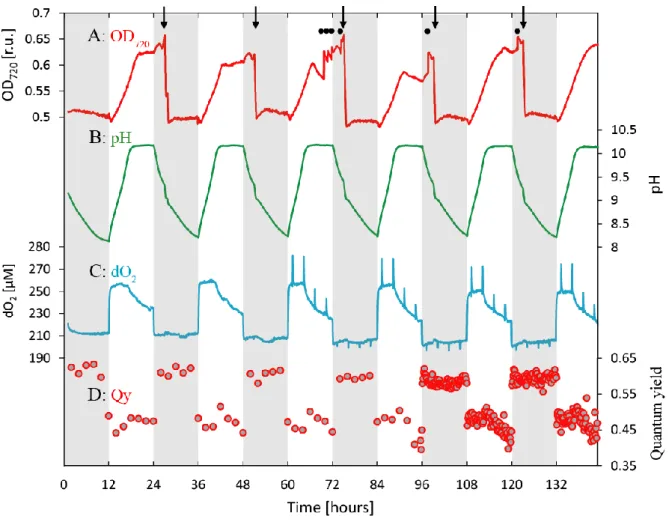
N. oculata was cultivated in a semi-continuous regime. During each light period, the culture density increased from OD720 = 0.50 to OD720 = 0.65 (Figure 1A), which corresponded to 2.7x10⁷ to 3.6x10⁷ cells mL-1 (Figure S1). The culture did not grow after pH reached the maximal value of 10.2. OD720 occasionally decreased at this pH, which was connected to N.
oculata flocculation and settling [36], as confirmed by microalgal re-suspension following increased magnetic stirring rate (Figure 1A). The culture density during dark cycles remained constant after each daily dilution (Figure 1A).
Culture pH increased from an initial value of 8.2 to the final value of 10.2 during the first 6 h of illumination, and it stayed constant for the remainder of the light cycle. pH decreased gradually over the entire 12 h dark cycle to reach the initial value of 8.2 at the beginning of the next light period (Figure 1B).
Dissolved oxygen (dO2) reached a steady-state value within the first 30 min of illumination and it remained constant (or it increased slowly due to increasing cell and chlorophyll concentration, Figure S2) for 4.0-4.5 h. After pH reached its maximal value of 10.2, dO2 started to decrease, which was indicative of photosynthesis limitation under high pH. During the dark period, dO2 decreased within 30 min to a value below the chemical equilibrium (indicating active respiration) and it remained constant for the remainder of the dark period (Figure 1C).
Growth of N. oculata in the semi-continuous regime was reproducible throughout all experiments; dynamics of OD720, pH and dO2 from another replicate of the experiment represented in Figure 1 is shown in Figure S3.
The photobioreactor was used to measure the quantum yield of PSII over the light and dark cycles (Figure 1D). In the dark, Fv/Fm remained constant at a value of approximately 0.6. At the beginning of the light cycle, effective quantum yield (Y(II)) decreased to a value of 0.5 and it remained constant until pH increased to its maximum of 10.2; at this time, Y(II) started to decline towards a minimum around 0.42 at the end of the light cycle.
ACCEPTED MANUSCRIPT
9
Figure 1. Typical culture parameter dynamics for Nannochloropsis oculata cultivated under a semi-continuous regime in a flat-plate photobioreactor. A (red line): optical density measured at 720 nm (OD720); B (green line): pH; C (blue line): dissolved O2 (dO2); D (red dots): effective quantum yield of photosystem II during the light cycle (Y(II)) and maximum quantum yield (FV/FM) during the dark cycle. Arrows in panel (A) represent daily culture dilution with fresh medium, and black dots represent magnetic stirring increase from 300 rpm to 600 rpm to re- suspend flocculated cells. The rapid substantial decrease in OD720 during every night cycle was thus connected with periodic re-addition of fresh medium to the culture. The slower and less pronounced drops in OD720 are caused by cells flocculation at high pH. Spikes in panel (C) during days 3-6 represent periodic measurement of oxygen production within the photobioreactor vessel. Grey shading represents dark cycles. Quantum yields of photosystem II (red dots) were measured at 2 h intervals on days 1-4, and at 10 min intervals on days 5 and 6.
Oxygen evolution by N. oculata significantly decreased when the cultures reached pH 10.2.
Figure 2 shows a typical dynamic trace in pH during the light cycle, together with net photosynthesis and respiration rates as measured by oxygen production or consumption within the photobioreactor vessel. The initial oxygen production rate measured at pH 8.9
ACCEPTED MANUSCRIPT
10
(7.50 μM O2 min-1) slightly decreased at pH 10.0 (6.93 μM O2 min-1) and significantly decreased at pH 10.2 during the second part of the light period (5.04 μM O2 min-1 and 4.40 μM O2 min-1, ANOVA: p<0.001, Figure 2A). This decrease in oxygen production rates represents a reduction in the photosynthetic activity (when compared to the initial time point) by 33% and 41%, respectively. Respiration increased from 1.57 μM O2 min-1 at pH 8.9 to 1.78 μM O2 min-1 at pH 10.0. At pH 10.2 respiration further increased to 1.85 μM O2 min-1 and finally to 1.93 μM O2 min-1, which represents a 17% and 23% increase when compared to the original activity at pH 8.9 (Figure 2B). Respiration rate measured at pH 10.2 after 10:50 hours in the light was significantly higher than at pH 8.9 (ANOVA: p<0.05).
The mechanism linked to the reduced photosynthesis at pH 10.2 was analysed further by measuring the photosynthetic electron transport rate, non-photochemical quenching, proton transport across the thylakoid membrane, and cyclic electron transport around PSI under carbon replete (pH 8.9, samples taken after 1:50 h of the light cycle) and carbon deplete conditions (pH 10.2, samples taken after 10:50 h of the light cycle).
ACCEPTED MANUSCRIPT
11
Figure 2. Net photosynthesis (white bars, panel A) and respiration (black bars, panel B) rates together with a typical pH trace (green line in panel A) during the light cycle of N. oculata.
The oxygen production/consumption rates were calculated from 12 day cycles within four independent semi-continuous experiments, error bars represent standard deviations. Arrows mark time points selected for further measurements of chlorophyll fluorescence and carotenoid and P700 absorption changes in carbon replete (pH 8.9) and carbon depleted (pH 10.2) samples.
The double asterisks mark photosynthesis / respiration rates significantly differing from the initial time point at pH 8.9 with p<0.01, the triple asterisks mark variations with p<0.001 (Tukey’s HSD post-hoc test following one-way ANOVA).
3.2. Efficiency of PSII electron transport rate
The photosynthesis vs. irradiance relationships of carbon replete and depleted N. oculata cultures were investigated in order to determine the electron transport rate (‘light curve’
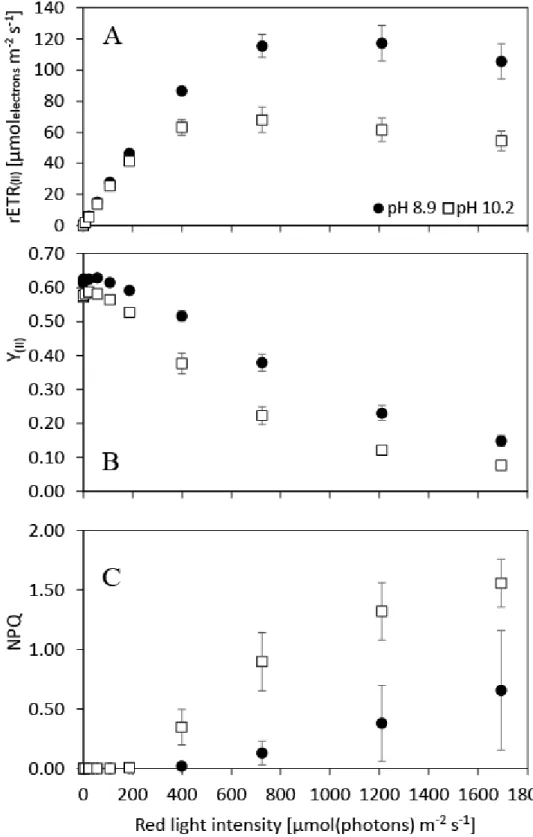
parameters), the effective quantum yield of PSII (Y(II)) and the characteristics of the photoprotective response (NPQ). Maximal relative electron transport rate of PSII (rETR(II)max) at pH 10.2 (69 ± 8) reached only 57% of the rETR(II)max as measured at pH 8.9. (120± 10), which suggests a significant decrease (ANOVA: p<0.001) in photosynthetic rate at pH 10.2 (Figure 3A). Similarly, saturating irradiance (Ik, the rETR(II) optimum) was lower for cultures at pH 10.2 (245 ± 38 μmolphotons m-2 s-1 ) than at pH 8.9 (451 ± 43 μmolphotons m-2 s-1). On the other hand, the rETR(II) initial slopes (α) were very similar under both conditions (0.267 ± 0.003 at pH 8.9 and 0.284 ± 0.010 at pH 10.2, respectively), suggesting similar PSII absorption cross- section. Based on the ETR curve, N. oculata growth was light-limited at the cultivation irradiance of 145 μmolphotons m-2 s-1 at both tested pH levels.
Effective quantum yield of PSII (Y(II)) in the range of light intensities 0-1700 μmolphotons m-2 s-
1 was lower at pH 10.2 (Figure 3B). At irradiance up to 110 μmolphotons m-2 s-1, the relative Y(II)
difference between pH 8.9 and 10.2 was lower by 10%. At higher irradiances, the differences between cultures at pH 8.9 and 10.2 increased and, at the highest irradiance, the relative difference was 49%. Maximum Y(II) at 0 PAR after 40 s of darkness was slightly lower in cultures sampled at pH 10.2 (0.57 ± 0.01 compared to 0.61 ± 0.01 at pH 8.9).
Non-photochemical quenching (NPQ) under irradiances below 200 μmolphotons m-2 s-1 was nearly zero (up to 0.01) under both tested pH levels. At an irradiance of 400 μmolphotons m-2 s-1 (3.3x the cultivation irradiance), NPQ was induced at pH 10.2 (0.35 ± 0.15) and it increased up to the maximal value of 1.56 ± 0.20 under the highest irradiance of 1700 μmolphotons m-2 s-1. NPQ at pH 8.9 was almost negligible at 400 μmolphotons m-2 s-1 (0.02 ± 0.01), it was slightly induced at a light intensity of 725 μmolphotons m-2 s-1 (6x the cultivation irradiance, NPQ:
0.13 ± 0.10), and it increased up to 0.65 ± 0.50 under the highest light intensity of 1700 μmolphotons m-2 s-1 (14x the cultivation irradiance, Figure 3C).
ACCEPTED MANUSCRIPT
12
Figure 3. Photosynthesis vs. irradiance curves as measured by chlorophyll fluorescence. A:
relative electron transport rate of PSII (rETR(II), B: effective quantum yield of PSII (Y(II)), C:
non-photochemical quenching (NPQ) as a function of irradiance. Black dots represent samples measured under carbon-replete conditions (pH 8.9), white squares represent samples from carbon-limited cultures (pH 10.2). The cells were acclimated to each light intensity including initial dark period for 40 s. Error bars represent standard deviations, n=5.
ACCEPTED MANUSCRIPT
13
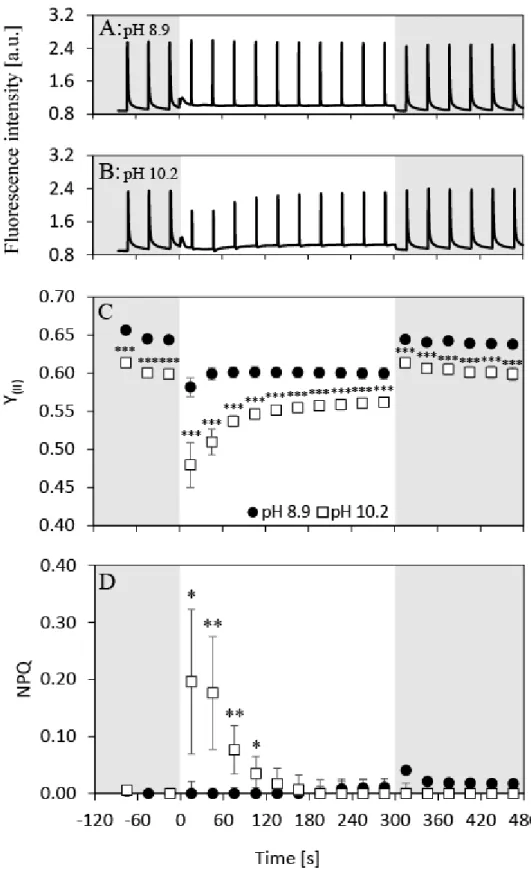
In order to assess the response of chlorophyll fluorescence parameters during an 8 min dark- light-dark cycle over time, slow (Kautsky) chlorophyll fluorescence induction kinetics under the cultivation irradiance of 120 μmolphotons m-2 s-1 were recorded (Figure 4). The characteristics of the induction curves were different at pH 8.9 and 10.2. While the fluorescence intensities were largely unchanged at pH 8.9 over the entire measurement cycle (Figure 4A), a pronounced decline in maximal fluorescence at the onset of AL could be observed at pH 10.2 (Figure 4B). At pH 10.2, Y(II) dropped at the onset of growth irradiance to levels significantly lower than at pH 8.9 (0.48 ± 0.03 when compared to 0.58 ± 0.01, ANOVA: p<0.001, Figure 4C) and it recovered to ~95% of the dark-adapted FV/FM value over 300 s of illumination. However, Y(II) remained significantly lower at pH 10.2 when compared to pH 8.9 (ANOVA: p<0.001), indicating decreased LEF under carbon limitation. Maximum quantum yield of PSII as measured in the dark (FV/FM) was reduced at pH 10.2 from 0.64 ± 0.004 to 0.59 ± 0.002 (ANOVA: p<0.001). No NPQ was recorded in the dark or under prolonged illumination at both pH levels. However, significant NPQ increase (up to 0.20 ± 0.13, (ANOVA: p=0.013) was induced at the beginning of the illumination phase at pH 10.2 (Figure 4D). Interestingly, this NPQ induction was transient, as it diminished to zero under prolonged illumination. It should be noted that NPQ was not activated during the light curve measurements at irradiances below 200 μmolphotons m-2 s-1 (Figure 3C), whereas NPQ was formed at irradiances under 120 μmolphotons m-2 s-1 during fluorescence induction (Figure 4D), which however relaxed within ~120 s of actinic illumination. The two methods thus allowed the analysis of NPQ characteristics under Ci limitation from different aspects (transient NPQ activation under AL vs. its overall magnitude over a range of PAR).
Y(II) as measured by MC-PAM was 25% higher than as measured by the photobioreactor FMT- 150 fluorometer. This discrepancy can be associated with differing chlorophyll fluorescence induction irradiances; in the MC-PAM, only 625 nm light was used for the saturation pulse (SP), whereas in the photobioreactor, both 440 nm and 633 nm lights were used (the total SP intensities were similar in both devices, around 4000 μmolphotons m-2 s-1). Nevertheless, lower Y(II) under carbon limitation was observed independently with both chlorophyll fluorescence measuring instruments, as indicated in Figure S4.
ACCEPTED MANUSCRIPT
14
Figure 4. Slow chlorophyll fluorescence induction curves together with calculated effective quantum yields of PSII (Y(II)) and non-photochemical quenching (NPQ) of carbon replete (pH 8.9; black circles) and deplete samples (pH 10.2; white squares). A, B: raw fluorescence traces of N. oculata culture sampled at pH 8.9 (A) and 10.2 (B), C: Y(II), D: NPQ. Fluorescence induction curves were recorded under AL matching the cultivation irradiance in the photobioreactor (120 μmolphotons m-2 s-1 of 625 nm light). The induction curves in panels A and
ACCEPTED MANUSCRIPT
15
B represent one typical measurement of the fluorescent induction curve; the detailed fluorescence dynamics during photosynthesis induction without introduction of saturation pulses is shown in Figure 5. The data points in panels C and D represent Y(II) and NPQ calculated as averages from five independent measurements, error bars in panels C and D represent standard deviations. The asterisks in panel D mark significantly induced NPQ under carbon limitation (Tukey’s HSD post-hoc test following one-way ANOVA, single asterisks (*): p<0.05, double asterisks (**): p<0.01). Y(II) in panel C was significantly lower at pH 10.2 at all measured time points (Tukey’s HSD post-hoc test following one-way ANOVA, triple asterisks (***): p<0.001). Grey rectangles represent dark periods, white rectangles represent AL period.
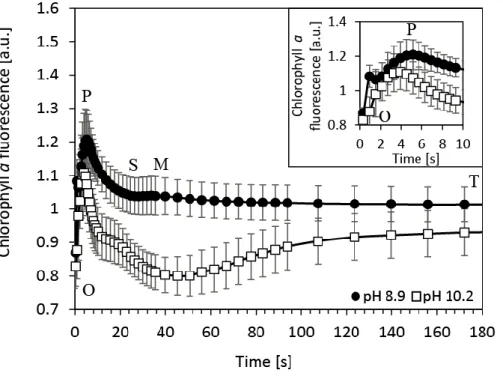
In order to reveal fine changes in photosynthetic processes with high temporal resolution during the fluorescence induction in N. oculata cultures, the so-called O-P-S-M-T chlorophyll fluorescence induction kinetics were measured under the cultivation irradiance (120 μmolphotons
m-2 s-1 of 625 nm light) for 3 min without introducing SP (Figure 5). The initial induction phase (origin-to-peak, O-P) was smaller at pH 10.2 (Figure 5 insert), which suggests reduced total capacity of the electron transport chain [37]. Within the slow induction phase (P-S-M-T), the P-S dip was faster and of larger magnitude at pH 10.2, suggesting lower LEF at pH 10.2 during photosynthesis induction. Chlorophyll fluorescence between the S-M phases increased at pH 8.9, but decreased at pH 10.2, which suggests still lower LEF intensity during approximately 40 s in the light. In fact, the fluorescence intensity continued to decrease for approximately 50 s at pH 10.2. At pH 8.9, a slight fluorescence decrease was detected after the M phase; however, at pH 10.2 the initial 50 s fluorescence decrease was followed by a subsequent increase in fluorescence up to a steady-state photosynthesis plateau after ca. 180 s in the light. This suggests differences in timescale and relative intensities of the photosynthesis induction processes at pH 10.2.
ACCEPTED MANUSCRIPT
16
Figure 5. Slow kinetics of chlorophyll fluorescence induction (O-P-S-M-T) of carbon replete (pH 8.9, black dots) and carbon deplete (pH 10.2, white squares) culture of Nannochloropsis oculata recorded under AL that matched the cultivation irradiance (120 μmolphotons m-2 s-1 of 625 nm light). Data represent the average from 4 measurements at pH 8.9 and from 5 measurements at pH 10.2, respectively; error bars represent standard deviations. The insert figure represents details of chlorophyll fluorescence dynamics within the first 10 s of AL illumination. The fluorescence induction curves represent the same type of dynamics as shown in Figure 4A and 4B without introduction of the SP.
3.3 Proton motive force and proton conductivity of the thylakoid membranes
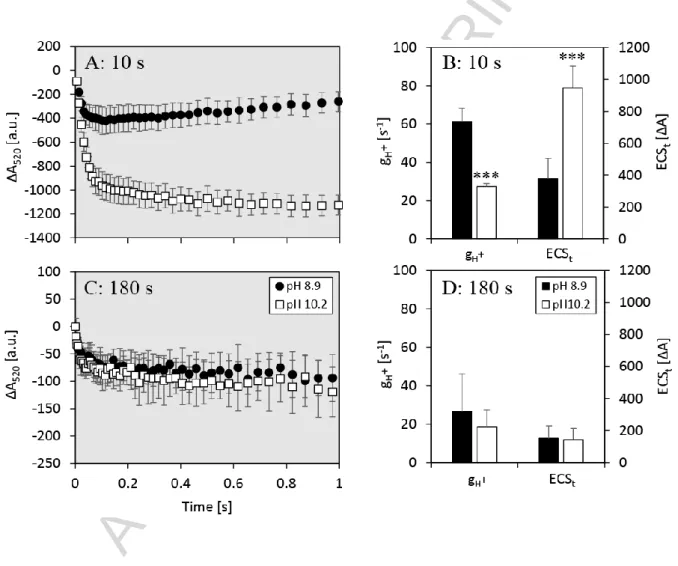
PMF is the driving force for ATP formation by the thylakoid-bound ATPase and it has two components: an electric field and a proton gradient (or pH gradient). The electric field across the thylakoid membrane can be measured using the electrochromic shift (ECS) (e.g. [31]). The ECS was measured in N. oculata after 10 s of illumination (Figure 6A, 6B; photosynthesis induction, in this phase significant NPQ was induced and Y(II) reduction was more pronounced at pH 10.2), and after 180 s of illumination (Figure 6C, 6D; steady-state photosynthesis, with NPQ reduced to zero and Y(II) still decreased significantly, as shown in Figure 4). The inverse time constant of the ECS decay after switching off AL (gH+, referring to 1/τECS [32]) at pH 10.2 was significantly lower after 10 s of illumination (ANOVA: p<0.001, Figure 6B), however, the difference disappeared after 180 s (ANOVA: p=0.27, Figure 6D). This indicates a smaller permeability of the thylakoid membrane to protons and reduced ATP production under carbon limitation at the onset of illumination at pH 10.2 (Figure 6B). After 180 s of illumination, gH+
decreased to similar levels at both pH levels 8.9 and 10.2 (Figure 6D). As a negative control of ECS measurement, two protons uncouplers were used: nigericin and ammonium chloride.
Nigericin, an electroneutral antiporter that equilibrates K+ and H+ across the membrane
ACCEPTED MANUSCRIPT
17
(dissipating ΔpH, but preserving Δψ) largely abolished ECSt, and left only a small fraction that could be attributed to membrane potential (Figure S5, see also [38]). The transthylakoid proton gradient uncoupler NH4Cl completely abolished ECS decay after illumination (Figure S5, [24]), which is consistent with NH4Cl eliminating both membrane potential and pH gradient.
This might be due to the fact that NH4Cl also could inhibit the donor side of PSII and thus formation of membrane potential (e.g. [39,40]).
ECSt was significantly higher in pH 10.2 samples during initial photosynthesis (10 s in light, ANOVA: p<0.001, Figure 6B); however, after 180 s in light (steady-state photosynthesis, only negligible NPQ remained), ECSt was reduced to similar values at both pH levels, which indicates small PMF formation during steady-state photosynthesis (Figure 6D).
Figure 6. Electrochromic shift (ECS) recorded at 520 nm as an estimate of proton movement across the thylakoid membrane during initial photosynthesis (after 10 s of illumination) and steady-state photosynthesis (after 180 s of illumination) in carbon replete (pH 8.9, black dots / bars) and carbon deplete N. oculata culture (pH 10.2, white dots / bars). Panels A, C show raw ECS traces (timescale <1s) upon switching off AL after 10 s (A) and 180 s (C) of illumination (120 μmolphotons m-2 s-1 at 630 nm). Panels B, D show calculated parameters gH+ (inverse value of ECS decay rate (τECS), obtained by a single exponential decay fit [32]) and ECSt (ECS amplitude) following 10 s (B) and 180 s (D) of illumination, respectively. Error bars represent
ACCEPTED MANUSCRIPT
18
standard deviations, n=4. Triple asterisks in panels B mark gH+and ECSt that significantly differed under carbon limitation from the carbon replete conditions (Tukey’s HSD post-hoc test following one-way ANOVA: p<0.001).
3.4. Cyclic electron flow around PSI
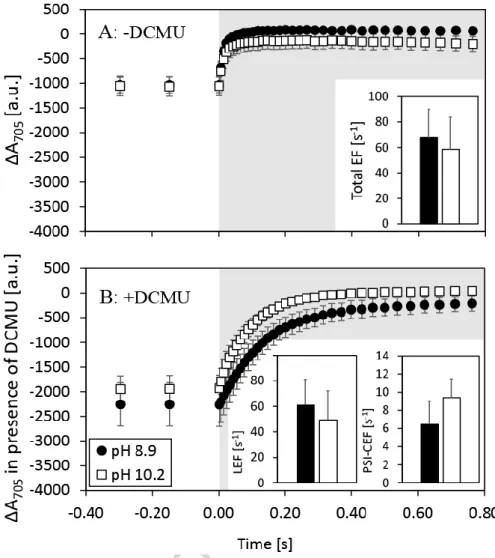
To investigate possible differences in PSI-CEF kinetics at the onset of photosynthesis induction, absorption changes at 705 nm (ΔA705 signal) were measured in N. oculata cultures after 10 s of illumination (Figure 7).
Total electron flow through PSI, which includes both LEF and PSI-CEF (the rate of ΔA705
increase in the dark), decreased slightly but not significantly at pH 10.2 (ANOVA: p=0.57, Figure 7A). When LEF was blocked by 80 μM DCMU (Figure 7B), the ΔA705 amplitude became more negative under AL at both pH levels. This reflects higher P700oxidation due to the lack of (P700+ reducing) electron flow from the site of PSII (LEF). At pH 8.9 the P700+ re- reduction rate in the presence of DCMU was slightly, but not significantly, faster than at pH 10.2 (ANOVA: p=0.11), which suggests no change in PSI-CEF activity. Similarly, no significant change was observed in LEF at pH 10.2 (49 ± 23 s-1 when compared to 61 ± 20 s-1 at pH 8.9, ANOVA: p=0.64, Figure 7B). P700+ re-reduction rates were slightly higher when PSI-CEF was assessed using 2050 μmolphotons m-2 s-1 (in the presence of DCMU) in both pH 8.9 and 10.2 samples, but the finding was essentially the same that PSI-CEF elevated slightly but non-significantly under Ci limitation when higher irradiance was applied for the measurements (Figure S6, S7).
ACCEPTED MANUSCRIPT
19
Figure 7. P700 redox kinetics of carbon replete (pH 8.9 – black dots/bars) and carbon deplete (pH 10.2 – white dots/bars) cultures of N. oculata. P700 signal was measured at 705 nm in the absence (A) and presence (B) of DCMU following 10 s illumination (630 nm) at a photon flux density of 120 μmolphotons m-2 s-1. Total electron flow (insert in panel A), PSI-CEF and LEF (inserts in panel B) were calculated from the dynamics of P700+ re-reduction kinetics after switching off AL, as measured by the absorption change at 705 nm. The total EF was measured in N. oculata culture without any treatment; the PSI-CEF and resulting LEF were measured after blocking LEF using 80 µM DCMU. All values represent averages from at least four replicates, error bars represent standard deviations. The changes in total EF, LEF and PSI-CEF were not statistically significant (Tukey’s HSD post-hoc test following one-way ANOVA:
p>0.05). White parts of panels A and B represent the AL period, grey parts represent dark periods. The lower signal in the light reflects the intensity of P700oxidation, which increased after LEF was blocked by DCMU (the electron transport from PSII that could partially reduce oxidized P700+ was blocked). Signal recovery in the dark reflects the rate of P700+ re-reduction.
3.5. Fatty acids
In addition to the photosynthetic parameters, the potential changes in the concentration of fatty acids (measured as fatty acid methyl esters, FAMEs) under carbon limitation were investigated.
ACCEPTED MANUSCRIPT
20
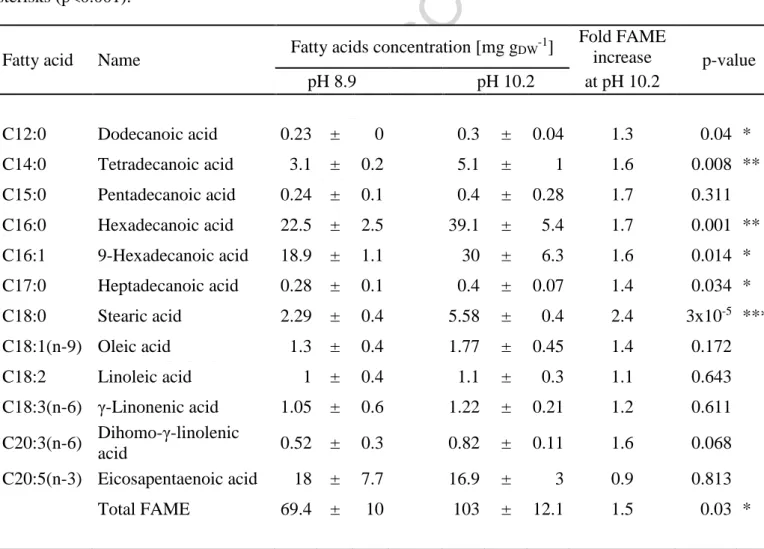
The total FAME increased significantly under carbon limitation in N. oculata (from 6.9 ± 1.0%
(w/w) at pH 8.9 to 10.3 ± 1.2% at pH 10.2, respectively, ANOVA: p=0.011). The highest increase (more than 73%) was recorded for unsaturated hexadecanoic acid (C16:0), which is important component of biodiesel [41]. However, the FAME concentrations was considerably lower than previous reports for N. oculata (9- 60% w/w, see e.g. [41]). The FAME results are summarized in Table 1.
Table 1. Composition of fatty acids (measured as fatty acids methyl esters, FAME) in N.
oculata cells sampled at pH 8.9 and pH 10.2. The values represent averages of four technical replicates, error bars represent standard deviations. The p-values were calculated by Tukey’s HSD post-hoc test following one-way ANOVA; fatty acids with significant variance between pH 8.9 and pH 10.2 are marked by single asterisks (p<0.05), double asterisks (p<0.01) or triple sterisks (p<0.001).
Fatty acid Name Fatty acids concentration [mg gDW-1] Fold FAME
increase p-value
pH 8.9 pH 10.2 at pH 10.2
C12:0 Dodecanoic acid 0.23 ± 0 0.3 ± 0.04 1.3 0.04 *
C14:0 Tetradecanoic acid 3.1 ± 0.2 5.1 ± 1 1.6 0.008 **
C15:0 Pentadecanoic acid 0.24 ± 0.1 0.4 ± 0.28 1.7 0.311 C16:0 Hexadecanoic acid 22.5 ± 2.5 39.1 ± 5.4 1.7 0.001 **
C16:1 9-Hexadecanoic acid 18.9 ± 1.1 30 ± 6.3 1.6 0.014 * C17:0 Heptadecanoic acid 0.28 ± 0.1 0.4 ± 0.07 1.4 0.034 * C18:0 Stearic acid 2.29 ± 0.4 5.58 ± 0.4 2.4 3x10⁻⁵ ***
C18:1(n-9) Oleic acid 1.3 ± 0.4 1.77 ± 0.45 1.4 0.172
C18:2 Linoleic acid 1 ± 0.4 1.1 ± 0.3 1.1 0.643
C18:3(n-6) γ-Linonenic acid 1.05 ± 0.6 1.22 ± 0.21 1.2 0.611 C20:3(n-6) Dihomo-γ-linolenic
acid 0.52 ± 0.3 0.82 ± 0.11 1.6 0.068
C20:5(n-3) Eicosapentaenoic acid 18 ± 7.7 16.9 ± 3 0.9 0.813
Total FAME 69.4 ± 10 103 ± 12.1 1.5 0.03 *
4. Discussion
ACCEPTED MANUSCRIPT
21
The objective of this study was to characterise changes in capacity and efficiency of the photosynthetic electron transport chain in Nannochloropsis oculata under standard growth conditions (carbon-replete) and under carbon limitation. Using chlorophyll fluorescence and a variety of rapid absorbance measurements, it was possible to follow the major parameters that affect the uptake and fixation of inorganic carbon species under replete (non-limited) conditions and under Ci limitation.
N. oculata cells predominantly use Ci in the form of bicarbonate (HCO3-). Inside the cells, HCO3- is partially converted to CO2 of which a proportion leaks back to the environment [9,42].
Nannochloropsis has a carbon concentrating mechanism (CCM), by which the concentration of CO2 at the site of carboxylation by RuBisCO is enhanced above passive equilibrium levels [8]. Overall, the HCO3- uptake and subsequent CO2 fixation at the site of carboxylation are coupled with OH- release which, under prolonged light exposure, leads to a pH increase in the medium and carbon limitation [21]. When Ci is limiting, the carboxylation reaction slows down and the intermediate metabolites (NADPH and ATP) produced during photophosphorylation (the ‘light reaction’) build up, which causes a bottleneck in electron flow. In this aspect, even if CCMs operated efficiently in N. oculata, the CO2/O2 ratio at the active site of RuBisCO may not be high enough to prevent a small flux of organic carbon through RuBisCO oxygenase, which would have energetic consequences for the fraction of ribulose 1,5-bisphosphate synthesis used in P-glycolate formation. Another factor that may contribute to the unbalanced CO2/O2 ratio (despite operational CCMs) is CO2 leakage from the RuBisCO site [8].
Irrespectively of the exact causes of a CO2/O2 ratio that does not completely suppress RuBisCO oxygenase activity, the LEF, i.e. the vectorial electron transport from PSII and PSI reaction centres towards the carboxylation reactions, slows down and Y(II) (PSII operating efficiency) declines [15,43]. Consequently, the ETR decreases and NPQ rises as the light energy captured by PSII cannot be used for electron transport, and dissipative energy processes such as qE are activated (as shown in Figures 3, 4).
Using the photobioreactor, it was possible to follow the effect of the onset of carbon limitation on PSII operating efficiency in situ. After approx. 5 hours of illumination, the culture pH increased to its maximum of ~10.2. At this high pH, the concentrations of both bicarbonate and biologically available orthophosphate (HPO43-) decrease. However, the orthophosphate decrease is not as critical as the bicarbonate decrease because: (i) microalgal biosynthesis requires far less phosphorus than carbon (~100:1 C: P ratio) and (ii) microalgal cells exhibit
‘luxury’ phosphate uptake, whereby they store excess phosphate in a large intracellular polyphosphate pool for later use [44]. Thereby, the photosynthesis limitation at high pH was attributed to bicarbonate limitation.
At pH ~10.2, Y(II) (Figure 1D) and dissolved oxygen level (which represents a dynamic equilibrium between mass transfer, photosynthesis and respiration) started to decrease from their maximum levels (Figure 1C, see also [21]. Chlorophyll fluorescence measured in the photobioreactor could not be used for detailed analysis of photosynthetic electron transport, since the light conditions within the photobioreactor vessel did not fully saturate PSII reaction centres in all N. oculata cells (data not shown). Thus, the photosynthetic electron transport in the carbon-limited culture of N. oculata was characterized by chlorophyll fluorescence
ACCEPTED MANUSCRIPT
22
measurements in a separate, cuvette-based chlorophyll fluorometer (MC-PAM), which was used to measure high-resolution chlorophyll fluorescence parameters, such as dark-light induction curves and O-P-S-M-T kinetics, without disturbing the light conditions in the photobioreactor. In addition, the effect of carbon limitation on photosynthesis was further explored by measurement of the carotenoid optical absorbance change (carotenoid band shift) and by evaluation of the redox kinetics of P700 (PSI).
Two time points were selected for comparative analysis: 1:50 h into the light cycle (steady- state photosynthesis with maximum Y(II) at pH 8.9) and 10:50 h into the light cycle (Ci limitation for several hours and photosynthetic efficiency significantly reduced at pH 10.2).
Assessment of photosynthesis vs. irradiance revealed that thylakoid membrane electron transport became limited, whereas energy dissipation by non-photochemical pathway (NPQ) was enhanced under carbon limitation, particularly at higher irradiances (Figure 3C). When sufficient inorganic carbon was available, algae incubated at an actinic light (AL) that closely match their growth irradiance performed photosynthesis at a steady rate that was not influenced by additional energy dissipation processes. This was corroborated by the observation that chlorophyll fluorescence was entirely quenched by photochemical processes; i.e. during the induction-recovery curve measurements, when AL was on, the amplitude of FM and FM` did not change (Figure 4A). However, under carbon limitation, the drop of FM` in the presence of AL (Figure 4B) indicated the activation of non-photochemical processes, as a result of impaired electron flow. It was interesting to observe that in carbon limited samples, the strong decrease in Y(II) was only transient, as it partially recovered during the first few minutes under AL. This could be attributed to slow re-activation of the Calvin-Benson Cycle [15]. Activation of alternative electron valves such as chlororespiration, Mehler reaction and mitochondrial respiration can also contribute to the recovery of Y(II) [7], however, activity of these reactions was not estimated within this work.
In carbon-limited samples, at a light intensity matching the growth irradiance, significant NPQ was activated; however the NPQ formation was only transient and it disappeared when PSII operation efficiency recovered under AL (Figure 4D). Recent progress on understanding the photochemical and photoprotective mechanisms of Nannochloropsis sp. has shown that this species exhibits several components of NPQ with multiple kinetics, from sub-second to minute timescales [25], which is in agreement with the existence of fast and efficient NPQ in Nannochloropsis sp. when carbon limitation sets in.
More in-depth analysis of slow fluorescence induction kinetics (O-P-S-M-T kinetics) revealed altered behaviour of carbon-limited N. oculata cells. The fluorescence induction curve at pH 8.9 (Ci replete conditions) represents a standard type of O-P-S-M-T kinetics. However, under carbon limitation the fluorescence induction at the onset of illumination was significantly different. The P-S decline was more pronounced under carbon limitation. The P-S decline is a complex phenomenon that can be influenced by several factors. At the onset of AL (after 10- 15 s of AL), lower Y(II) and higher NPQ (Figure 4D), and higher proton motive force (Figure 6A, 6B) in the carbon limited samples could all contribute to the accelerated decline of the fluorescence signal (Figure 5) [37,45,46].
ACCEPTED MANUSCRIPT
23
The fluorescence intensity during the S-M phase rose in the Ci replete culture (pH 8.9) while it declined under Ci limitation at pH 10.2 (Figure 5). After ca. 30 s of illumination that corresponded to the S-M phase, significant NPQ induction under Ci limitation was observed (Figure 4D); this could be connected with ongoing ΔpH formation at this time [47]. The fluorescence decline in Ci limited samples suggests that the pool of NADP+ reductant on the electrons acceptor site was not fully depleted during the S-M phase [45].
Also the M-T transition differed between the carbon-replete cultures and under carbon limitation. The M-T decay under carbon-replete conditions (Figure 5) reflected the standard activation of carbon assimilation processes [37,45,46]. However, the fluorescence drop in the carbon limited cultures between 20-50 s indicates increased electron flow towards the electron acceptors (not a fully depleted pool of electron acceptors), which can be related to the decreased LEF rate as implied by lower Y(II) and higher NPQ at pH 10.2 (Figure 4C, 4D). The fluorescence started to increase only after ca. 50 s of illumination, which suggests delayed depletion of the electrons acceptor pool.
The lower fluorescence level in phase T at pH 10.2 (Figure 5) indicates that the equilibrium between production of energy-rich compounds (such as NADPH and ATP) in photochemical reactions and their consumption during carbon assimilation was lower under Ci limitation, i.e.
fewer electrons were released to support carbon fixation under Ci limiting conditions. In other words, the acceptor side of PSI was likely to be limited by decreased CO2 fixation activity at pH 10.2 during steady-state photosynthesis. This corresponded with decreased Y(II) under Ci limitation (Figures 1D, 4C).
Lower Y(II) and elevated NPQ in Ci limited N. oculata cells at the onset of illumination were accompanied by slower proton conductivity of the thylakoid membranes (gH+) and a higher proton motive force, as indicated by larger electrochromic signal amplitude (ECSt, Figure 6B).
Lower gH+ after 10 s of illumination is consistent with the observation of faster P-S decay under Ci limitation. This can be explained as follows: the total PMF was transiently built-up (potentially due to lower proton conductivity of ATP synthase) that lead to the accumulation of pH gradient across the thylakoid membrane, which activated energy-dependent quenching qE, which also affected the P-S decay (Figure 5). The gH+ was lower after 180 s of illumination (Figure 6D), which corresponds with lower levels of chlorophyll fluorescence as observed in the T phase under Ci limitation (Figure 5). This suggests decreased efficiency of carbon assimilation processes as a result of lower production of redox equivalents and ATP. Higher ECSt indicates higher PMF across the thylakoid membrane (ΔpH formation). It has been demonstrated that an almost linear relationship exists between NPQ (in particular qE) and ECS in plants [47] and in some species of green algae, including Chlamydomonas reinhardtii, Chlorella saccharophila and Chlorella vulgaris [48]. From this perspective, higher ECSt at the onset of illumination is consistent with a rise in NPQ, as indicated in Figure 4D. Taken together, these results indicate that under Ci limitation when transient NPQ builds up, the proton motive force that drives ATP formation was stronger, even though PSII operating efficiency was reduced. Therefore the pH gradient was likely to contribute significantly to larger pH-dependent or energy-dependent quenching [18,47]. Under longer illumination, these differences in proton motive force and proton conductivity between Ci replete and deplete
ACCEPTED MANUSCRIPT
24
samples diminished (Figure 6D), which is in agreement with reduced NPQ and partially recuperated PSII operation efficiency (Figure 4C, 4D). The nature of the reduced proton conductivity of the thylakoid membranes (gH+) after prolonged illumination (180 s) under carbon replete conditions remains to be investigated, especially in the context of recovered Y(II) and diminished NPQ. Since additional mechanism with potential impact on ATP synthase activity could be activated, and even H/ATP ratio was shown to act as an energy barrier of ATP synthesis, [49], further investigation is necessary to fully understand this phenomena.
When LEF was impaired, the elevated PMF can be partially explained by alternative electron transport processes that do not contribute to net photosynthesis, but can maintain a proton gradient [4,32]. Possible changes in PSI-CEF under Ci limitation were investigated by chemically blocking electron flow from PSII using DCMU. When LEF in N. oculata was blocked, the re-reduction rate of P700+ was not significantly faster under Ci limitation, which indicates no change in PSI-CEF intensity at the onset of illumination under Ci limiting conditions (Figure 7). Our results are in agreement with earlier results on Nannochloropsis gaditana [23]; in the presence of DCMU, when LEF was blocked, the re-reduction of P700+ was 6-10 times lower and the remaining electron flow probably originated from alternative pathways. Based on our data, PSI-CEF does not significantly contribute to PMF under carbon limitation; the elevated PMF is rather the consequence of lower conductivity of ATP synthase to protons [47].
Ci limitation altered the composition of fatty acids (measured as fatty acids methyl esters, FAME) in N. oculata cells (Table 1). Total FAME increased by ~40% under CO2 limitation Fatty acid synthesis may operate as an effective NADPH consuming mechanism when NADPH cannot be used for CO2 fixation [6]. To make the saturated glyceryl tripalmitate (C51H98O6) from CO2 and H2O through photosynthesis involves the use of 25 triose P made using 150 NADPH and 300 ATP (including 75 ATP for the CO2 concentrating mechanism). Conversion of the 25 triose P to glyceryl tripalmitate produces 5 NADPH and 27 ATP. Overall, 75 CO2 are assimilated in photosynthesis and 24 CO2 are produced, with net use of 145 NADPH and 273 ATP (for further details, see Appendix B). The fatty acid synthesis therefore can work as an alternative pathway for the electrons and protons (as ATP) consumption. However, since carbon was the primary limiting resource in our experiments, incorporation of newly fixed CO2
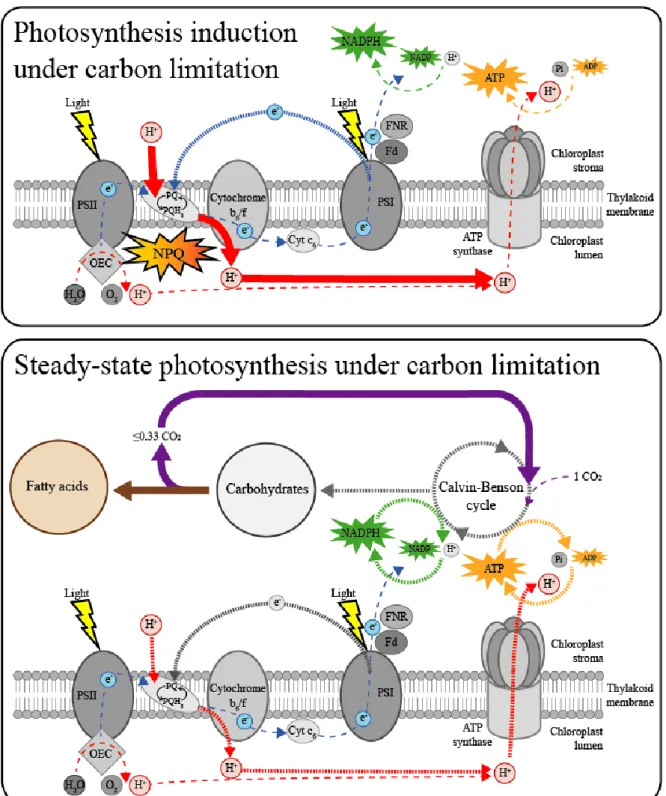
into lipids does not represent an optimal resource management strategy. It is more likely that the newly synthesized lipids originated from internal carbon reserves such as carbohydrates (made in the morning when Ci was not limiting [50]) that were used under Ci limitation more extensively. However, further experimental evidence is necessary to understand whether the acetyl-CoA supply (originating from decomposition of sugars) is sufficient to serve as an electron acceptor for NADPH when the Calvin-Benson Cycle is limited in Nannochloropsis sp. The overall impact of Ci limitation on N. oculata photosynthesis is summarised as a conceptual diagram in Figure 8.
ACCEPTED MANUSCRIPT
25
Figure 8 Proposed model of changes in the photosynthetic electron transport processes under carbon limitation in Nannochloropsis oculata. Quantum yield of PSII decreases when carbon becomes limited. At the onset of illumination (upper panel), non-photochemical quenching (NPQ) is induced as a consequence of higher proton gradient built up by increased PMF (full red arrows). This is because the slow ATP synthase activity is the rate limiting step in determining proton flux kinetics (i.e. slow proton efflux), rather than the proton influx via linear electron flow (dashed red and blue arrows, respectively). Under steady-state photosynthesis (lower panel), fatty acid production increases (brown arrow). CO2 that is produced during fatty