PATTERNS OF CRANIOMETRIC VARIABILITY OF SIX COMMON SPECIES OF SHREWS (SORICIDAE: CROCIDURA, NEOMYS, SOREX)
Sirma Asenova Zidarova* and Vasil Vulkov Popov
Institute of Biodiversity and Ecosystem Research, Bulgarian Academy of Sciences 1, Tsar Osvoboditel Blvd., 1000 Sofia, Bulgaria; *E-mail: s.zidarova@gmail.com
The morphometric variability of the skull and the lower jaw of 6 species of shrews (Croci- dura suaveolens s. l., C. leucodon, Neomys anomalus, N. fodiens, Sorex minutus, and S. araneus) from Bulgaria, Romania, Hungary, and Austria was analyzed. The results from the PCA and the unsupervised model-based clustering showed that morphological geographic in- traspecific variation was clearly expressed in Crocidura suaveolens and C. leucodon, poorly pronounced in Neomys anomalus and N. fodiens, and almost missing in Sorex minutus and S. araneus. Our data provide a morphological confirmation of the recent molecular data, which indicate a division of both Crocidura species to western and eastern lineages. The geographical location of their boundaries was discussed.
Keywords: morphometrics, geographic variation, Crocidura, Neomys, Sorex
INTRODUCTION
The distinction of species and subspecies is of interest to an array of bio- logical sciences such as conservation biology (registration and management of endangered forms – species and subspecies, identification of priority con- servation areas) and evolutionary biology (for describing, quantifying and understanding of the mechanisms of species formation) (Amori et al. 2009).
However, the division of the evolutionary units (Wiens 2007), such as sub- species and species, on the basis of the traditional morphological characters, is still far from trivial. According to the formal criteria for subspecies clas- sification proposed by O’Brien and Mayr (1991) “members of a subspecies share … a group of phylogenetically concordant phenotypic characters …”. In practice, however, it is often difficult to distinguish such features from those that represent the influence of environmental factors within the morphologi- cal plasticity of the species. The problem is further complicated by the lack of modern taxonomic revisions. Thus, many names introduced more than 100 years ago, often on the basis of a small number of specimens and characters of uncertain taxonomic significance, remain potentially valid and “available”
(Amori et al. 2009). For example, in Europe and neighboring areas, a number of subspecies of soricids with weak or inconsistent morphological distinctive- ness and thus with uncertain taxonomic status have been described (Niet- hammer 1977, Corbet 1978, Wolsan & Hutterer 1998, de Jong et al. 2014).
Relatively recently the study of mitochondrial and nuclear genomes has led to the discovery of cryptic lineages and a strong phylogeographic structure across species ranges (Filippucci & Simson 1996, Ohdachi et al. 2004, Dubey et al. 2006, 2007a, Bannikova et al. 2015). Molecular data of Crocidura suaveo- lens and Crocidura leucodon from Europe and Near East show the presence of clearly differentiated clades in both species: a Western European and an east- ern clade. According to the inter-SINE PCR and cytochrome b study of Ban- nikova et al. (2006), the former subspecies C. suaveolens mimula Miller, 1901 and C. s. suaveolens Pallas, 1811 could be treated as separate species: C. mimula being restricted to Western Europe and C. suaveolens – to Eastern Europe and parts of Asia. Similarly, by using cyt b, Vogel et al. (2003) and Ohdachi et al.
(2004) found a division between Western European and Asian C. suaveolens.
According to cyt b analyses of Castiglia et al. (2017), their C. suaveolens hap- lotype samples from the Apennine Peninsula belong to a clade distributed also in the western half of the Balkan Peninsula and Central Europe. On the basis of mitochondrial and nuclear gene sequences in C. leucodon two clades have been recognized (Dubey et al. 2007b): a European clade (distributed from France eastwards to Turkey) and a Near East one (distributed from Georgia to Romania). The specimens from East Bulgaria (Bourgas) belong to the eastern clade. Two species of water shrews, Neomys anomalus Cabrera, 1907 and N.
milleri Mottaz, 1907, were described on the basis of the overall shape of the skull. Later they were considered as subspecies of N. anomalus without any clear argumentation (e.g. Ellerman & Morrison-Scott 1966). Nowadays, the genetic analyses reveal that they are independently evolving lineages and confirm their species status (Castiglia et al. 2007). Recent DNA analyses re- veal that Central European and Western Balkan populations of Sorex minutus Linnaeus, 1766, belong to different phylogroups with poorly expressed mor- phological differences (Bernal 2010).
These studies, though important to reveal the subtle mechanisms of evo- lution, cannot be considered as a substitute for taxonomic revisions (Wheeler 2004). Only a classic taxonomic revision based on morphological descriptions and analyzes can provide physical diagnostic features and outline the geo- graphical distribution of taxa (Amori et al. 2009). Until now, there are insuf- ficient data on the relationship between morphological differences that have been commonly used to distinguish subspecies or species in the past, and the new data based on molecular genetics. Much of the discussion in this respect deals with the opposition of classical morphological features versus the mo- lecular ones. An advantage of the first type of characters is that they allow the species to be identified visually and is applicable to both live and museum specimens as well as to fossils. Among the disadvantages can be noted the subjectivity of defining and interpreting the state of the feature, the need of large samples, the continuous but not discrete character of many characters,
and the fact that phylogenetic divergence often occurs without morphological change that determines the existence of morphologically cryptic species. On the other hand the non-critical use of isolated molecular characters (e.g., a sin- gle mtDNA locus) can lead to an inflation of species diversity. Reasons could be such as genetic bias in small populations isolated only for a short period of time which may lead to reciprocal monophyletism with respect to a particular character and therefore can be diagnosed. Such situations, however, do not represent the type of diversity of interest for most ecologists and evolution- ary biologists, and the question whether they should be recognized as species remains (Padial et al. 2010). This has led to the importance of evaluating and combining available evidence from a variety of disciplines to support nec- essary taxonomic revisions, which recently has been termed integrative tax- onomy (Padial et al. 2010, Yeates et al. 2011). In this context and considering the above mentioned systematic obscurity with regard to some of the most common soricid species in Europe, we aimed to explore the patterns of mor- phometric variability of pairs of closely related species of three genera – Cro- cidura, Neomys, and Sorex, within the context of relevant published molecular data. An explicit goal of this study was to test whether the relatively low-cost method of morphometrics reveals patterns consistent with the available lit- erature data obtained by molecular methods.
MATERIAL AND METHODS
Data were taken from skulls of six species of shrews from two geographic regions – Southeastern Europe, hereinafter referred to as SEE (material from Bulgaria) and Cen- tral Europe, hereafter referred to as CE (material from Romania, Hungary, and Austria) (Fig. 1). Only sub-adult specimens with unworn teeth were used in this study in order to preclude distortion of the results because of differences in the age structure within the samples. Additionally, in this way the Dehnel’s (1949) effect was also eliminated in the samples of red-toothed shrews. In total 830 skulls were studied: Crocidura suaveolens s.l.
(CE – 50, SEE – 46), C. leucodon (CE – 40, SEE – 35), Neomys anomalus (CE – 111, SEE – 233), N. fodiens (CE – 49, SEE – 130), Sorex minutus (CE – 13, SEE – 33), and S. araneus (CE – 32, SEE – 57). Only part of this material was sex-determined. The numbers of males and fe- males were as follows: C. suaveolens s.l. (CE – 17 / 24, SEE – 9 / 7), C. leucodon (CE – 16 / 18, SEE – 4 / 5), N anomalus (CE – 36 / 45, SEE – 46 / 44), N. fodiens (CE – 6 / 26, SEE – 37 / 32), S.
minutus (CE – 5 / 8, SEE – 13 / 20), and S. araneus (CE: 16 / 16, SEE – 24 / 33). To determine if these ratios differ from the theoretical ratio of 0.5, the chi-square statistics were calculated.
The obtained values ranged from 0 to 2.38 and were smaller than the critical value for 0.05 probability level (3.841), so the sex proportions in individual regional species samples were not significantly different from 0.5. The same can be assumed for the specimens, for which the sex was not determined. These data indicate that as a whole the regional species samples were not sex biased.
The examined material originated from the collections of the Institute of Biodiversity and Ecosystem Research (Bulgarian Academy of Sciences) in Sofia, Natural History Muse- ums in Vienna and Budapest.
Crocidura leucodon C. suaveolens
Neomys anomalus N. fodiens
Sorex araneus S. minutus W clades
E clades
Fig. 1. Geographical origin of the materials examined. Dashed lines denote putative bor- ders between eastern and western clades in the species of genus Crocidura, established on the basis of the molecular genetic data (Bannikova et al. 2006, Dubey et al. 2007b, Castiglia
et al. 2017)
Lp4 Lp3
W Li1
A1_A3-5
BLM1(M2) LM3
LTI1 LI1
HI1 I1_M3
P4_M3 M1_M3
i1_m3 p3_m3
m1_m3 BLP4
LA1
Wp3
SCWIO
OW
HMD_m2
HPC
SCH
PGW
PL BL
CBL
HC
RL
WP4_P4 WM3_M3 PRH LMD Fig. 2. Cranial, mandibular and dental measurements. SCW = skull case width, OW = orbital width, IO = infraorbital width, PGW = postglenoid width, WP4_P4 = width between P4’s, WM3_M3 = width between M3’s, CBL = condylobasal length, BL = basal length, PL= palatal length, RL = rostral length, SCH = skull case height, PRH = post-rostral height, I1_M3 = length of I1–M3, P4_M3 = length of P4–M3, M1_M3 = length of M1–M3, A1_A3–5 = length of antemolars, LI1 = length of upper incisive, LTI1 = upper incisive talon length, HI1 = height of upper incisive, LA1 = length of the first antemolar, WA1 = width of the first antemolar, BLP4 = buccal length of P4, BLM1 = buccal length of M1, BLM2 = buccal length of M2, LM3 = length of M3, LMD = length of mandible, HPC = height of coronoid process, HMD_m2 = distance from the lower fringe of the m2 alveolus to the ventral edge of the mandibula (lingual view), HC = height of condyle, i1_m3 = length of i1–m3, p3_m3 = length of p3–m3, m1_m3 = length of m1–m3, Li1 = length of lower incisive, Lp3 = length of p3, Lp4 = length of p4, Wp3 = width of p3
For describing the skull morphology as comprehensive as possible 36 morphological measurements from the skull, lower jaw and teeth were obtained (Fig. 2). They were taken with a digital caliper to the nearest 0.01 mm or ocular micrometer to the nearest 0.001 mm by one of us (SZ).
Our analysis was based on an integrated biometrical and methodological approach using principal component analysis (PCA) and model-based clustering. Principal compo- nent analyses were conducted within each genus in order to condense the information into several uncorrelated composite variables – Principal Components (PCs) – that represent most of the variation. PCs with eigenvalues more than 1 were retained for further analy- ses. To improve interpretation of the principal components they were rotated to a simple structure using varimax normalized procedure. Prior to statistical analyses, we tested for normal distribution and homogeneity of variance using Shapiro-Wilk’s and Levene’s tests, respectively. The tests have shown that all variables do not deviate from the normal distri- bution and have comparable variances.
Typically, PC1 is considered to be an allometric axis, which is generally considered to represent the overall size; the remaining axes being perpendicular to PC1, i.e., are not cor- related with it, reflect variability not related to size. On this basis, PC1 is often interpreted as „size“, while the next major components are viewed as reflecting the „shape“. It should be borne in mind, however, that since the first major component also includes a shape change component due to allometry, the variance of the other major components is not the full variation of the shape (Klingenberg 2016). For this reason, further in the text, the size and shape are placed in quotation marks.
In order to classify the specimens from every species into morphological groups, we used unsupervised model-based clustering. For this purpose, a Gaussian finite mixture model fitted by Expectation–Maximisation (EM) algorithm was employed. The optimal number of clusters for classification was determined by likelihood. Having in mind that the likelihood increases with the number of clusters, the final decision should be taken by examining a measure penalized by the number of parameters sought. So, the choice of the number of clusters was made using the Bayesian Information Criterion (BIC). The software packages used for the analyses were STATISTICA 7.0 for Windows (StatSoft 2004) and R package mclust (Fraley & Raftery 2012).
RESULTS Genus Crocidura
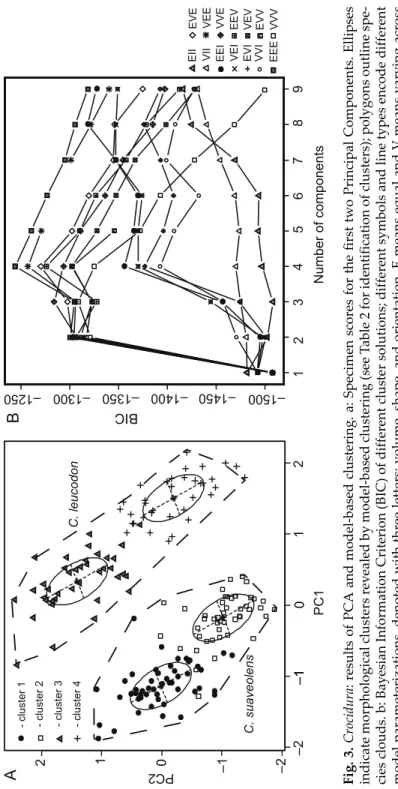
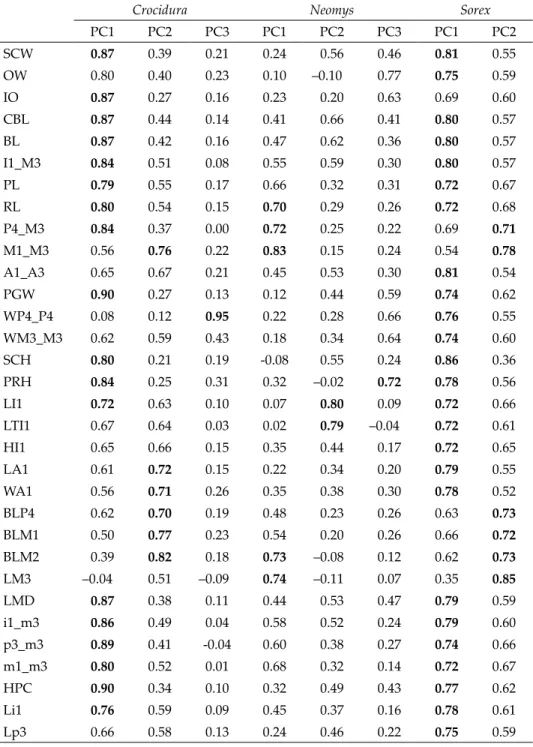
Three principal components (PC1-3) had eigenvalues larger than 1 and accounted for approximately 30% of the variability of the initial 36 measure- ments. The first principal component reflected species differences as well as geographical differences within species (Fig. 3a), comprising 18.7% of the variability within the dataset. Almost all variables showed high loadings on the PC1, representing skull and mandibular lengths and skull widths, as well as some dental measurements. The measurements with the highest loadings were the postglenoid width (PGW) and the height of coronoid process (HPC) (Table 1). The second principal component accounted for 10.7% of the vari- ability and reflected some peculiarities of the dentition. Morphometric charac-
Fig. 3. Crocidura: results of PCA and model-based clustering. a: Specimen scores for the first two Principal Components. Ellipses indicate morphological clusters revealed by model-based clustering (see Table 2 for identification of clusters); polygons outline spe- cies clouds. b: Bayesian Information Criterion (BIC) of different cluster solutions; different symbols and line types encode different model parameterizations, denoted with three letters: volume, shape, and orientation. E means equal and V means varying across components or clusters; I refers to the identity matrix in specifying shape or orientation and is a special case of E; the ‘best’ model with the highest BIC is EEE (ellipsoidal, equal volume, shape and orientation) model with 4 components
A B
C.leucodon C. suaveolens Number of componentsPC2
PC1
–2–112123456789
EIIEVE VIIVEE EEIVVE VEIEEV EVIVEV VVIEVV EEEVVV
BIC
–1500 –1450 –1350
–1300 –1250
- cluster 1 - cluster 2 - cluster 3 - cluster 4 0–1
–1 –2
12 0
–1400
Table 1. Principal Component (PC) Loadings for Varimax normalized solution in Croci- dura, Neomys, and Sorex datasets. Boldface numerals: factorloadings > 0.70
Crocidura Neomys Sorex
PC1 PC2 PC3 PC1 PC2 PC3 PC1 PC2
SCW 0.87 0.39 0.21 0.24 0.56 0.46 0.81 0.55
OW 0.80 0.40 0.23 0.10 –0.10.0 0.77 0.75 0.59
IO 0.87 0.27 0.16 0.23 0.20 0.63 0.69 0.60
CBL 0.87 0.44 0.14 0.41 0.66 0.41 0.80 0.57
BL 0.87 0.42 0.16 0.47 0.62 0.36 0.80 0.57
I1_M3 0.84 0.51 0.08 0.55 0.59 0.30 0.80 0.57
PL 0.79 0.55 0.17 0.66 0.32 0.31 0.72 0.67
RL 0.80 0.54 0.15 0.70 0.29 0.26 0.72 0.68
P4_M3 0.84 0.37 0.00 0.72 0.25 0.22 0.69 0.71
M1_M3 0.56 0.76 0.22 0.83 0.15 0.24 0.54 0.78
A1_A3 0.65 0.67 0.21 0.45 0.53 0.30 0.81 0.54
PGW 0.90 0.27 0.13 0.12 0.44 0.59 0.74 0.62
WP4_P4 0.08 0.12 0.95 0.22 0.28 0.66 0.76 0.55
WM3_M3 0.62 0.59 0.43 0.18 0.34 0.64 0.74 0.60
SCH 0.80 0.21 0.19 -0.08 0.55 0.24 0.86 0.36
PRH 0.84 0.25 0.31 0.32 –0.020 0.72 0.78 0.56
LI1 0.72 0.63 0.10 0.07 0.80 0.09 0.72 0.66
LTI1 0.67 0.64 0.03 0.02 0.79 –0.04.0 0.72 0.61
HI1 0.65 0.66 0.15 0.35 0.44 0.17 0.72 0.65
LA1 0.61 0.72 0.15 0.22 0.34 0.20 0.79 0.55
WA1 0.56 0.71 0.26 0.35 0.38 0.30 0.78 0.52
BLP4 0.62 0.70 0.19 0.48 0.23 0.26 0.63 0.73
BLM1 0.50 0.77 0.23 0.54 0.20 0.26 0.66 0.72
BLM2 0.39 0.82 0.18 0.73 –0.080 0.12 0.62 0.73
LM3 –0.04 0 0.51 –0.09 . 0.74 –0.110 0.07 0.35 0.85
LMD 0.87 0.38 0.11 0.44 0.53 0.47 0.79 0.59
i1_m3 0.86 0.49 0.04 0.58 0.52 0.24 0.79 0.60
p3_m3 0.89 0.41 -0.04 0.60 0.38 0.27 0.74 0.66
m1_m3 0.80 0.52 0.01 0.68 0.32 0.14 0.72 0.67
HPC 0.90 0.34 0.10 0.32 0.49 0.43 0.77 0.62
Li1 0.76 0.59 0.09 0.45 0.37 0.16 0.78 0.61
Lp3 0.66 0.58 0.13 0.24 0.46 0.22 0.75 0.59
ters that consistently accounted for the most variation in this component were M1–M3, the measurements of particular teeth and especially BLM2 (Table 1).
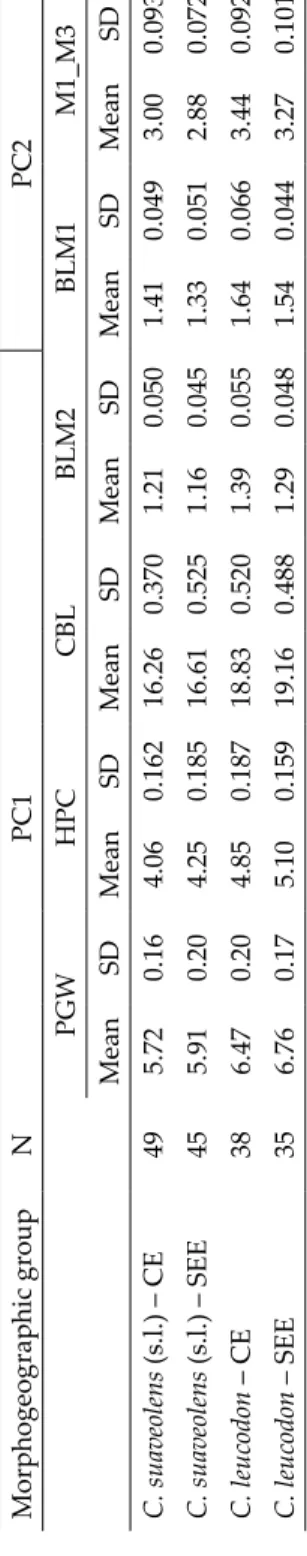
The distribution of specimen scores along this axis indicated that it represents the geographical variability within each species (Fig. 3a). PC3 represented only WP4–P4 (Table 1). It explained a very small percentage of the variability and did not show a particular trend that can be interpreted from a biological point of view. Within the morphospace defined by the retained PCs, four clearly differentiated morphogeographic groups were identified by model-based clustering (Figs 3a,b): cluster 1 consisted mainly of specimens of C. suaveolens from CE, cluster 2 was composed mainly of specimens of C. suaveolens from SEE, cluster 3 contained only specimens of C. leucodon from CE, and cluster 4 included mainly specimens of C. leucodon from SEE (Table 2). The univariate statistics of the characters with the highest loadings on the first two principal components showed that in both species the Bulgarian (SEE) forms have larger skull dimensions and smaller teeth (Table 3).
Table 2. Species identity and geographical origin of specimens in the clusters identified by model-based clustering. MC = mclust cluster, N = number of specimens, CE = Central
Europe, SEE = Southeastern Europe (Bulgaria).
MC
Crocidura Neomys Sorex
N C. suaveo-
lens C. leuco-
don N N. fodiens N. ano-
malus N S. ara-
neus S. minu- tus
CE SEE CE SEE CE SEE CE SEE CE SEE CE SEE
1 51 49 2 – – 40 38 1 – 1 89 32 57 – –
2 47 2 45 – – 224 – 3 5 216 46 – – 13 33
3 38 – – 38 – 140 9 123 1 7 – – – – –
4 36 – – 1 35 119 2 2 105 10 – – – – –
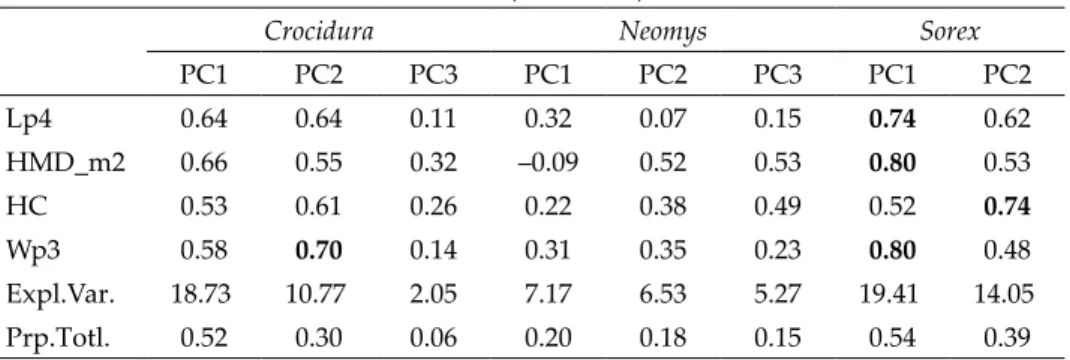
Table 1 (continued)
Crocidura Neomys Sorex
PC1 PC2 PC3 PC1 PC2 PC3 PC1 PC2
Lp4 0.64 0.64 0.11 0.32 0.07 0.15 0.74 0.62
HMD_m2 0.66 0.55 0.32 –0.09 0.52 0.53 0.80 0.53
HC 0.53 0.61 0.26 0.22 0.38 0.49 0.52 0.74
Wp3 0.58 0.70 0.14 0.31 0.35 0.23 0.80 0.48
Expl.Var. 18.73. 10.77. 2.05 7.17 6.53 5.27 19.41. 14.05.
Prp.Totl. 0.52 0.30 0.06 0.20 0.18 0.15 0.54 0.39
Table 3. Descriptive statistics of the measurements with the highest loadings on the first two PCs by morphogeographic groups, identified by model-based clustering of Crocidura. Morphogeographic groupNPC1PC2 PGWHPCCBLBLM2BLM1M1_M3 MeanSDMeanSDMeanSDMeanSDMeanSDMeanSD C. suaveolens (s.l.) – CE495.720.164.060.16216.260.3701.210.0501.410.0493.000.093 C. suaveolens (s.l.) – SEE455.910.204.250.18516.610.5251.160.0451.330.0512.880.072 C. leucodon – CE386.470.204.850.18718.830.5201.390.0551.640.0663.440.092 C. leucodon – SEE356.760.175.100.15919.160.4881.290.0481.540.0443.270.101 Table 4. Descriptive statistics of the measurements with the highest loadings on the first two PCs by morphogeographic groups identified by model-based clustering of Neomys.
Morphogeographic group
NPC1PC2 P4_M3M1_M3BLM2LM3LI1LTI1 MeanSDMeanSDMeanSDMeanSDMeanSDMeanSD N. anomalus – CE1055.300.133.750.101.470.050.820.051.840.080.840.06 N. anomalus – BG2165.510.143.880.101.520.050.860.041.770.070.780.05 N. fodiens – CE 385.610.113.890.081.470.050.840.042.150.080.950.06 N. fodiens – BG1235.740.153.980.111.560.050.860.042.030.070.870.05
A B
N. fodiens N. anomalus Number of componentsPC1 Pc2-4-220123456789 BIC
-6200 -6100
-6000 -5900
-5800
-2 -1
0 1
2 3
EII VII EEI VEI EVI VVI EEE
EVE VVEVEE EVVVEVEEV VVV
- cluster 1 - cluster 2 - cluster 3 - cluster 4 Fig. 4.Neomys: results of PCA and model-based clustering. a: Specimen scores for the first two Principal Components. Ellipses indicate morphological clusters revealed by model-based clustering (see Table 2 for identification of clusters); polygons outline species clouds; b: Bayesian Information Criterion (BIC) of different cluster solutions (for identification of symbols see Fig. 3b); the ‘best’ model with the highest BIC is EVE (ellipsoidal, equal volume and orientation) model with 4 components
S. araneus PC1-1.2-1.00.0 BIC
- cluster 1 - cluster 2 S. minutus -0.8-0.6-0.4-0.2
E III
I V
V V
V V E
E EE
EI VI II E
V VV EE
EE E
V VVE E
E EE VV V VV
–1000 –800 –600
–400 –200
A
PC2 –1 –212 0 Number of components135789642B
Fig. 5.Sorex: results of PCA and model-based clustering. a: Specimen scores for the first two Principal Components. Ellipses indicate morphological clusters revealed by model-based clustering (see Table 2 for identification of clusters); b: Bayesian Information Criterion (BIC) of different cluster solutions (for identification of symbols see Fig. 3b); the ‘best’ model with the highest BIC is VEV (ellipsoidal, equal shape) with 2 componentsGenus Neomys
The first three PCs with eigenvalues larger than one accounted for 19%
of variation in the dataset (Table 1). This low percentage compared with Cro- cidura, shows that in Neomys the inter- and intraspecific variability is less pro- nounced. Indeed, although the model based clustering revealed the presence of four morphological groups, they were tightly packed showing a substantial overlapping (Table 2, Figs 4a,b). PC1, accounting for 7.2% of the variation, represented some poorly expressed species differences in the lengths of the rostrum, the upper and the lower teeth rows (Table 1). PC2 explained 6.5% of the variation; it had significant positive loadings for morphometric characters associated with the overall skull size, but mainly with the size of the first up- per incisive. PC1 described some poorly pronounced differences between the smallest form – N. anomalus from Central Europe and the largest form within the dataset – N. fodiens from Bulgaria (SEE). To some extent, PC1 can be in- terpreted as an axis representing species differences. PC2 reflected the geo- graphic variability of N. fodiens and N. anomalus. Along this axis, the Bulgarian forms of both species are larger. According to the specimen scores (Fig. 4a) and univariate statistics of characters with great loadings on this axis (Table 4), this component registered variability opposite to that represented by PC1 – the forms from Bulgaria are smaller than those from the Central Europe. This axis reflects mostly the differences between N. fodiens from Central Europe and N. anomalus from Bulgaria. Interestingly, the differences between the two species were poorly pronounced along PC1 (dimensions of tooth rows) and better along PC2, representing the size of the upper incisor, with N. fodiens having bigger dimensions. It is noteworthy that the intra-specific differences were also better expressed along PC2. In this respect, it should be mentioned that along this axis the overlap between species from one geographical area was least expressed.
Genus Sorex
Since the differences in the sizes between the two species are too large, PCA gave only one component with eigenvalue larger than 1. The PC1 had eigenvalue equal to 32, while in PC2 it was only 0.5 (unrotated solution). Pre- dictably, model – based clustering revealed only 2 groups (Fig. 5). When the analyses were applied separately for each species, model – based clustering showed no grouping within species, displaying homogeneity of both species samples and lack of a clear intra-specific morphological geographic variabil- ity in the studied region.
DISCUSSION
The results show that the species of Neomys and Crocidura exhibit well- established morphological differences between the regions, while they were poorly expressed in Sorex. Considering that the samples were composed of in- dividuals from one age group, as well as the unbiased sex ratio of the regional samples to which the obtained morphological groups correspond nearly com- pletely (Table 2), it can be concluded that for the first two genera these results reflect geographic variability and are not the result of random differences in the age structure or sex ratio of the samples. Regarding the possible influence of the sex ratio, it can also be mentioned that a previous study has shown that, although there are sexual size differences, they are of much smaller magni- tude than the geographic variability (Zidarova 2015).
In Crocidura, PC1 having high loadings for nearly all measurements can be interpreted as representing the general “size”, while PC2 with high load- ings for some teeth measurements emphasizes the “shape” differences (Table 1). The forms of Crocidura from Bulgaria (SEE) have larger dimensions, but smaller teeth. The registered geographic variability with respect to the “over- all size” represented by the first principal component does not correspond to the Bergman’s rule. Literature data on the nature of geographic variability in Crocidura are limited and contradictory. Vesmanis (1976) reported for an opposite to Bergman’s rule tendency in C. suaveolens, but according to Yom- Tov and Geffen (2006) there is a negative correlation between body size and temperature in this species. It can be supposed that the differences in teeth dimensions, presented by the second principal component, reflect some ge- netic differences between geographical forms of both species. With regard to C. suaveolens, this assumption is in accordance with the recent molecular data (Bannikova et al. 2006), which indicate that the former subspecies C. s. mimula (Central Europe) and C. s. suaveolens (SE Europe) should be treated as sepa- rate species. Taking into consideration our results, as well as the geographical proximity of our sample localities and those from Crimea (Fig. 1), the type area for C. suaveolens, it is highly probable that shrews inhabiting eastern parts of Bulgaria belong to this species.
As for C. leucodon, the situation is similar to that of C. suaveolens (s. l.). The mitochondrial analyses of Dubey et al. (2007b) revealed two clades – a west- ern one recorded from France eastward to Greece and northwestern Anatolia, Turkey; and an eastern clade recorded in eastern parts of Bulgaria and Ro- mania, Georgia and the rest of Anatolia. Our results generally agree with the molecular data, showing that the populations from Eastern Bulgaria, which geographically belong to the eastern clade, are morphologically distinct from the Central European ones, belonging to the western clade. As in C. suaveolens, it could be suggested that the boundary between western and eastern clade of
C. leucodon extends meridionally throughout Bulgaria (Fig. 1). Further genetic and morphologic studies are required to test these hypotheses.
In Neomys, the intraspecific differences are better expressed along PC2.
In this respect, it should be mentioned that along this PC the overlap between species from one geographical area is least expressed. Given that the upper incisive is of a great importance for the capture of prey (Dötsch 1985), it can be assumed that these relatively well-pronounced differences in sympatry re- sult from selection in the direction of avoiding competition. In general, these results correspond to previous analyzes that indicate that in N. fodiens the geo- graphical variability is opposite to that of the Bergman’s rule (Balčiauskas et al. 2014) and that part of variation of both species may be explained by character displacement (Popov & Zidarova 2008). In contrast with the situ- ation in Crocidura, the tight packing in the morphological space is probably the main reason that character displacement or convergence due to competi- tion in sympatry (Rychlik et al. 2006, Kryštufek & Quadracci 2008, Popov &
Zidarova 2008) have a very pronounced effect and may embarrass the identi- fication of unequivocal diagnostic morphological characters (Igea et al. 2015).
In comparison with Crocidura and Neomys species, S. araneus and S. minu- tus don’t reveal any clear intraspecific variation by means of the chosen ana- lytical approach. Our results correspond to the data presented by other au- thors that there is no clear relation between morphology and genetics. Wójcik et al. (2000) and Mishta (2007) did not find larger morphological differences between races of S. araneus from Western European and those from Eastern European chromosomal groups than amongst different races from one chro- mosomal group. A number of researchers found no correlation between the karyotype differentiation and the phenotypic variability, and the craniomet- rical variability in particular (Searle & Thorpe 1987, Meyer & Searle 1994, Zima & Král 1995, Wójcik et al. 2000). According to Vega et al. (2016), mor- phological variation does not reflect genetic subdivision in S. minutus. Bernal (2010) found only poorly expressed morphological differences between CE and Balkan phylogroups with the exception of the mandible size, which is larger in the Balkans.
The above comparisons of the phenotypic variation of shrews with the available data from mitochondrial and nuclear markers show that the applica- tion of morphometric methods in taxonomy could be highly informative. The use of a wide range of morphological traits and their subsequent synthesis in terms of “size” and “shape” by applying various methods of multivariate analysis would help to interpret the patterns of morphological geographic var- iability and allow to some extent to distinguish the impact of environmental factors from that of genetic factors. Of course, best results could be expected by using both, morphometric and molecular, methods in parallel (Hillis 1987).
*
Acknowledgements – The access to the shrew cranium collections at Natural History Museum Vienna and Hungarian Natural History Museum was supported by two projects under the SYNTHESYS Project funding: “Geographic and ecological aspects of the mor- phometric variability of shrews (Mammalia: Insectivora, Soricidae): a comparative study on Central and South-Eastern European populations” (AT-TAF-2826, HU-TAF-2845).
REFERENCES
Amori, G., Gippoliti S. & Castiglia, R. (2009): European non-volant mammal diversity:
conservation priorities inferred from phylogeographic studies. – Folia Zoologica 58(3):
270–278.
Balčiauskas, L., Balčiauskas, L. & Timm, U. (2014): Bergmann’s rule for Neomys fodiens in the middle of the distribution range. – Central European Journal of Biology 9: 1147–
1154. https://doi.org/10.2478/s11535-014-0348-4
Bannikova, A., Lebedev, V., Kramerov, D. & Zaitsev, M. (2006): Phylogeny and systemat- ics of the Crocidura suaveolens species group: Corroboration and controversy be- tween nuclear and mitochondrial DNA markers. – Mammalia 70: 106–119. https://doi.
org/10.1515/mamm.70.1-2.106
Bannikova, A., Zemlemerova, E., Colangelo, P., Sözen, M., Sevindik, M., Kidov, A., Dzuev, R., Kryštufek, B. & Lebedev, V. (2015): An underground burst of diversity – a new look at the phylogeny and taxonomy of the genus Talpa Linnaeus, 1758 (Mam- malia: Talpidae) as revealed by nuclear and mitochondrial genes. – Zoological Journal of the Linnean Society 175: 930–948. https://doi.org/10.1111/zoj.12298
Bernal, R. R. V. (2010): Phylogeographic and morphometric studies on the Eurasian pygmy shrew Sorex minutus: insights into its evolutionary history and postglacial colonization in Europe.
– Dissertation, University of York, 243 pp.
Castiglia, R., Annesi, F., Aloise, G. & Amori, G. (2007): Mitochondrial DNA reveals dif- ferent phylogeographic structures in the water shrews Neomys anomalus and N.
fodiens (Insectivora: Soricidae) in Europe. – Journal of Zoological Systematics and Evo- lutionary Research 45: 255–262. https://doi.org/10.1111/j.1439-0469.2006.00391.x Castiglia, R., Annesi, F., Amori, G., Solano, E. & Aloise, G. (2017): The phylogeography
of Crocidura suaveolens from southern Italy reveals the absence of an endemic line- age and supports a Trans-Adriatic connection with the Balkanic refugium. – Hys- trix, the Italian Journal of Mammalogy 28(1): 104–106. https://dx.doi.org/10.4404/hys- trix-28.1-11897
Corbet, G. B. (1978): The mammals of the Palaearctic region: a taxonomic review. – British Mu- seum (Natural History), London, 314 pp.
Dehnel, A. (1949): Studies on the genus Sorex L. – Annales Universitatis Mariae Curie-Sklo- dowska, Sectio C – Biologia 4: 17–102. [in Polish with English summary]
de Jong, Y., Verbeek, M., Michelsen, V., Bjørn, P., Los, W., Steeman, F., Bailly, N., Basire, C., Chylarecki, P., Stloukal, E., Hagedorn, G., Wetzel, F., Glöckler, F., Kroupa, A., Korb, G., Hoffmann, A., Häuser, C., Kohlbecker, A., Müller, A., Güntsch, A., Stoev, P. & Penev, L. (2014): Fauna Europaea – all European animal species on the web. – Biodiversity Data Journal 2: e4034. https://doi.org/10.3897/BDJ.2.e4034
Dötsch, C. (1985): Masticatory function in shrews (Soricidae). – Acta Zoologica Fennica 173:
231–235.
Dubey, S., Zaitsev, M., Cosson, J. F., Abdukadier, A. & Vogel, P. (2006): Pliocene and Pleistocene diversification and multiple refugia in a Eurasian shrew (Crocidura sua veolens group). – Molecular Phylogenetics and Evolution 38: 635–47. https://doi.
org/10.1016/j.ympev.2005.11.005
Dubey, S., Cosson, J. F., Magnanou, E., Vohralík, V., Benda, P., Frynta, D., Hutterer, R., Vogel, V. & Vogel, P. (2007a): Mediterranean populations of the lesser white- toothed shrew (Crocidura suaveolens group): an unexpected puzzle of Pleistocene survivors and prehistoric introductions. – Molecular Ecology 16: 3438–3452. https://
doi.org/10.1111/j.1365-294X.2007.03396.x
Dubey, S., Cosson, J. F., Vohralík, V., Kryštufek, B., Diker, E. & Vogel, P. (2007b): Molecu- lar evidence of Pleistocene bidirectional faunal exchange between Europe and the Near East: the case of the bicoloured shrew (Crocidura leucodon, Soricidae). – Journal of Evolutionary Biology 20: 1799–1808. https://doi.org/10.1111/j.1420-9101.2007.01382.x Ellerman, J. R. & Morrison-Scott, T. C. S. (1966): Checklist of Palaearctic and Indian mam- mals (1758 to 1946). 2nd ed. – Trustees of the British Museum (Natural History), Lon- don, 830 pp.
Filippucci, M. G. & Simson, S. (1996): Allozyme variation and divergence in Erinaceidae (Mammalia, Insectivora). – Israel Journal of Zoology 42: 335–345.
Fraley, C. & Raftery, A. E. (2012): mclust Version 3 for R: Normal Mixture Modeling and Model-based Clustering. – Technical Report 597, University of Washington, Depart- ment of Statistics, 57 pp.
Hillis, D. M. (1987): Molecular versus morphological approaches to systematics. – An- nual Review of Ecology and Systematics 18: 23–42. https://doi.org/10.1146/annurev.
es.18.110187.000323
Igea, J., Aymerich, P., Bannikova, A. A., Gosálbez, J. & Castresana, J. (2015): Multilo- cus species trees and species delimitation in a temporal context: application to the water shrews of the genus Neomys. – BMC Evolutionary Biology 15: 209. https://doi.
org/10.1186/s12862-015-0485-z
Klingenberg, C. P. (2016): Size, shape, and form: concepts of allometry in geometric mor- phometrics. – Development Genes and Evolution 226: 113–137. https://doi.org/10.1007/
s00427-016-0539-2
Kryštufek, B. & Quadracci, A. (2008): Effects of latitude and allopatry on body size varia- tion in European water shrews. – Acta Theriologica 53: 39–46. https://doi.org/10.1007/
BF03194277
Meyer, A. & Searle, J. B. (1994): Morphological studies on British common shrews. – Folia Zoologica 43: 115.
Mishta, A. V. (2007): Morphometric variation of the common shrew Sorex araneus in Ukraine, in relation to geoclimatic factors and karyotype. – Russian Journal of Theriol- ogy 6: 51–62. https://doi.org/10.15298/rusjtheriol.06.1.09
Niethammer, J. (1977): Ein syntopes Vorkommen der Wasserspitzmäuse Neomys fodiens und N. anomalus. – Zeitschrift für Säugetierkunde 42: 1–6.
O’Brien, S. J. & Mayr, E. (1991): Bureaucratic mischief: recognizing endangered species and subspecies. – Science 231: 1187–1188. https://doi.org/10.1126/science.251.4998.1187 Ohdachi, S. D., Masahiro, A. I., Nesterenko, V. A., Abe, H., Masuda, R. & Haberl, W.
(2004): Molecular phylogenetics of Crocidura shrews (Insectivora) in East and Central Asia. – Journal of Mammalogy 85: 396–403. https://doi.org/10.1644/1545- 1542(2004)085<0396:MPOCSI>2.0.CO;2
Padial, J. M., Miralles, A., De la Riva, I. & Vences, M. (2010): The integrative future of taxonomy. – Frontiers in Zoology 7: 16. https://doi.org/10.1186/1742-9994-7-16
Popov, V. & Zidarova, S. (2008): Patterns of craniometric variability of Neomys fodiens and Neomys anomalus (Mammalia, Insectivora) in Bulgaria – role of abiotic and bi- otic factors. – Acta Zoologica Bulgarica 60: 171–185.
Rychlik, L., Ramalhinho, G. & Polly, P. D. (2006): Response to environmental factors and competition: skull, mandible and tooth shapes in Polish water shrews (Neomys, Soricidae, Mammalia). – Journal of Zoological Systematics and Evolutionary Research 44:
339–351. https://doi.org/10.1111/j.1439-0469.2006.00374.x
Searle, J. B. & Thorpe, R. S. (1987): Morphometric variation of the common shrew (Sorex araneus) in Britain in relation to karyotype and geography. – Journal of Zoology 212:
373–377. https://doi.org/10.1111/j.1469-7998.1987.tb06003.x
StatSoft, Inc. (2004): STATISTICA (data analysis software system), version 7. – https://
www.statsoft.com
Vega, R., Mcdevitt, A. D., Kryštufek, B. & Searle, J. B. (2016): Ecogeographical patterns of morphological variation in pygmy shrews Sorex minutus (Soricomorpha: Soricinae) within a phylogeographical and continental-and-island framework. – Biological Jour- nal of the Linnean Society 119: 799–815. https://doi.org/10.1111/bij.12858
Vesmanis, I. (1976): Comparative morphometric studies on the garden shrew from Yu- goslavia. – Acta Theriologica 21(32–39): 513–526. https://doi.org/10.4098/AT.arch.76-45 Vogel, P., Cosson, J. F. & Jurado, L. F. L. (2003): Taxonomic status and origin of the shrews
(Soricidae) from the Canary Islands inferred from a mtDNA comparison with the Eu- ropean Crocidura species. – Molecular Phylogenetics and Evolution 27: 271–282. https://
doi.org/10.1016/S1055-7903(02)00403-7
Wheeler, Q. D. (2004): Taxonomic triage and the poverty of phylogeny. – Philosophical Trans- actions of the Royal Society of London. Series B 359: 571–583. https://doi.org/10.1098/
rstb.2003.1452
Wiens, J. J. (2007): Species delimitation: new approaches for discovering diversity. – Sys- tematic Biology 56: 875–878. https://doi.org/10.1080/10635150701748506
Wójcik, J. M., Bogdanowicz, W., Pucek, Z., Wójcik, A. M. & Zalewska, H. (2000): Morpho- metric variation of the common shrew Sorex araneus in Poland, in relation to karyo- type. – Acta Theriologica 45: 161–172. https://doi.org/10.4098/AT.arch.00-71
Wolsan, M. & Hutterer, R. (1998): Appendix: list of the living species of shrews. Pp.
425–448. In: Wójcik, J. M. & Wolsan, M. (eds): Evolution of shrews. – Mammal Re- search Institute, Polish Academy of Sciences, Bialowieza, Poland. https://doi.
org/10.4324/9780203499146.ax
Yeates, D. K., Seago, A., Nelson, L., Cameron, S. L., Joseph, L. & Trueman, J. W. H. (2011):
Integrative taxonomy, or iterative taxonomy? – Systematic Entomology 36: 209–217.
https://doi.org/10.1111/j.1365-3113.2010.00558.x
Yom-Tov, Y. & Geffen, E. (2006): Geographic variation in body size: the effects of ambi- ent temperature and precipitation. – Oecologia 148: 213–218. https://doi.org/10.1007/
s00442-006-0364-9
Zidarova, S. (2015): Is there sexual size dimorphism in shrews? A case study of six Euro- pean species of the family Soricidae. – Acta Zoologica Bulgarica 67: 19–34.
Zima, J. & Král, B. (1995): Karyotype variability in Sorex araneus in Central Europe (Sori- cidae, Inectivora). – Folia Zoologica 34: 235–243.
Received August 11, 2017, accepted January 19, 2018, published August 1, 2018