Study of the Drive Characteristics Affecting the Power Loss of V-Belt Drives
Péter Gárdonyi, István Szabó, László Székely and László Kátai
Faculty of Mechanical Engineering, Szent István University Páter Károly út 1, 2100 Gödöllő, Hungary
gardonyi.peter@gek.szie.hu, szabo.istvan@gek.szie.hu, szekely.laszlo@gek.szie.hu, katai.laszlo@gek.szie.hu
Abstract: The V-belt drive heats up during power transmission, i.e. a significant part of power loss turns into heat and is transferred to the environment. In this paper, the temperature rise in the V-belt was studied as loss intensity as a function of the drives parameters. It was justified in the scope of the major characteristics affecting power loss that by ideally selecting the parameters of the V-belt drive power loss can be measurably reduced. Based on earlier results as well, a regression model was used to examine the temperature rise in the V-belt. With the help of analysis of variance (ANOVA), the magnitude of the effect of each drive parameter was determined on the warming of the V- belt. According to our results, the most relevant drive parameter is the pulley diameter.
Keywords: ANOVA; Efficiency; Power loss; Temperature; V -belt
1 Introduction
Belt drives are widely used power transmission solutions, both in the field of industry and agriculture [1, 2]. Various types of belts are used, e.g. flat belts, V- belts, poly-V-belts. Flat belts have small bending rigidity, V-belts have large power transmission capability and poly-V belts combine these properties [3]. In regular industrial and agricultural use V-belts are the most wide-spread belt drive solutions.
The V-belt drive, like any machine structure, operates with certain efficiency, which is the ratio of useful and input power. The difference between these gives power loss, most of which turns into heat.
During the power transmission of belt drives, the heat build-up of the belt is the result of basically two impacts. The heat build-up due to the macroscopic friction of the contacting surfaces, and the proportion of hysteresis loss occurring because of the repeated bending of the belt (internal friction (slip among the molecules)) which turns into heat, Gerbert [4].
Childs and Cowburn [5] performed a series of measurements on the power loss of flat and V-belts associated with a very small pulley. They found that the reduced efficiency of belts that do not match their pulley groove angles may be due to greater radial compliance of these belts. In the companion paper [6], the experimental study quantified the effects of pulley radius, belt tension and belt deformation properties on speed and torque losses during power transmission.
Gerbert [7, 8, 9] from 1972 studied the mechanical behavior of V-belt drives in details. A unified slip theory [9] was proposed for the V-belt drives considering four factors that may affect belt slip, i.e. elastic creep along the belt, compliance in the radial direction, shear deflection that varies both radially and axially, and flexural rigidity during engagement/disengagement of the belt. This paper summarizes the reasons for the speed loss of rubber V-belt drives. On the other hand, Gervas and Pronin [10, 11] proposed that the torque loss of rubber V-belt drives resulted mainly from: (1) hysteresis losses in the materials when the belt was bent on and off the pulleys, and the belt was compressed into the groove of the pulleys; (2) the radial sliding losses as the belt is continuously wedged into and out of the pulleys. These loss components were studied by several researchers e.g. in case of CVT and flat belt drives [12, 13, 14].
Several researchers deal with V-ribbed drives. Song et al. [15] performed the thermal–mechanical finite element analysis of a two pulley V-ribbed belt drive system. In addition to material nonlinearity, large deformation, and frictional contact, the analysis took into account the thermal degradations and thermal expansions of belt rubber compounds. The temperature effects on stresses, strains, and belt-pulley contact slip rates were studied in detail. Yu et al. [16] presented a comprehensive study of the belt moving in pulley grooves. A three-dimensional finite element model represented a complete half rib operating between two pulleys.
Previous experimental studies on power loss behavior of belt drives usually considered V-belt and continuously variable transmission (CVT) belt drives.
Childs and Cowburn [17] experimentally investigated the effects of mismatch between the wedge angles of pulley grooves and belt ribs on the power loss behavior of V-belt drives. During the tests, they kept the other parameters constant. They [5] also studied the effects of small pulleys on the power loss both theoretically and experimentally.
Lubarda [18] analytically formulated the variation in the belt force over the arc of contact of flat and V-belts before gross slip occurs. He separated the arc of contact into active and non-active regions, similar to the approach of Gerbert [6] and Johnson [19].
The V-belt drive, like any machine structure, operates with certain efficiency, which is the ratio of useful and input power. The difference between these gives power loss, most of which turns into heat. If the stabilized temperature of the V- belt is examined as loss intensity, the efficiency of the belt drive can be concluded
from it. Higher belt temperatures lead to the degradation of molecular chains, to the aging of the rubber, which significantly influences belt life.
In our earlier measurements we have investigated the heating generated inside V- belts due to repeated bending and engagement/disengagement and to define the damping coefficient during idle running, causing the increase in temperature [1].
The effect of the test parameters (pulley diameter, bending frequency, pre- tensioning) was studied separately. On the basis of our previous studies it can be concluded that bending frequency and belt temperature are linearly related [20].
Further tests were also carried out to find out to what extent drive set-up faults contribute to heat build-up in the V-belt and thus how they affect the efficiency of the drive [20].
In the present study, the effects of the belt-drive parameters on the temperature increase of V-belt are experimentally investigated. Although the temperature in the belt is affected by the contact between the belt and the pulley, the aim of our research is to determine the effect of the most important operating parameters in some fixed conditions (e.g. laboratory temperature, humidity, i=1 speed ratio, steel pulley, etc.).
For this purpose, test equipment was constructed with two equal-sized pulleys to measure the temperature of the V-belt. In comparison to the previous studies, a much larger number of parameters and their interactions are taken into consideration; they include belt tension, belt bending frequency, braking torque, pulley diameter. The effects and the interaction of these drive parameters to the belt temperature are investigated in the first time.
After the measurement and data collection process we constructed a nonlinear multiple regression model to see the relation between the response parameter and the independent parameters. The model strongly relies on the one-factor-at-a-time measurement results achieved in our previous papers [1, 20, 21].
2 Method
The objective of the test is to experimentally determine the drive characteristics affecting V-belt drive loss, and their relationship. The majority of the losses turn into heat, so the temperature rise in the V-belt was chosen as the test parameter, which means the power loss between the two steady states - between the workshop and the stabilized state of the operating temperature.
2.1 Experimental Plan
Table 1 summarizes the factors of the experimental settings on the basis of the effects determining heat buildup and the drive parameters involved in them. The
V-belt heats up due to the macroscopic friction of the contacting surfaces and the hysteresis loss occurring as a result of the repeated use of the belt, i.e. power loss turns into heat. These two fundamental effects are affected by the relationship of V-belt slippage and bending. The drive parameters of V-belt drive are not independent of each other, certain parameters can be combined, so our experiment is reduced to four independent variables.
Table 1
Defining the experimental factors Nature of heat
buildup V-belt strain Drive
characteristics
Experiment variables (Factors) friction of
contacting surfaces
relative movement of V- belt in the pulley groove
(flexible slippage, wedging effect)
pre-tensioning FH pre-tensioning FH braking torque M braking torque M
grip angle b
pulley diameter d hysteresis loss
due to belt bending, inner
friction
amplitude of bending stress in a load-unload
cycle of the V-belt
belt profile pulley diameter d material properties
of V-belt
frequency of V-belt use belt speed
vb
revolution n
belt bending frequency f pulley
diameter d V-belt length Ld
The test was conducted with a Z/10 profile V-belt, 5 pulley diameters (d1 = 60, 90, 118, 150, 180 mm), 1:1 ratio. With the fixed value of the free belt section length (345 ± 10 mm) the same flexibility of the different drive settings was ensured, which meant a different V-belt length per pulley diameter. With the revolution of the drive shaft in line with the interval generally occurring in practice 10 and 20 s- 1 belt bending frequency values were set. The V-belt drive was loaded with the largest transferable torque calculated on the basis of the given pulley diameter and bending frequency, and it was studied without power transmission. With the different experimental settings the value of pre-tensioning was determined based on the drive sizing, it was set at 50, 100, 150% of that. In practice pre-tensioning is the most difficult to set precisely from the drive belt parameters, therefore the setting of a wide range is justified. Table 2 shows the levels of experimental factors and factor space.
The V-belt drive was studied under normal operating conditions, within the limits of flexible slippage, for this the value of belt slippage was continuously measured.
Overload occurred in the case of decreased pre-tensioning, with two experimental settings, they were ignored during the evaluation. In the case of settings without load the effect of pre-tensioning force could.
Table 2
Values of experimental factors and factor levels
Factor Unit Factor levels High Low
Pulley diameter d Mm 5 60 180
Bending frequency f s-1 2 10 20
Braking torque M N 2 0 MN
Pretension FH N 3 0.5∙FHN 1.5∙FHN
2.2 Measurement of Temperature Rise in V-Belt
The temperature rise in the V-belt was determined from the function describing temperature change (Baule-Mitscherlich), in which the measured parameters change along a decreasing gradient towards the maximum of saturation. With the help of the mathematical model it was possible to calculate the steady-state operating temperatures, so they did not have to be reached during the experiments.
Thereby the duration of the measurement was uniformly determined with each experimental setting regardless of whether the belt temperature was steady under the given circumstances or not.
The general equation of the function of saturation is:
𝑌 = 𝐴 ∙ (1 − 𝑒𝑧+𝑐∙𝑋) (1) Among the function parameters A indicates the stabilized temperature of the V- belt, c indicates the speed of heat buildup and z indicates the temperature of the belt at the beginning of the measurement.
Figure 1
Thermal camera image and its evaluation
The temperature was measured with an infra camera type NEC H2640. During our experiments the side surfaces of the V-belt in contact with the groove were tested, which contained more information about the operation of the drive. Temperature data were obtained from the heat camera images taken of the active surface of the V-belt after image processing (Fig. 1).
Table 3 Design matrix
Runs 1 2 3 4 5 6 7 8 9 10 11 12 13
Factor 1 d1 [mm] 180 180 180 180 180 180 150 150 150 150 150 150 118 Factor 2 f [s-1] 20 20 20 10 10 10 20 20 20 10 10 10 20 Factor 3 M [Nm] 1 1 1 1 1 1 1 1 1 1 1 1 1 Factor 4 FH [N] 1 1.5 0.5 1 1.5 0.5 1 1.5 0.5 1 1.5 0.5 1 Response ΔT [°C] 6.2 6.4 6.2 4.1 4.6 4.1 8.5 8.7 8.7 6.1 6.1 6.1 16.2
Table 3 (continued) Design matrix
14 15 16 17 18 19 20 21 22 23 24 25 26 27 28 118 118 118 118 118 90 90 90 90 90 90 60 60 60 60
20 20 10 10 10 20 20 20 10 10 10 20 20 20 10
1 1 1 1 1 1 1 1 1 1 1 1 1 1 1
1.5 0.5 1 1.5 0.5 1 1.5 0.5 1 1.5 0.5 1 1.5 0.5 1 15.8 17.2 10.2 11.2 11.1 23.9 22.9 24.6 16.3 16.4 18.3 38.1 38.6 40.2* 28.2
Table 3 (continued) Design matrix
29 30 31 32 33 34 35 36 37 38 39 40 60 60 180 180 150 150 118 118 90 90 60 60 10 10 20 10 20 10 20 10 20 10 20 10
1 1 0 0 0 0 0 0 0 0 0 0
1.5 0.5 1 1 1 1 1 1 1 1 1 1
28.5 32.6* 5.3 4.2 7.3 5.4 9.7 6.7 16.5 10.9 32.9 25.7
* Outlier
2.3 The Test Equipment and its Tools
The experiments were conducted on the universal test bench developed at the Department of Machine Design, Szent István University. Due to its design, it is suitable for testing a wide range of mechanical drives, clutches and rotating elements. The grooved table of the test bench offers numerous possibilities of placing the driving and driven units. For the testing of the belt drives, the drive unit was fixed to a tensioning mechanism guided by a linear bearing. The pre- tensioning of the belt can be set with an adjusting spindle and a load cell connected in series with it, whose line of action coincides with that of the shaft pulling force (FH). In this way the pre-tensioning force can be measured directly.
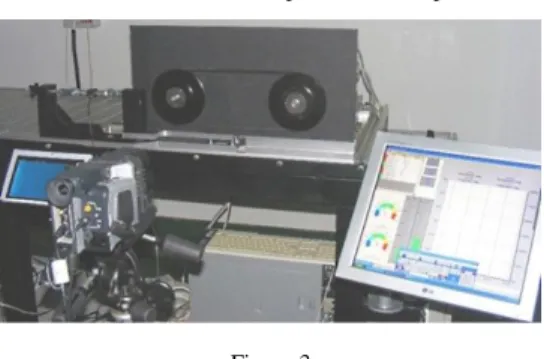
The structure of the universal test bench is shown in Figures 2-3. During the measurements it is possible to fix all the drive parameters through a measuring- data collector and to precisely define them with the help of a programmable logic controller (PLC).
Figure 2
Schematic of the experimental setup
Figure 3 The experimental setup
3 Results and Discussion
3.1 Nonlinear Regression Model for Temperature Change
In earlier studies the individual effect of pulley diameter [17] and frequency [18]
of belt bending on temperature change of the belt has already been investigated with one-factor-at-a-time (OFAT) method. The following experimental relation of the temperature and the diameter was obtained in [17]:
∆𝑇 = 𝑎0+𝑎1
𝑑 (2) where a0 and a1 are constants.
Figure 4
Temperature increase of the belt sides as a function of the pulley diameter (profile: SPA; d1 = 90, 112, 132, 150, 180 mm; i = 1; Ld = 1207; f =20 s-1; M1 = 0 Nm) [17]
Figure 5
Temperature increase of the belt sides as a function of the bending frequency (profile: SPA; d1 = 112 mm; i = 1; Ld = 1207; f =5,6 - 23,1 s-1; M1 = 0 Nm) [17]
Furthermore, it turned out [17] that ΔT is approximately a linear function of f. In order to see the relationship between the pre-tensioning and the change in temperature, similarly to previous experiments, the values of the other independent variables were fixed and only the extent of the studied parameter was changed (see Figs. 6-7). It shows that ΔT is also a linear function of FH (R2 varies between 0.9964 - 0.9991). Based on these results we build a nonlinear regression model to investigate the qualitative relationship between the control parameters and the response parameter. In our models the dependence of ΔT on d, f and M is considered in the previously discussed characteristic way and for simplicity we assume a linear dependence of ΔT on M. Our model is
∆𝑇 = 𝑎0+𝑎1
𝑑 + 𝑎2𝑓 + 𝑎3𝑀 + 𝑎4𝐹𝐻 (3) where a0,…,a4 are constants.
Figure 6
Temperature increase of the belt sides as a function of the pretension on frequency level f = 20 s-1 ((profile: Z/10; d1 = 60, 90, 118, 150, 180 mm; i = 1; a = 345 ± 10 mm; M = MN)
Figure 7
Temperature increase of the belt sides as a function of the pretension on frequency level f = 10 s-1 ((profile: Z/10; d1 = 60, 90, 118, 150, 180 mm; i = 1; a = 345 ± 10 mm; M = MN)
3.2 Analysis of Variance (ANOVA)
For a regression model analysis of variance (ANOVA) is the tool to check its relevance. If the resulting significance level is high ( p > 0.05) then the model is not applicable for the quantitative description of the phenomena. Furthermore, using ANOVA, the total variance of the response variable is decomposed into the sum of variance explained by the control parameters plus the residual, which is the difference between the measured and the predicted value. A T-test is used to evaluate the significance of each coefficient in the regression equation If the significance level of the T-test for a coefficient is high ( p > 0.05) it means that the coefficient of the corresponding control variable is statistically 0. In Table 4 we summarize the results of ANOVA.
Table 4
ANOVA for temperature change Source Sum of
squares
Degree of freedom
Mean square
F/T value
P
Model 3574.22 37 1158.16 394.75 <0.001
d 3152.84 4 788.21 29.824 <0.001
f 211.43 1 211.43 8.489 <0.001
M 129.39 2 64.67 6.228 <0.001
FH 2.43 2 1.22 -0.423 0.675
Residual 99.75 34 3.99
Table 5
Coefficient of the parameters in the regression model Model coefficient Beta coefficient t p
constant -17.100 -14.973 <0.001
1/d 2317.476 0.888 29.824 <0.001
f 0.472 0.243 8.489 <0.001
M 4.430 0.185 6.228 <0.001
From the table one can see that the F-value of the model is significant, that is our model is relevant. Except the coefficient of pre-tension the coefficients of all other control variables significantly differ from 0. With the obtained values of the coefficients our model is of the form
∆𝑇 = −17.1 +2317.476
𝑑 + 0.472 𝑓 + 4.43 𝑀 (4) The value for goodness of fit of the model is R2 = 0.970. According to the variance components of the control variables the reciprocal of the diameter affects the temperature change in the largest extent, the effect of frequency and pretension is almost the same and a magnitude smaller than of the diameter.
3.3 Verification of the Model
Using the same experimental setup with arbitrarily chosen control parameter values we performed additional tests to verify our model. These experiments reveal that the difference between the predicted values for the temperature change and the experimental values are smaller than 5% and is our model is reasonably accurate (see Table 6).
Table 6
Model verification control parameters Pulley
diameter d [mm]
Bending frequency
f [s-1]
Braking torque M [Nm]
Pretension FH [N]
Measured value ΔT
[°C]
Calculated value ΔT
[°C]
Relative difference
[%]
1 118 20 0,5 MN 1 FHN 13.7 14.19 3.6
2 180 20 1/3 MN 1 FHN 6.4 6.69 4.6
3 118 15 0 MN 1 FHN 9.5 9.62 1.3
4 150 20 1/3 MN 1 FHN 8.8 9.27 4.9
5 60 15 0 MN 1 FHN 28.5 28.60 0.2
Conclusions
In this paper, the drive parameters affecting the power losses of V-belt drives were studied. The majority of the losses turn into heat, so the temperature rise in the V- belt was chosen as the test parameter, which means the power loss between the two steady states - between the workshop and the stabilized state of the operating temperature.
It can be seen from the experiments conducted, that the selection of drive parameters plays an important role in the temperature increase in V-belts. The loss of V-belt drive is directly proportional to bending frequency, pre-tensioning and load, whereas, inversely proportional to the diameter of the pulley. With the help of the analysis of variance, it was concluded that from the drive parameters, the diameter of the pulley affects the temperature buildup in the V-belt to the largest extent; the effects of the bending frequency, pre-tensioning and load are nearly identical, but at the same time, this effect is more than an order of magnitude less than that of the pulley diameter.
A significant part of the temperature rise is due to internal friction caused by bending, due to the viscoelastic behavior of the V-belt from its material properties.
The bending stress is inversely proportional to the diameter of the pulley, this relationship is also justified by the model of temperature rise from bending.
When designing a highly efficient belt drive it is necessary to select the above mentioned characteristics optimally.
Nomenclature
FH : Pre-tensioning of the V-belt drive M : Braking torque
b : Arc of contact d : Pulley diameter
f : V-belt bending frequency
Ld : V-belt length
ΔT : V-belt temperature increase i : speed ratio
a : drive center distance p : significance level References
[1] L. Kátai and I. Szabó, Identification of V-belt power losses with temperature measurement, Journal of Mechanical Science and Technology, 29 (8) (2015) 3195-3203
[2] F. H. Schafer, Antriebsriemen. Arntz Optibelt Gruppe Höxter, 2007, ISBN 978-3-00-0217113-5
[3] A. Grinčová, M. Andrejiová, D. Marasová: Analysis of Conveyor Belt Impact Resistance Data Using a Software Application, Acta Polytechnica Hungarica, Vol. 14, No. 2 (2017) 113-130
[4] B. G. Gerbert, Power loss and optimum tensioning of V-belt drives, Journal of Engineering for Industry, 96 (1974) 877-885
[5] T. H. Childs, D. Cowburn, Power Transmission Losses in V-Belt Drives Part 2: Effects of Small Pulley Radii, Proceedings of the Institution of Mechanical Engineers, Part D: Journal of Automobile Engineering, 201 (1) (1987) 41-53
[6] B. G. Gerbert, On flat belt slip, Vehicle Tribology, Tribology Series, 16 (1991) 333-339
[7] B. G. Gerbert, Force and slip behavior in V-belt drives, Acta Polytechnica Scandinavica, Mechanical engineering series, 67 (1972)
[8] B. G. Gerbert, Pressure Distribution and Belt Deformation in V-Belt Drives, Journal of Engineering for Industry, 97 (1975) 976-982
[9] B. G. Gerbert, G. Belt slip — a unified approach, Journal of Mechanical Design, 118 (3) (1996) 432-438
[10] K. J. Gervas and B. A. Pronin, Calculation of Power Losses in Belt Drives, Russian Engineering Journal, 47 (3) (1967) 26-29
[11] K. J. Gervas, Determining the Power Losses in V-belt Drives During Flexure, Soviet Rubber Technology, 28 (2) (1969) 42
[12] L. Bertini, L. Carmignani, F. Frendo, Analytical model for the power losses in rubber V-belt continuously variable transmission (CVT), Mechanism and Machine Theory, 78 (2014) pp. 289-306
[13] L. D. Pietra, F. Timpone, Tension in a flat belt transmission: Experimental investigation, Mechanism and Machine Theory, 70 (2013) pp. 129-156 [14] C. Zhu, H. Kiu, J. Tian, Q. Xiao, X. Du, Experimental investigation on the
efficiency of the pulley-drive CVT, International Journal of Automotive Technology, 11 (2010) pp. 257-261
[15] G. Song, K. Chandrashekhara, W. F. Breig, D. L. Klein and L. R. Oliver, Analysis of cord reinforced poly-rib serpentine drive with thermal effect, Journal of Mechanical Design, 127 (2005) 1198-1206
[16] D. Yu, T. Childs and K. Dalgarno, Experimental and finite element studies of the running of V-ribbed belts in pulley grooves, Proceedings of the Institution of Mechanical Engineers C, Journal of Mechanical Engineering Science, 212 (1998) 343-354
[17] T. H. C. Childs and D. Cowburn, Power transmission losses in V-belt drives, Part 1: Mismatched belt and pulley groove wedge angle effects, Proceedings of the Institution of Mechanical Engineers D, Transport Engineering, 201 (1987) 33-40
[18] V. A. Lubarda, Determination of the belt force before the gross slip, Mechanism and Machine Theory, 83 (2015) 31-37
[19] K. L. Johnson, Contact Mechanics, first ed. Cambridge University Press, London, UK (1987)
[20] P. Gárdonyi, L. Kátai and I. Szabó, Examination of drive misalignment and v-belt temperature conditions, International Journal of Science, Technics and Innovations for the Industry, 12 (2015) 56-59
[21] P. Gárdonyi, L. Kátai and I. Szabó, Relationship between the pulley diameter and V-belt temperature conditions, Scientific Conference of Young Engineers, XX, Cluj-Napoca, Romania (2015) 151-154