The Hungarian Academy of Sciences Doctor of Sciences Dissertation
THE ROLE OF MOLECULAR GENETICS IN EXPLORING THE PATHOGENESIS OF MULTIPLE SCLEROSIS
BERNADETTE KALMAN, M.D. PH.D.
2010
CONTENT
Preface 7
1. INTRODUCTION 8
1.1 THE MS PHENOTYPE 8
1.1.1 Terminology and definition 8
1.1.2 Features of autoimmunity in MS 9
1.1.3 Neurodegeneration in MS 9
1.1.4 Current concepts of immune mediated demyelination and neurodegeneration 10
1.2 GENETICS OF MS 13
1.3 OBJECTIVES OF THE STUDIES 16
2. THE ROLE OF CC CHEMOKINES IN INFLAMMATORY DEMYELINATION 17
2.1 BACKGROUND 17
2.2 PATIENTS AND METHODS 19
2.2.1 Studies on 17q11: phase I – LD mapping 19
Patients, families and DNA specimens 19
Genotyping 20
SNPs 21
Analyses 22
Files 22
Power estimate 22
PDT 22
TRANSMIT 23
Ldmax 23
Computation 24
2.2.2 Studies on 17q11: phase II – LD mapping 24
Patients, families and DNA 24
Genotyping 24
SNPs 24
Analyses 25
2.2.3 Studies on 17q11: Phase III – Sequence analyses 26
Patients and families 26
Sequencing 26
Genotyping 27
Analyses 27
2.2.4 Expression of CCL molecules in MS brains 27
Patients and specimens 27
Isolation of RNA 29
Real Time PCR 29
Analyses of data 30
2.3 RESULTS 30
2.3.1 Studies on 17q11: phase I – LD mapping 30
Allele and genotype frequencies 30
Markers showing allelic associations with MS 30
Haplotypes associated with MS 30
LD distribution 32
Summary of findings 33
2.3.2 Studies on 17q11: phase II – LD mapping 34
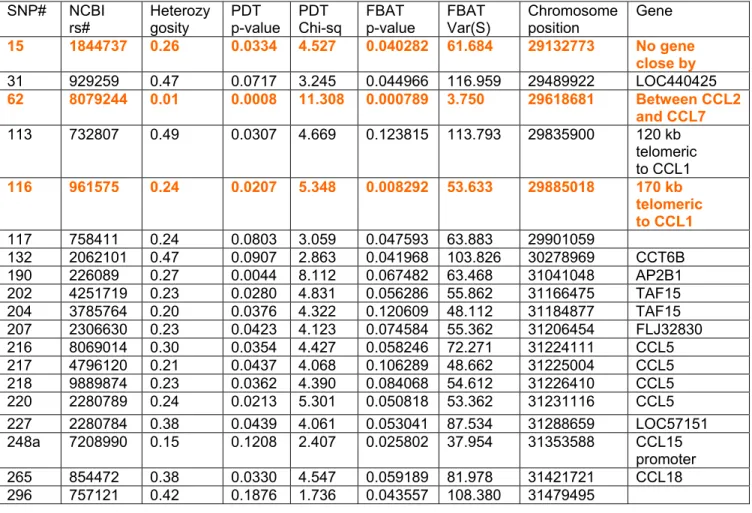
Results from PDT and FBAT 34
Results from TRANSMIT and HBAT 34
LD assessment 37
Summary of findings 39
2.3.3 Studies on 17q11: Phase III – Sequence analyses 39
Sequence analyses and genotyping 39
Summary of findings 40
2.3.4 Expression of CCL molecules in MS brains 40
Regional mRNA expression of β-chemokines in MS brains 40
Summary of findings 40
2.4 DISCUSSION: THE ROLE OF CCL MOLECULES IN MS 42
2.4.1 Association studies identify haplotypes in the CCL genes within 17q11 42 2.4.2 Expression and function of the identified gene products in MS 44 2.4.3 Overall importance of CCLs as inflammatory mediators in MS 46 3. MITOCHONDRIAL GENETICS AND MECHANISMS OF NEURODEGENERATION 49 IN MS
3.1 BACKGROUND 49
3.1.1 Involvement of mtDNA in MS, PON and NMO 49
3.1.1.1 Mitochondrial genetics in inflammatory demyelination 49
3.1.1.2 Phenotypes of ON, PON, NMO and LHON 50
3.1.1.3 LHON mutations in MS, PON and NMO 52
3.1.2 Mitochondrial and nuclear DNA encoded genes of Complex I 53
3.1.2.1 Complex I 53
3.1.2.2 Pathogenic mutations and functional impairment of Complex I 53 3.1.2.3 Possible involvement of Complex I variants in MS 54 3.1.3 Possible involvement of Complex I in neurodegeneration secondary to
inflammation 55
3.2. PATIENTS AND METHODS 55 3.2.1 MtDNA mutations, variants and haplotypes in MS, PON and Devic’s disease 55
3.2.1.1 MtDNA mutations and variants in MS 55
Patients and specimens 56
DNA extraction, amplification, sequencing and restriction endonuclease analyses 57 3.2.1.2 Screening for LHON mutations in patients with PON 57
Patients and specimens 57
Methods 60
3.2.1.3 Sequence analyses of the entire mtDNA in patients with MS and NMO 60
Patients 60
Methods 61
3.2.1.4 A comprehensive screening of mtDNA in Caucasian MS patients and controls 63
Patients and controls 63
Methods 64
3.2.2 Genetic analysis of Complex I in MS 65
Patients, families and DNA specimens 65
SNPs 67
Genotyping 67
Methods of analyses for nDNA variants 67
Analysis of mtDNA variants 67
3.2.3 Oxidative damage to mtDNA, activity of mitochondrial enzymes, somatic mtDNA deletions and expression of
apoptosis-related molecules in lesions of MS 67
3.2.3.1 Oxidative damage and activity of OXPHOS 67
Autopsy brain tissues 68
Southern blot detection of oxidative damage to mtDNA 68 Immunohistochemical detection of oxidative damage to DNA 69 Assays for citrate synthase and respiratory chain complexes 69
Statistics 70
3.2.3.2 Detection of mtDNA somatic deletions 70
Autopsy brain tissues 70
Preparation of tissues 71
COX / SDH histochemistry 71
Isolation of DNA from single cells 73
Real-time PCR 73
Statistics 74
3.2.3.3 mRNA expression for apoptosis related molecules 75
Patients and specimens 75
Isolation of RNA 75
Real Time PCR 75
Analyses of data 75
3.3 RESULTS 75
3.3.1 Mitochondrial DNA mutations in MS, PON and NMO 75
3.3.1.1 Mitochondrial DNA mutations in MS 75
3.3.1.2 LHON type mtDNA mutations in patients with PON 78 3.3.1.3 Sequence analyses of the entire mtDNA in patients with MS and NMO 79 Sequencing of mtDNA in 3 MS and 3 NMO patients 79 Characterization of the selected mtDNA variants 82 3.3.1.4 Large scale screening of mtDNA in Caucasian controls and patients with MS 87
The MS associated mtDNA polymorphisms 87
The MS associated mtDNA haplotypes 88 MS phenotypes do not correlate with mtDNA genotypes 91
3.3.2 Genetic variants of Complex I in MS 93
nDNA encoded SNP alleles and genotypes 93
Transmission of Complex I variants from unaffected parents to affected children 93 Investigation of the preferentially transmitted haplotypes 96 LD distribution in regions of interest 96
mtDNA encoded SNP variants 97
3.3.3 Oxidative damage to mtDNA, activity of mitochondrial enzymes, somatic mtDNA deletions and expression of apoptosis-related molecules in chronic active plaques 98
3.3.3.1 Southern blot analysis of oxidative damage to mtDNA in plaque and 98 NAWM pairs
3.3.3.2 Detection of oxidative damage to DNA in plaques by immunohistochemistry 98 3.3.3.3 The activity of mitochondrial enzymes in corresponding plaques and
NAWM pairs 102
3.3.3.4 Somatic mtDNA deletions 102
3.3.3.5 mRNA expression for anti-oxidants, pro and anti-apoptotic molecules in plaques 109 3.4 DISCUSSION: INVOLVEMENT OF MITOCHONDRIAL MOLECULES IN MS 112 3.4.1 mtDNA mutations, polymorphisms and haplotypes in MS, PON and NMO 112 3.4.1.1 Screening for mtDNA mutations in MS 112 3.4.1.2. Screening for mtDNA mutations in PON 113 3.4.1.3 Comprehensive sequence analyses of mtDNA in MS and NMO 114 3.4.1.4 Restriction site polymorphism and haplotype analyses in MS 116
3.4.2 Complex I variants in MS 117
3.4.3. Oxidative damage to mitochondrial macromolecules, Complex I impairment, somatic mtDNA deletions and expression of pro- and anti-apoptotic molecules 119 3.4.3.1 Oxidative damage to mtDNA, impairment of Complex I and somatic mtDNA deletions in chronic
active plaques 119
3.4.3.2 Bcl-2 and its homologues in the brains of patients with MS 122 4. CONCLUSIONS: THE ROLE OF MITOCHONDRIA IN NEURODEGENERATION DEVELOPING
SECONDARY TO INFLAMMATION IN MS 123
4.1 Mitochondria 123
4.2 A proposed role of mitochondria in inflammation induced neurodegeneration 127
4.3 The involvement of Complex I in MS 128
4.4 Summary of conclusions 129
Acknowledgments 131
Grant supports 132
Abbreviations 133
References 135
Preface
I would like to acknowledge those extraordinary people who cannot be all named in the
Acknowledgement section, but whose knowledge, support and kindness shaped my life during early development, training and works. I was very fortunate receiving my education from the pre-school level to the residency training and even beyond in their environment. Education in both natural and human sciences was very comprehensive and thorough in Hungary. However, what I recognize now even with a greater appreciation is the ubiquitous expression of an exceptional quality: the academic spirit of many of my teachers, senior colleagues and my parents, who possessed the intrinsic drive for
delivering and expecting much more than that set in the regular curriculum, the trait of novelty seeking, and the ability of generating in their mysterious ways the conditions for the “beyond of average” without ample resources. My parents not only supported my ordinary education for over two decades, but generously also provided the opportunity of a long lasting music training, language courses and early trips within Europe. In my medical school, we were encouraged to become “physician-scientists” long before the term was introduced. We got the opportunity of experimenting in fields where a discovery had just happened, and translation of scientific results into practice was exemplified. During residency, we regularly heard about the works of world famous neurologists, and on a smaller scale, we were expected to try something similar. I feel greatly privileged being raised in this remarkable spirit
generated by these exceptional people. It was this spirit that made possible for me to proceed later on my own in a competitive international environment. I most gratefully also recognize that everything was provided with the only expectation that I will use this generous investment well in my life.
1. INTRODUCTION
While specific causes of multiple sclerosis (MS) remain uncertain, an interaction between environmental and genetic factors has been implicated in pathogenesis leading to inflammation, demyelination and neurodegeneration in the central nervous system (CNS). Genetic determination of this process is supported by epidemiological studies in ethnic groups, families, twins, half sibs and conjugate pairs (1). The risk for monozygotic twins is 300-times, and for first-degree relatives 20-50- times higher than for an individual in the general population of Northern-European origin with a prevalence rate of 0.1. The observed transmission patterns are not compatible with an autosomal dominant, recessive or X-linked inheritance. MS is a complex trait disorder, defined by several genes, each exerting small effect, and in an interaction with the environment (2-14). Phenotypic expressions of MS suggest the involvement of complex mechanisms with features of autoimmunity and
neurodegeneration (15-22). The currently approved disease modifying drugs primarily target the inflammatory components, while exert limited effect on neurodegeneration in MS. We chose using molecular and genetic approaches to better understand disease pathogenesis and to identify new targets for therapy.
1.1 THE MS PHENOTYPE 1.1.1 Terminology and definition
The definitions of clinical, pathological and molecular phenotypes and ascertainment of patients are the foundation of conducting translational studies. Relapsing-remitting (RR), secondary progressive (SP), primary progressive (PP) and progressive-relapsing courses (PR) of MS have been clinically
distinguished (23). While this empirical classification is currently under revision to include additional subtypes, the existence of the four courses is supported by natural history studies. The majority, 80- 85% of patients have a RR onset with a substantial proportion converting into SP-MS over time. The remaining patients present with PP-MS characterized by a later onset, less female predominance and a more rapid deterioration (24). The median times from disease onset to reaching an extended disability status scale score (EDSS) 4, 6 and 7 are longer in RR than in PP disease, but the time to reaching EDSS 6 from EDSS 4 is similar in the SP and PP-MS groups (25). These observations suggest that the rates of accumulating irreversible tissue pathology are different in RR and PP-MS, but the progressive phases of SP and PP-MS are similar (25-26). Comparisons of long term outcomes suggest that
patients with relapsing-progressive (RP)-course can be reassigned either to SP or PP-MS, and patients with PR-course can be reassigned to PP-MS (27). Therefore, our studies distinguish RR, SP and PP forms of clinically definite MS, and use the diagnostic criteria of Poser et al (28), McDonald et al (29) and Thompson et al (30).
1.1.2 Features of autoimmunity in MS
Common features of MS and other autoimmune conditions include a higher incidence in women, a peak of onset in the third and fourth decades of life, a common relapsing-remitting initial presentation with subsequent progressive deterioration, and a beneficial influence of pregnancy but a transiently adverse effect of puerperium (16,31). Corticosteroids and immunosuppressive drugs are at least partially effective. The presence of immune cells and immunoglobulins against autoantigens in the target organ can be demonstrated. Distinct alleles of the Human Leukocyte Antigen (HLA) genes and an overlapping set of non-HLA genes define a genetic constitution called autoimmune trait (16,32).
The existence of this autoimmune trait is supported by the increased occurrence of autoimmunity (8.4%), MS (6.2%) or both (0.8%) in first degree relatives of MS patients (31,33-36). An intra-individual recurrence of autoimmunity is also noted in MS, but it is even more prominently in neuromyelitis optica (NMO) or Devic’s disease (37-40). The risk of non-specific autoimmunity for siblings of MS probands is estimated to be λs=1.65 and the risk of MS is estimated to be λs=2 (31,41) (λs is the relative risk score for siblings and is defined as the ratio of recurrence risk of the disease in siblings of probands to the prevalence of that disease in the general population).
Comparative analyses of genome scans reveal that 65% of the positive non-HLA linkage data fall into 18 clusters of overlapping autoimmune diseases (18). Both linkage and candidate gene studies confirm the existence of shared regions of susceptibility in MS and Insulin Dependent Diabetes Mellitus,
rheumatoid arthritis, systemic lupus erythematosus (SLE), inflammatory bowel disease and ankylosing spondylitis (42-44). Chromosome 17q11 including the β-chemokine region represents one of the susceptibility loci identified in more than one autoimmune disease (45,46). To further define
inflammatory regulators of MS pathogenesis, our studies investigate the β-chemokine cluster in 17q11 (Section 2).
1.1.3 Neurodegeneration in MS
Although neurodegeneration accumulates from the earliest stages and dominates pathological features of some forms of MS, its mechanism and relationship with autoimmunity, inflammation and
demyelination is only partially understood. The temporal sequence of inflammation, demyelination and tissue degeneration has been described by magnetic resonance imaging (MRI) and pathological studies (17,47). The breakdown of blood brain barrier (BBB), reflected by the extravasation of gadolinium, represents an early event in lesion development (48). Serial magnetization transfer ratio (MTR) and imaging (MTI) studies, however, detect subtle structural changes reflecting edema, inflammation and degeneration even prior to the occurrence of lesions on contrast enhanced T1 and
T2-weighed MRI in the normal appearing white matter (NAWM) (49-51). Magnetic resonance
spectroscopy (MRS) shows decreased values of N-acetyl aspartate (NAA) suggestive of axonal and neuronal degeneration in chronic plaques, but to some degrees also in the NAWM and normal
appearing gray matter (NAGM) (52-53). Evaluations of clinical measures, MRI and MRS data establish that axonal degeneration and CNS atrophy are the major pathological correlate of disability (53-54).
Histological determinants of plaques include perivenular and parenchymal inflammation, demyelination, axonal loss and astrogliosis (52). Four patterns of demyelinating lesions with intra-individual
homogeneity and inter-individual heterogeneity were proposed (19), although not universally accepted (55). Pattern I is characterized by T cell and macrophage infiltration, whereas pattern II has an
additional IgG plus complement contribution to myelin destruction. Both patterns III and IV appear to be oligodendrocytopathy rather than autoimmunity. In pattern III, oligodendrocyte apoptosis occurs at the active plaque border with a paucity of oligodendrocytes in the inactive center. These lesions share histological (“dying back” oligodendrocytopathy) and molecular (expression of HIF1α and Hsp70) similarities with those of ischemic brain injury. In pattern IV, a non-apoptotic oligodendrocyte death is seen adjacent to the zone of demyelination associated with a lack of remyelination. While the distinction among the four patterns may be debated, the existence of a histopathological heterogeneity modulated by individually distinct genetic constellations is uniformly accepted by pathologists (19,55).
In addition to oligodendrocyte depletion, axonal loss develops in and outside of plaques (56). While activated inflammatory cells consistently co-localize with axonal impairment (56), this degenerative process does not always correlate with the demyelinating activity, suggesting that inflammatory cell products can directly impair axons (57). Immune mediated cytotoxicity, apoptosis and necrosis, glutamate-induced neurotoxicity and insufficient trophic support are only partially responsible for the observed loss of oligodendrocytes and neurons (47-59,60-62). Our works add to existing data a mitochondrial component of neurodegeneration associated with immune activation and inflammation (Section 3).
1.1.4 Current concepts of immune mediated demyelination and neurodegeneration
The pathogenesis of MS is generally (although not unambiguously) attributed to the activation of mononuclear cells (MNCs) in the peripheral immune system and their migration via the BBB (55,63). If MNCs (T and B lymphocytes, monocytes, macrophages) encounter further activation signals in the CNS, they may contribute to demyelination and tissue degeneration either by direct cell-cell interactions or by their soluble inflammatory products. Blood-derived CSF and
CNS immune cells include CD8+ and CD4+ T lymphocytes, memory B lymphocytes and plasma blasts, monocytes / macrophages and dendritic cells in MS. There is an abnormal proportion of both regulatory (e.g. CD4+ CD25+ FOXP3+ nTreg, CD4+ TH-2) and effector (e.g. CD4+ TH-1 / TH-17, CD8+CD45RA+CD27-) T cell populations. CD4 and CD8 T lymphocytes and B
lymphocytes specific for a broad range of CNS antigens have increased frequency and clonal expansion in the CSF and CNS, and have been implicated in the disease development (63).
The main part of Figure 1 shows in a simplified manner those cellular and molecular elements of the immune and neurodegenerative MS pathways, which are relevant to the present study. Some molecular details are depicted in the inserts. When the antigen specific receptor of a CD4 or CD8 T lymphocyte (TCR) recognizes its antigenic determinant presented by the major histocompatibility (MHC) Class II or Class I molecule, respectively, on an antigen presenting cell (APC), and this interaction is complemented by an engagement between a necessary set of costimulatory molecules and their receptors, the T cell will undergo activation (Insert 1: Events in the peripheral immune
system). We comprehensively studied elements of the trimolecular complex (MHC II – antigenic peptide – TCR) in both MS and its animal model (Ph.D. thesis). Activated T cells express adhesion molecules facilitating their rolling, adherence and transmigration via the endothelial (E) cell, basal membrane (BM) and matrix layers of the BBB. Chemokines produced in the CNS exert chemotactic signals and facilitate cell trafficking. In addition, the binding of chemokine ligands to their receptors on T lymphocytes
triggers intracellular signaling that increases the adhesion between VLA4 - VCAM1 at the BBB. The LFA1 – ICAM1 interaction is also essential for lymphocytes traversing the BBB. The break-down of the BM is facilitated by the production of matrix metalloproteases (MMPs) by activated T lymphocytes (Insert 2: Interactions at the BBB). If a T cell recognizes its specific antigenic determinant, then it will further be activated and retained in the CNS. T cells with pathogenic potential predominantly express T helper (TH)-1 (characterized by interferon-γ, interleukin-2 and tumor necrosis factor α/β production) and TH-17 phenotypes (characterized by IL-17 production; the involvement of this subset is established in EAE but still being investigated in MS) which may exert cytotoxic activity on myelin and
oligodendrocytes. Inflammatory products of these lymphocytes and the co-migrating macrophages in concert with the activated residential microglia and astroglia release cytotoxic cytokines, reactive oxygen species (ROS) and nitric oxide (NO). Immunoglobulins and complement as well as glutamate may also contribute to the cytotoxic process leading to myelin loss, oligodendrocyte apoptosis, axonal transection and neuronal degeneration (Insert 3: Cytotoxicity in the CNS) (15-16,60-64).
Figure 1. Immune mediated demyelination and neurodegeneration
See explanation for Figure 1 in section 1.1.4.
1.2 GENETICS OF MS
Different approaches have been used to study genetic susceptibility in MS. In classical case-control designs, candidate genes are selected based on a perceived concept of disease pathogenesis (Figure 1), and the frequency of alleles in these polymorphic candidate genes are compared in the groups of patients and matched controls. Despite the hypothesis driven nature (e.g. genes of immune regulation and myelin production are involved) and the technical pitfalls (e.g. the selection of proper controls), case – control studies have greatly contributed to the current state of MS genetics and established that the MHC DR15, DQ6, Dw2, or in current sequence based terminology the DRB1*1501, DQA1*0102, DQB1*0602 haplotype, has the strongest and most consistent association with MS in Caucasians (1,37,65,66). The importance of the DR15 subtype was underscored in our own study of DR2 positive Hungarian and Gypsy patients and controls (37,66,67).
The method of linkage is free of preconceived assumptions regarding disease pathogenesis, and investigates segregation of susceptibility markers with the disease in a cohort of families. Four comprehensive genome scans in sibpair and multiplex families show linkage to multiple susceptibility loci, each with a minor effect (λs=/<2) compatible with a complex trait of MS (41,68-70). Among several reported provisional sites, the 6p21, 5p15 - 5q13, 17q22 and 19q13 loci are consistently identified (41,68-71). Our follow up linkage studies replicates these findings and further refine loci of interest in large numbers of families (72, my studies in Oxford, not detailed here). A meta-analysis of combined, raw genotype data of three genome scans confirms the importance of 17q11 and 6p21 (73). Within the identified susceptibility regions, candidate genes involved in immune regulation (e.g. 6p21 – MHC cluster; 17q11 – β-chemokine cluster; 17q22 - PRKCA) or neurodegeneration are located (e.g. the ApoE4 allele of ApoE gene at 19q13) (74-78). Consistent with the case-control data, microsatellite based linkage studies detect the highest lod scores in the MHC region on 6p21 (41,69). MHC is estimated to account for 15-65% of genetic susceptibility in MS (77,78). There are more uncertainties regarding the identity of non-MHC genetic determinants.
While the method of linkage successfully identified major susceptibility loci, it does not have the power to further confine these large (often ranging 2-20 cM, approximately 2-20 MB) susceptibility loci to single genes in MS. Theoretical considerations and experimental data suggest that methods of
association are more suitable for the identification of genes with small effects and the restriction of large susceptibility loci to small chromosomal segments (41,68-71,79). Observations from the Human
Genome and HapMap projects made possible the identification of the means of association studies in families used by the author of this dissertation (Figure 2). The Human Genome Project reveals that
there is a sequence variation, so called single nucleotide polymorphism (SNP), at approximately every 1000 nucleotide. SNPs align in haplotypes that tend to be inherited together as chromosomal blocks in the population. SNP variants and haplotypes define not only inter-individual phenotypic differences but also differences in susceptibility to common diseases. The term linkage disequilibrium (LD) describes the correlation of marker alleles in haplotypes more often than expected by chance in a population. LD depends on many factors including inter-marker distances, marker allele frequency, local structure and sequence composition of a chromosome and most importantly, the history of a given population (80).
The theoretical background to LD mapping (used in this study) is schematically illustrated in Figure 2. In brief, this method is basen on the concept that any SNP marker or haplotype found in association with the disease could be an indicator of a disease-relevant mutation in the proximity due to LD between that SNP marker or the disease-relevant mutation (80).
Therefore, the search for candidate genes in susceptibility loci previously identified by linkage studies may involve a three-phase strategy using LD mapping. In the first and second phases, we identify and then confirm in the selected region the disease-associated SNPs and haplotypes on which, or close to which, disease relevant mutations likely arose. In the third phase, we seek for the disease-relavant mutations or variants by sequencing these particular haplotypes and their flanking regions. General information regarding the distribution and population characteristics of SNPs, haplotypes and LD maps are publicly available (http://www.ncbi.nlm.nih.gov/SNP/index.html and http://www.hapmap.org). The necessary density of SNP markers in an association study based on LD scanning is discussed in Figure 2. The HapMap data base also assists us selecting tagging SNP markers for an initial determination of disease associated haplotypes, which then may be followed by a more restricted search for disease specific variants.
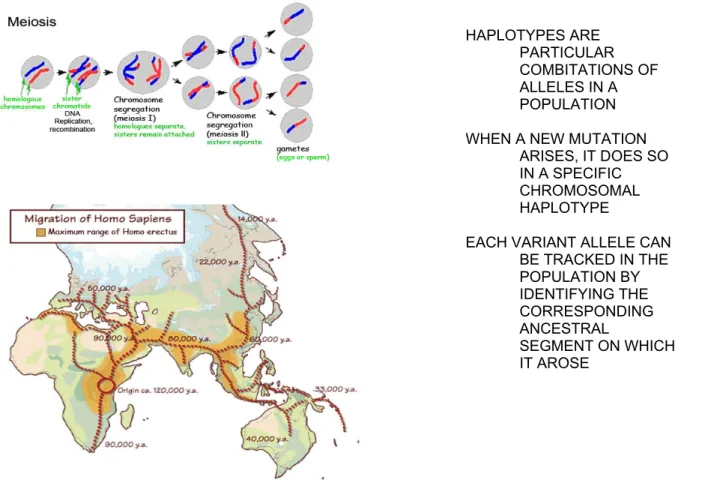
Figure 2. Theoretical considerations to linkage disequilibrium mapping
A fertilized oocyte undergoes divisions called meiosis (left upper part of Figure 2). During meiosis, an exchange between the maternal and paternal chromosomal materials occurs, called recombination. The longer the meiotic history (or the higher the number of subsequent generations), the more recombinations occurred in a given population. The more recombinations lead to smaller chromosomal blocks (haplotypes) inherited together in that population. In other words, older populations generally have shorted LD blocks than younger populations. Homo Sapiens arose approximately 120,000 years ago in East – Central Africa (left lower part of Figure 2). Over time, small subgroups continuously migrated out of Africa (evolutionary bottle neck) and populated the Middle East, Asia, Australia and Europe. The ancestors of today Europeans settled 50,000 years ago. Giving 25 years to each generation, East-Central Africans had approximately 4800 subsequent generations, while Europeans had
approximately 2000 generations. Thus, the number of recombination events in the African chromosomal population was much higher than that in the European chromosomal population resulting in shorter haplotypes (LD) in Africans than in Europeans. The out-of-Africa hypothesis of the Homo Sapiens history was initially
suggested by anthropological and linguistic studies, and is recently confirmed by molecular DNA analyses. These genetic studies define that half of the bi-marker haplotypes are 22 kb or larger in African (Yoruban) and African- American populations, while half of the bi-marker haplotype blocks are 44 kb or larger in Asian and European populations, in correlation with the corresponding meiotic history of each population (80). This information guide us defining the density of SNP markers required for LD mapping in our studies identifying the disease associated haplotype(s) in MS families.
HAPLOTYPES ARE PARTICULAR COMBITATIONS OF ALLELES IN A POPULATION WHEN A NEW MUTATION
ARISES, IT DOES SO IN A SPECIFIC CHROMOSOMAL HAPLOTYPE
EACH VARIANT ALLELE CAN BE TRACKED IN THE POPULATION BY IDENTIFYING THE CORRESPONDING ANCESTRAL
SEGMENT ON WHICH IT AROSE
Here we present our studies on candidate genes involved in autoimmunity and neurodegeneration in MS. In addition to functional considerations, the selection of genes was guided by the results of linkage analyses. From the previously defined susceptibility loci, we chose to study genetic variants of CC chemokine ligands (mediators of inflammation, Section 2) and of Complex I (a likely player in neurodegeneration, Section 3). In the conclusion of studies (Section 4), we propose a role for mitochondrial molecules in contributing to neurodegeneration associated with inflammation. The integration of our genetic and functional data into a mechanistic concept extends existing observations on MS pathogenesis and reveals new potential targets for therapy (1,16,17,37,81-84).
1.3 OBJECTIVES OF THE STUDIES
Curing or preventing MS remains elusive until its etiology and pathogenesis are better
understood. We hypothesize that 1) genetic variants in key determinants of inflammation and neurodegeneration confer susceptibility to MS; 2) CCLs play important roles in controlling inflammation; and 3) mitochondrial mechanisms are involved in the final pathway of
neurodegeneration associated with inflammation. We apply genetic, molecular and biochemical methods to identify and characterize novel candidate molecules that may play important roles in the pathogenesis of MS.
The main goals of our studies are to identify genetic determinants of CCLs that may be important in inflammation, and to define mitochondrial molecules and mechanisms that are involved in neurodegeneration developing secondary to inflammation.
Specifically, we
1. Search for new candidate genes within susceptibility loci defined by linkage analyses. Even though the function of these candidate genes has been taken into consideration (inflammatory candidates including CCLs and neurodegenerative candidates including Complex I), a selection of genes from linkage defined susceptibility loci is less prone to biases (as linkage is a priori free of preconceived assumptions regarding the disease pathogenesis) than a mere selection of candidate molecules based on existing hypotheses of pathogenesis.
2. Apply methods more powerful than linkage in complex traits. The method of linkage has been successful in identifying disease causing genes in Mendelian disorders and in defining
susceptibility loci in complex trait disorders. However, in the latter case, linkage as a method reached its limits and has no power to further confine the large susceptibility loci to specific
genes. For identifying candidate genes within linkage defined susceptibility loci of MS, we used the method of LD mapping and sequencing.
3. Define the expression distribution and function of genes identified in our genetic studies. A differential expression distribution and functional involvement of gene products in plaques, NAWM and NAGM may further confirm the relevance of these molecules in the disease development.
4. Form a new mechanistic view based on our observations and expand previously developed concepts of MS. The outcomes of our studies in two major groups of candidate genes and their products (CCL and Complex I) contribute to a concept linking at molecular level the immune inflammatory process to neurodegeneration in MS.
5. Reveal potentially new targets for therapy. Both the upstream part of our studies concerning a group of small inflammatory mediators (β-chemokines), and the downstream part concerning mitochondrial molecules and mechanisms involved in neurodegeneration, present new targets for the treatment of MS.
2. THE ROLE OF CC CHEMOKINES IN INFLAMMATORY DEMYELINATION (62,82-84) 2.1 BACKGROUND
As the interactions between β-chemokine ligands and their receptors play central roles in the recruitment and retention of inflammatory cells in the CNS, both these ligands and their receptors represent potential therapeutic targets in MS. Chemokines are small, evolutionarily related
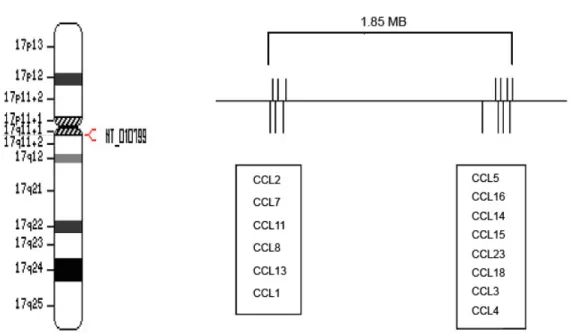
chemoattractant molecules regulating cell trafficking through interactions with their receptors (85). The approximately 50 known human chemokine genes are divided into four subfamilies based on distinct patterns of cysteine residues close to the N-terminal end of the products. The CC chemokine ligand family (CCL) (also called β-chemokines or Small Cytokine Group A-SCYA) is characterized by two adjacent cysteines, while the CXC (SCYB) and CX3C (SCYD or fractalkine) chemokine families have one or three intervening amino acids, respectively, between the two cysteines. In the XC family (SCYC or lymphotactin), only one cysteine is present (85). Fourteen of the 27 human CC chemokines including CCL2, CCL7, CCL11, CCL8, CCL13, CCL1, CCL5, CCL16, CCL14, CCL15, CCL23, CCL18, CCL3 and CCL4, respectively, are encoded within 17q11 (Figure 3).
Figure 3. Chromosome 17q11
This figure demonstrates the position of the CCL cluster in 17q11 (left side). The enlarged CCL region (right side) shows the distribution of individual genes in two subclusters within a 1.85MB region. The distance between CCL1 and CCL5 is 1.5 MB.
While CC chemokine receptors (CCRs) generally bind multiple chemokine ligands and vice versa, the most efficient interaction may occur between a single receptor and its primary ligand (e.g. CCL2 – CCR2). CCRs are G-protein coupled receptors with seven-transmembrane-domains. A high affinity interaction between CCL-CCR molecules leads to signal transduction initiated by the dissociation of G- protein complex into Gα and Gβγ subunits. Gα induces the activation of the phosphoinositidine 3- kinase pathway, while the Gβγ subunits activate phospholipase C and induce Ca2+ influx and protein kinase C activation. Ten CC chemokine receptors (CCRs), 6 CXCRs, one CX3CR1 and one XCR1 are currently known (85-86).
The transmigration of autoreactive immune cells via the BBB is an early and critical process in EAE and MS, and is regulated by CC chemokines produced at the BBB and in the CNS. Subcellular signals induced by a specific CCL-CCR engagement lead to an increased avidity of integrins (VLA4) on leukocytes to their receptors (VCAM1) on endothelial cells, followed by a facilitated migration of
leukocytes towards the chemokine gradient in the CNS (87-88). In addition, chemokines are involved in the regulation of T cell differentiation, apoptosis, cell cycle, angiogenesis and metastatic processes as well as of the generation of soluble inflammatory products (85,89). The differential effects of various
chemokines on TH1, Th17 and TH2 polarization may also be significant in the development of inflammatory demyelination.
A meta-analysis of three MS genome scans detected the highest NPL score= 2.58 at 17q11 (73). While numerous candidate genes are located in this region (e.g. NOS2A, OMG, NF1), a 1.85 MB segment at 17q11.2-q12 encodes a cluster of β-chemokines (Figure 3). Two quantitative trait loci (QTL) in EAE, eae6 and eae7, were mapped to a region of mouse chromosome 11 synthenic to human 17q11. Eae6 and eae7 influence severity and duration of, while eae7 also confers susceptibility to EAE (90). Fine mapping revealed two adjacent QTLs, eae18a and eae18b, on the rat chromosome 10 in a chronic relapsing form of EAE (91). eae18b is orthologous to the human 17q11 region and encodes β- chemokine genes.
The recognition of the β-chemokine gene region as susceptibility and quantitative trait locus in EAE, the human data revealing 17q11 as a susceptibility locus in MS, and the well defined immune regulatory functions of these gene products strongly suggests the involvement of β-chemokine variants in the development of inflammatory demyelination.
2.2 PATIENTS AND METHODS
2.2.1 Studies on 17q11: phase I - LD mapping Patients, families and DNA specimens
DNA specimens from families with various structures were obtained from the Multiple Sclerosis DNA Bank (MSDB), University of California San Francisco, San Francisco (UCSF), CA, the collection of the Canadian Multiple Sclerosis Collaborative Group (CMSCG) (Dr. Ebers) and the Multiple Sclerosis Treatment and Research Center (MSTRC), Minneapolis, MN (Dr. Birnbaum) (Table 1). Human subjects were studied in this and all the following sections in compliance with the rules of US Human Subject Protection Programs (IRB and HIPAA). The diagnosis of MS for patients whose DNA specimens were obtained from existing collections (MSDB, CMSCG) was made by the Poser criteria (28). Patients whose specimens were prospectively collected for this study were diagnosed using the McDonald’s criteria (29). The diagnosis of PP-MS was established if sustained progression of disability was observed for at least one year in the absence of relapses (30). If one or more relapses occurred superimposed on a progressive course from onset, PR-MS was diagnosed.
To test if the inclusion of patients with PP-MS caused any bias in the outcome, in a subanalysis we removed all PP-MS nuclear families and trios from the total DS101-115 dataset. The majority (over
94%) of patients in DS101-104, DS106-108, DS109-112 and DS113-114 has RR / SP-MS. DS105 and DS115 are exclusively composed of PP-MS trios and PP-MS incomplete families. Patients with PR-MS were assigned to the PP-MS group (27). There were 47 PP-MS trios and incomplete families, and 217 RR/SP-MS families in the stratified analyses (trios, affected sib pair and multiplex families).
Table 1. Families in DS101-115
Dataset Total families Individuals Trio ASP Incomplete Multiplex Origin DS101-105 66 365 7 34 10 15 MSDB, UCSF DS106-108 66 198 66 0 0 0 MSDB, UCSF DS109-112 50 300 0 39 0 11 CMSCG DS113-114 58 174 42 0 16 0 MSDB, UCSF DS115 17 48 2 0 15 0 MSTRC Total 257 1085 117 73 41 26
Specimens of North-American Caucasian MS patients and their families were obtained in five shipments (DS101- 105, DS106-108, DS109-112, DS113-114 and DS115) from two existing DNA collections of the UCSF based MS DNA Bank (MSDB) and the London, ON based collection of the Canadian MS Collaborative Group (CMSCG), and from a prospective collection of the MS Treatment and Research Center (MSTRC), Minneapolis, MN.
DS101, DS102 … DS115 represent subsets of specimens in separate 96 well plates. All specimens were similarly genotyped and the analyses of combined data from 257 families are presented below. Definitions: ASP=affected sib pair family: two or more affected and one or more unaffected children with their unaffected parents; trio: an affected child with unaffected parents; incomplete family: an affected individual with one unaffected parent and / or an unaffected sibling; multiplex family: multiple affected and unaffected family members in two or three generations.
Genotyping
We contracted ACGT, Inc (Northbrook, IL), a biotech company that uses the 5’ Nuclease (or TaqMan) assay for allelic discrimination of SNPs with high sensitivity and specificity on an ABI7900HT Instrument (ABI PE Inc, Foster City, CA). PCR amplification of the template DNA was performed with unlabeled forward and reverse primers in the presence of a specific TaqMan probe with a non-fluorescent quencher plus a minor groove binder attached to the 3’ end, and a reporter fluorescent label (Fam or Vic) attached to the 5’ end. A fully hybridized probe remained bound during strand displacement, and resulted in efficient cleavage of the reporter dye by the 5’ nuclease activity of TaqGold DNA
polymerase. Each reaction mixture contained two probes having a single nucleotide difference and
Fam or Vic labels. The release of the reporter dyes correlated with the fraction of the matching alleles.
The genotyping error rate with this method was <0.5%.
SNPs
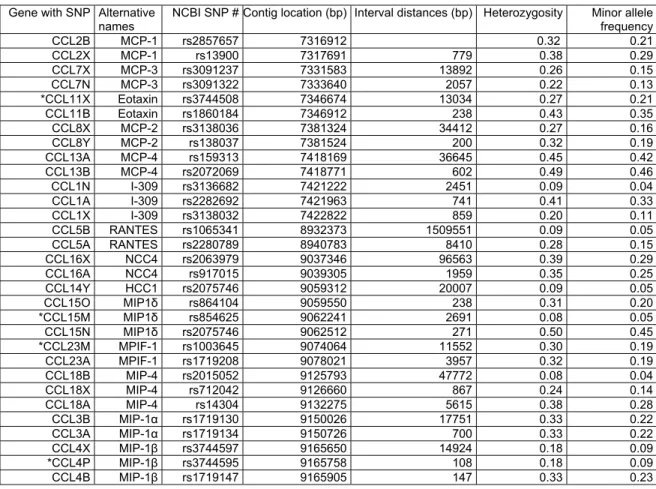
Table 2. SNPs genotyped (Contig NT010799, chromosome 17q11.2-q12.)
Gene with SNP Alternative names
NCBI SNP # Contig location (bp) Interval distances (bp) Heterozygosity Minor allele frequency CCL2B MCP-1 rs2857657 7316912 0.32 0.21 CCL2X MCP-1 rs13900 7317691 779 0.38 0.29 CCL7X MCP-3 rs3091237 7331583 13892 0.26 0.15 CCL7N MCP-3 rs3091322 7333640 2057 0.22 0.13
*CCL11X Eotaxin rs3744508 7346674 13034 0.27 0.21 CCL11B Eotaxin rs1860184 7346912 238 0.43 0.35 CCL8X MCP-2 rs3138036 7381324 34412 0.27 0.16 CCL8Y MCP-2 rs138037 7381524 200 0.32 0.19 CCL13A MCP-4 rs159313 7418169 36645 0.45 0.42 CCL13B MCP-4 rs2072069 7418771 602 0.49 0.46 CCL1N I-309 rs3136682 7421222 2451 0.09 0.04 CCL1A I-309 rs2282692 7421963 741 0.41 0.33 CCL1X I-309 rs3138032 7422822 859 0.20 0.11 CCL5B RANTES rs1065341 8932373 1509551 0.09 0.05 CCL5A RANTES rs2280789 8940783 8410 0.28 0.15 CCL16X NCC4 rs2063979 9037346 96563 0.39 0.29 CCL16A NCC4 rs917015 9039305 1959 0.35 0.25 CCL14Y HCC1 rs2075746 9059312 20007 0.09 0.05 CCL15O MIP1δ rs864104 9059550 238 0.31 0.20
*CCL15M MIP1δ rs854625 9062241 2691 0.08 0.05 CCL15N MIP1δ rs2075746 9062512 271 0.50 0.45
*CCL23M MPIF-1 rs1003645 9074064 11552 0.30 0.19 CCL23A MPIF-1 rs1719208 9078021 3957 0.32 0.19 CCL18B MIP-4 rs2015052 9125793 47772 0.08 0.04 CCL18X MIP-4 rs712042 9126660 867 0.24 0.14 CCL18A MIP-4 rs14304 9132275 5615 0.38 0.28 CCL3B MIP-1α rs1719130 9150026 17751 0.33 0.22 CCL3A MIP-1α rs1719134 9150726 700 0.33 0.22 CCL4X MIP-1β rs3744597 9165650 14924 0.18 0.09
*CCL4P MIP-1β rs3744595 9165758 108 0.18 0.09 CCL4B MIP-1β rs1719147 9165905 147 0.33 0.23
Table 2 shows the experimental designation of SNPs in β-chemokine genes using the current terminology (CCL2, etc…) and alternative names (MCP-1, etc…), the NCBI Rs numbers, contig positions, inter-marker distances, heterozygosity and minor allele frequency of SNPs. SNPs are indicated with a letter attached to the gene name (e.g. CCL2B). Nonsynonymous SNPs (CCL11X, CCL15M, CCL23M and CCL4P) are labeled with “*”.
Abbreviations for the alternative β-chemokine names: MCP-1: monocyte chemotactic protein-1; MCP-3: monocyte chemotactic protein-3; Eotaxin: eosinophil chemotactic protein; MCP-2: monocyte chemotactic protein-2; MCP-4:
monocyte chemotactic protein-4; I-309: inflammatory protein homologous to mouse TCA-3; RANTES: Regulated upon Activation, Normally T Expressed, and Presumably Secreted; NCC4: homologous to mouse macrophage inflammatory protein-1; HCC1: enhance proliferation of CD34 stem cells and share homology with the mouse MIP-1α and MIP-1β; MPIF-1: myeloid progenitor inhibitory factor -1; MIP-4: macrophage inflammatory protein-4;
MIP-1α: macrophage inflammatory protein-1α; MIP-1 β: macrophage inflammatory protein-1β.
Nonsynonymous, untranslated region and intronic SNPs within CCL genes were selected from the NCBI database (http://www.ncbi.nlm.nih.gov/SNP). We intended to have at least 2 SNPs per gene and all nonsynonymous SNPs listed in the database as of November 2002, when the study was initiated.
Thirty-one assays were successfully developed, validated and genotyped in DS101-105, DS106-108, DS109-112. In DS113-14 and DS115, data only from 27 assays were obtained as assays of CCL2B, CCL7N, CCL11X and CCL15M SNPs were not included. Table 2 summarizes the list of included SNPs and their characteristics.
Analyses -Files
Mendelian inconsistencies were screened by Pedcheck and genotyping errors were manually corrected or deleted dependent on the reliability of information obtained from the scatter plot distribution and relative intensity of fluorescent signals. Allele and genotype frequencies were calculated for 356 unrelated parents in DS101-115. Deviation from the Hardy-Weinberg equilibrium (HWE) was tested by using the χ2-statistics in MERLIN (Multipoint Engine for Rapid Likelihood Inference,
http://www.sph.umich.edu/csg/abecasis/Merlin/) (92).
-Power estimate
Different methods have been used to estimate the required sample size (N) in the TDT / PDT, taking into consideration varying estimates of the genotypic risk ratio (λs=1.5 - 4), allele frequency (p=0.01 - 0.80), and proportion of heterozygous parents (0.025 - 0.500), and different modes of inheritance (multiplicative, additive, recessive or dominant). Based on four methods of power assessment in the TDT of one candidate SNP, a sample size of 53 to 55 is required for λs=2, and a sample size of 192 to 195 is required for λs=1.5 to achieve 80% power, when assuming a disease-predisposing allele
frequency of 0.1 and a multiplicative model (79,93-94). Therefore N=257 in MS appears to be a
reasonable sample size in a TDT or PDT based analysis of SNPs in candidate genes with an expected range of λs= 1.5 - 2 (41,95).
-PDT
We chose to use the pedigree disequilibrium test (PDT), developed from the classical transmission disequilibrium test (TDT), to determine if a marker locus and the hypothetical disease locus are linked or are in linkage disequilibrium (95-96). Under Mendelian inheritance, all alleles have a 50% chance of being transmitted to offspring by the parents. An allele may be associated with the disease risk, if it is
transmitted more often than 50% of the time, indicating a transmission distortion. PDT can utilize data from trios, nuclear families and discordant sibships within extended pedigrees.
-TRANSMIT
Haplotype-based analyses were conducted using the TRANSMIT version 2.5 program (http://www- gene.cimr.cam.ac.uk/clayton/software/) (97). This program tests for association between genetic markers and disease by examining the transmission of markers and haplotypes from parents to affected offspring. TRANSMIT can analyze multilocus haplotypes, even if phase is unknown and parental haplotypes are missing. The tests are based on a score vector which is averaged over all possible configurations of parental haplotypes and transmissions consistent with the observed data.
Data from unaffected siblings may be used to restrict the number of possible parental genotypes to be considered. When transmission is fully observed, this test is similar to the Pearson χ2 -test. The program calculates the following χ2-statistics: 1) For each haplotype or allele, a test for excess transmission of that haplotype; and 2) a global test for association (H-1 df, where H is the number of haplotypes for which transmission data are available). In brief, TRANSMIT v. 2.5 estimates the
maximum log-likelihood of haplotype probabilities of paired marker alleles. The haplotype-based score test evaluates the difference in the observed and expected transmission of each possible haplotype from parents to affected children by using the χ2 statistics. We performed the bootstrap significance test using 10,000 bootstrap samples of haplotypes.
-Ldmax
Ldmax in the GOLD program provides maximum likelihood estimates of pair-wise disequilibrium (http://www.sph.umich.edu/csg/abecasis/GOLD/docs/stats.html) by using the Slatkin and Excoffier implementation of the expectation-maximization algorithm (98-99). SNP alleles were taken from unrelated parents in 356 unrelated parents in DS101-115 to assess haplotype frequencies.
Computation of the δ2, D and D’ values can be found at the web site. In brief, pair-wiseLD can be estimated asD = x11 -p1q1, where x11 isthe frequency of haplotypeA1B1, and p1 andq1 are the
frequenciesof alleles A1 andB1 at loci Aand B, respectively. Astandardized LD coefficient, δ,is defined by D/(p1p2q1q2)1/2,where p2 and q2are the frequencies ofthe other alleles atloci A and B,respectively.
D’is given by D’= D/Dmax, where Dmax= min(p1q2,p2q1) when D <0 or Dmax = min(p1q1,p2q2)when D > 0.
The χ2 statistics for a contingency table is also generated to calculate significance from an asymptotic distribution with (r-1)(c-1) degrees of freedom, where r and c are the count of alleles for the pair of markers being considered. The statistics and p-values, as well as δ2 and D’ values, where D’ ranges between 0 and 1 (greater values indicating stronger LD), are included in the output file (100).
-Computation
PDT, TRANSMIT vs 2.5, MERLIN and the GOLD program were run in Unix and Linux based computational environments at the AMDeC Bioinformatics Core Facility at the Columbia University.
2.2.2 Studies on 17q11: phase II - LD mapping Patients, families and DNA
Specimens of DS116-132 (Table 3) were obtained from sources (UCSD MSDB and CMSCG) and with criteria (28,29) as described above in 2.2.1 (82,83).
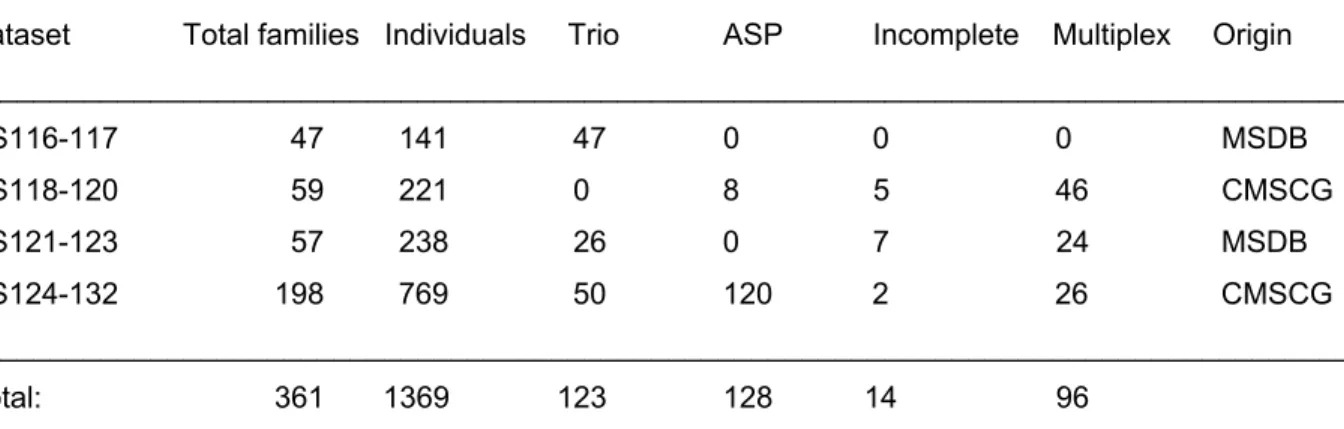
Table 3. Families in DS116-132
Dataset Total families Individuals Trio ASP Incomplete Multiplex Origin ___________________________________________________________________________________
DS116-117 47 141 47 0 0 0 MSDB DS118-120 59 221 0 8 5 46 CMSCG DS121-123 57 238 26 0 7 24 MSDB DS124-132 198 769 50 120 2 26 CMSCG ___________________________________________________________________________________
Total: 361 1369 123 128 14 96
DNA specimens of Caucasian patients and their families (DS116-132) were received in four shipments from existing collections of the Multiple Sclerosis DNA Bank (MSDB), UCSF and of the Canadian Multiple Sclerosis Collaborative Group (CMSCG), London, ON. Each DS (dataset) designates a subset of specimens in separate 96 well plates. Definitions: ASP=affected sib pair family: two or more affected and 0 or more unaffected children with their unaffected parents; trio: an affected child with his / her unaffected parents; incomplete family: an affected individual with one unaffected parent and / or an unaffected sibling; multiplex family: multiple affected and unaffected family members in two or three generations.
Genotyping
High through-put SNP genotyping was performed at Genaissance Pharmaceuticals using the
Sequenom MassARRAYTM System, which employs MALDI-TOF mass detection of extended primers.
The genotyping success rate for each validated marker averaged 96%, while the error rate was 0.5%
based on comparisons of data from sequence and MALDI-TOF analyses. The error rate identified by checking for Mendelian inconsistencies was 0.2% in our data sets.
SNPs
Out of 326 SNPs initially selected (http://www.ncbi.nlm.nih.gov/SNP), 261 assays were successfully developed and validated (80% assay conversion rate). A higher rate of assay development failure was noted for non-synonymous and other coding region SNPs as compared to intergenic SNPs. After the exclusion of monomorphic markers (18 SNPs) and of those with deviation from the HWE (11 markers with HWE p<0.03 excluded), 232 markers were retained in the study. These 232 markers (numbered here continuously according to the sequential inclusion of SNPs from centromeric to telomeric direction in 17q11) included tagging SNPs which define haplotypes (http://www.hapmap.org) and achieved an average pacing <8 kb. The total number of non-synonymous mutations was 21, 5 of which were located within CCL genes. The total number of SNPs within genes was 103, 50 of which were located within CCL genes.
Analyses
Mendelian inconsistencies were identified by using Pedcheck. Mismatching genotypes were deleted.
Allele and genotype frequencies and heterozygosity in DS116-132 were determined in 755 unrelated parents by using MERLIN (http://www.sph.umich.edu/csg/abecasis/Merlin/) (92). Deviations from the HWE were tested by using the χ2-statistics (92).
The PDT and TRANSMIT version 2.5 were used as described in 2.2.1.4.3 and 2.2.1.4.4. In the
TRANSMIT program, first the transmission of two-marker haplotypes (n-1=231 marker pairs, each with 4 possible haplotypes of which 3 are independent, resulting in a total of 693 independent 2-marker- haplotypes) was examined, followed by the extension of haplotypes in both directions in regions with p- values <0.05. Thus, an additional array of 28 three-marker and 2 four-marker combinations were tested by TRANSMIT. In the bootstrap significance test, 10,000 bootstrap samples of haplotypes were
applied.
In addition to PDT, we used the family based association test (FBAT). FBAT examines association and linkage or association in the presence of linkage, while excludes spurious associations caused by population admixtures (101-102). FBAT, based on the original TDT (95), integrates tests of different genetic models, different sampling designs and different disease phenotypes. It can also perform tests with missing parents. FBAT compares the distribution of observed and expected (Mendelian
segregation) genotypes in affected individuals under the null hypothesis assuming “no linkage and no association” or “no association, in the presence of linkage”. As the built in conditioning on the sufficient statistics eliminates all nuisance parameters, the technique avoids confounding due to model
misspecification as well as admixture or population stratification (101). To complement TRANSMIT, we
included here the haplotype based association test (HBAT). HBAT is a family-based test of association between disease and haplotypes constructed from tightly linked markers.
We used here the method of spectral decomposition (SpD) to perform correction for multiple testing for SNPs in LD with each other (http://genepi.qimr.edu.au/general/daleN/SNPSpD/) (103). A collective correlation among variables is measured by the variance of eigenvalues (λs) derived from the correlation matrix. High correlation among variables results in high λs. If all variables are fully
correlated, the first λ equals the number of variables in the correlation matrix (M), and the rest of λs are zero. If no correlation exists among variables, all of the λs will be equal to one, and the set of λs will have no variance. The ratio of observed eigenvalue variance, Var (λobs) to its maximum (M) gives the proportional reduction in the number of variables in a set. The effective number of variables (Meff) is calculated as Meff=1+(M-1) (1-Var(λobs)/M) (103). Merlin-format pedigree and map files are analyzed by an altered version of ldmax (GOLD) to estimate haplotype frequencies and to calculate the pair wise LD statistics. A Perl script creates a matrix of pair wise Δ measures, from which SNPSpD calculates λs.
The SpD output includes the matrix of pair wise Δ measures, M, λs, Var (λobs), Meff and the Sidak- corrected (104, similar to Bonferroni correction) significance threshold for Meff tests required to keep the type I error rate at 5%.
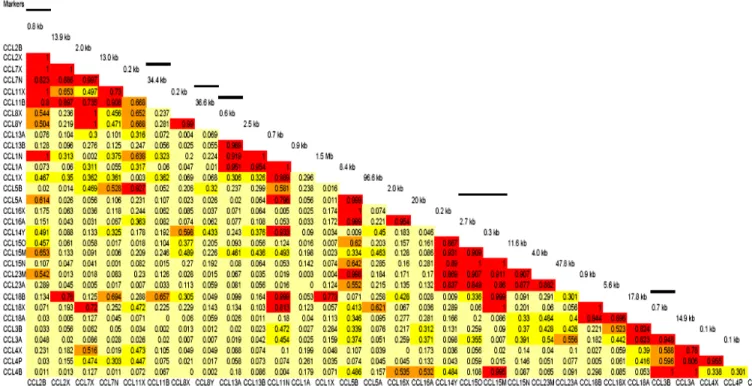
Ldmax (GOLD) was used as described in 2.2.1.4.5. The distribution of LD is also estimated here by the D’ values, where D’ ranges between 0 and 1 (greater values indicate stronger LD). The computation environment was similar to that described in 2.2.1.4.6.
2.2.3 Studies on 17q11: Phase III - Sequencing of a MS associated haplotype within CCL3 Patients and families
Altogether, 17 affected and 8 unaffected unrelated individuals were identified with an MS associated three-marker haplotype encompassing CCL3 in 1369 individuals from 361 trio, affected sibpair, incomplete and multiplex Caucasian families in the Phase II CCL genetic study.
All positive individuals were heterozygous for this haplotype defined by the A-T-C alleles of SNPs 278-277-273 (84).
Automatic sequencing
A 3500 bp DNA segment, including the MS-associated three-marker haplotype (1,180 bp) and its 5’ (1,750 bp) and 3’ (570 bp) flanking regions, was amplified by PCR in 7 overlapping fragments. The DNA fragments were directly sequenced on an ABI Prism 3700 DNA Analyzer
(Genaissance Pharmaceuticals, Inc, New Haven, CT). Sequences were aligned with the corresponding segment of the NC_010799 contig on chromosome 17
http://www.ncbi.nlm.nih.gov/entrez/viewer.fcgi?val=37544509&view=gbwithparts.
Genotyping:
SNPs revealed by sequencing in 25 individuals carrying the haplotype of interest were
genotyped using the Sequenom MassARRAY System in the original 361 families including 1369 individuals.
Analyses
Associations of these alleles and haplotypes with MS were tested by using the pedigree disequilibrium test (PDT) and TRANSMIT version 2.5 program (82,96,97).
2.2.4 Expression of CCL molecules in MS brains Patients and specimens
Frozen brain samples were obtained from the Rocky Mountain Multiple Sclerosis Brain Bank (RMMSBB), Denver, CO, and the Human Brain and Spinal Fluid Resource Center (HBSFRC), Los Angeles, CA. Corresponding sets of adjacent NAWM, NAGM and chronic active plaque specimens were obtained from frontal lobes of 10 patients with PP-MS and SP-MS, with a mean age of 51.6+10.2 years and a post mortem time of 13.52+9.6 hours. Histological criteria of specimen selection were defined as described by Lu et al (105). In brief, normal appearing and pathological tissues were
selected by gross examination. The presence of small plaques, microglial proliferation, and perivascular or parenchymal infiltration by mononuclear cells in NAWM and NAGM specimens were excluded by microscopic examination of cryosections stained by Haematoxylin&Eosin and Luxol Fast Blue. For indication of macrophage / microglia activation and up-regulation of the MHC Class I molecule,
immunohistochemical analysis was performed by using anti-CD68 and anti-β2-microglobulin staining. A chronic active plaque was defined by the presence of inflammatory activity, hypercellularity around regions showing demyelination, oligodendrocyte loss and some degree of astrogliosis (Figure 4).
Corresponding sets of white matter (WM) and gray matter (GM) specimens were obtained from 3 normal controls with a mean age of 70+3.92 years and a post mortem time of 10.13+4.32 hours.
Specimens from normal controls in the age range of MS patients were not available in the Tissue Banks, however, we included the available specimens for the intra-individual normal WM-GM comparisons. WM and GM specimens from 3 patients with Alzheimer’s disease, a mean age of
72.0+13.23 years and a post mortem time of 11.37+7.9 hours were also included. We also obtained frozen postmortem WM and GM specimens from two patients with Herpes Simplex and postinfectious encephalitis. The age of these patients was 86 and 58 years. Histological evaluation using
Haematoxylin & Eosin, Luxol Fast Blue, anti-CD68 and anti-β2-microglobulin staining revealed
inflammatory activity in both the white and gray matters of these specimens (histological documentation not shown).
Figure 4. Inflammation, immune activation and demyelination in plaque, NAWM and NAGM.
Plaque, NAWM and NAGM containing specimens were selected from adjacent frontal lobe regions of all patients.
Columns a-d show Haematoxylin & Eosin, Luxol Fast Blue, anti-CD68 and anti-β2-microglobulin staining of a plaque (first row), NAWM (second row) and NAGM (third row) of a representative patient. Note the separation of demyelination and the border zone of inflammation in a chronic active plaque (arrow), and the striking differences in the degree of inflammation and CD68 and β2-microglobulin expression in plaque, NAWM and NAGM.
Isolation of RNA
RNA extraction from frozen brain tissues was carried out by using a Qiagen RNA isolation kit (Qiagen, Valencia). RNA concentration was adjusted to 1 ug/ul and cDNA was synthesized by using the
Promega Reverse Transcription Kit with random primers (Promega, Wisconsin, MN).
Real Time PCR
mRNA of CCL2, CCL3, CCL5, CCL7, CCL8, CCL13 and CCL15 was quantified relative to β-actin (ACTB) using the LightCycler – FastStart DNA MasterPLUS SYBR Green I kit on a Roche Light Cycler System 2.0 (Roche, Indianapolis).
The primers were designed by the Roche Light Cycler Probe Design Program:
Forward primers Reverse primers
CCL2: 5`- TGTGCCTGCTGCTCATAGC – 3` 5` - TGTGGAGTGAGTGTTCAAGTCT – 3`
CCL3: 5` - TTGGGAACATGCCTCTGACC – 3` 5` - ACTGCCTACACAGGCTGAT – 3`
CCL5: 5` - TCGCTGTCATCCTCATTGCTAC – 3` 5` - GCTCATCTCCAAAGAGTTGATGTAC - 3`
CCL7: 5` - AAGGAGATCTGTGCTGACCC – 3` 5` - AAGCTTTATGTTCDAAAACCCAC – 3`
CCL8: 5`- GTGAGGTCACTTTGCTGAGC - 3` 5`- AACCTTCATCTTGGAGGGC- 3`
CCL13: 5` - GCTGGAGTACGTGAAATGACT – 3` 5` - GGAACCGAATACAAACCCACTG – 3`
CCL15: 5` - GCTAACACCTCCTGGTTGGA – 3` 5` - AGAACAAGGCTGAGAGTGC – 3`
ACTB: 5` - AAGACCTGTACGCCAACAC – 3` 5` - GGGTGTAACGCAACTAAGT – 3`
As an external standard, five different concentrations [5x10⁶ copies/5ul; 5x10⁵ copies/5ul; 5x10⁴ copies/5ul; 5x10³ copies/5ul; 5x10² copies/5ul] of a β2 -microglobulin cDNA sample were amplified along with the experimental samples in each run (Roche, Indianapolis). Each PCR mixture consisted of 2 uL cDNA, 50 pmol of forward and reverse primers, 4 uL of SYBR Green reaction mix with the
FastStartPLUS Enzyme and H2O was added to a final volume of 20 uL. The PCR conditions were as follows: denaturation at 95°C for 600s; amplification at 95°C for 10s, 62°C for 13 sec, 72°C for 13 sec in 45 cycles. The melting curve reading rose 0.21°C/sec continuously until it reached 97°C from 70°C.
Cooling proceeded until the machine reached 40°C. The experimental samples were plotted along the slope of the β2 -microglobulin external standard to automatically extrapolate their concentrations by using the Roche analysis software version 4.0.
Analyses of data
Regional differences in the mRNA expression in NAWM, NAGM and plaque or WM and GM were analyzed by the Wilcoxon Signed Rank Test.
2.3 RESULTS
2.3.1 Studies on 17q11: phase I – LD mapping (82) Allele and genotype frequencies
Genotyping of DNA was similarly performed in all datasets. SNP allele and genotype frequencies were compared among the datasets, and also calculated for the unrelated parents in the combined DS101- 115 dataset. No deviations from the HWE were observed.
Markers showing allelic associations with MS
Analysis of data was initially carried out separately in each dataset, and then in the combined DS101- 115 set. Since all datasets contain North-American families with European background and with similar allele frequency distributions, the results from the combined DS101-115 families are presented here (Table 4). The analysis reveals transmission distortion for SNPs CCL2B, CCL11B, CCL5A, CCL18B, CCL18X and CCL3B (Table 4). Considering that 94% of the DS101-115 families include patients with RR/SP-MS, it is reassuring to detect similar trends of findings in the unstratified and the RR/SP-MS data sets. Although the PP-MS group is small, allelic associations are significant at CCL18B and CCL18X. However, the p-values are modest and become non-significant after Bonferroni correction for multiple comparisons.
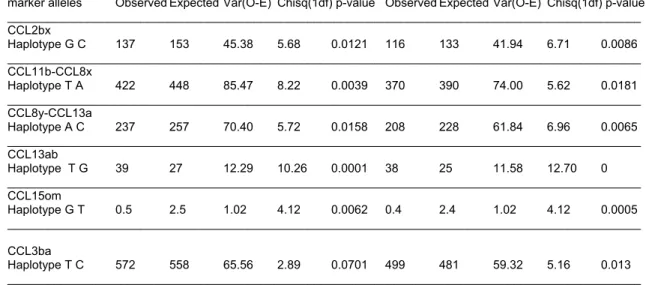
Haplotypes associated with MS
While no SNP in Table 4 has direct relevance to MS, they may still define disease associated
haplotypes. Therefore, twenty-seven 2-marker haplotypes generated in a pair-wise manner from the list in Table 2 (but skipping subregions with a gap >30kb), and five 3-marker haplotypes in subregions of 2- marker haplotype associations were tested by TRANSMIT (Table 5a and 5b). We detected significant p-values for several two-marker haplotypes including CCL2bx, CCL11b-CCL8x, CCL8y-CCL13a, CCL13ab and CCL15om in both DS101-115 and the RR/SP-MS groups and for CCL3ba in the RR/SP- MS group. Only one three-marker haplotype, CCL15omn showed significant distortion in the two groups. However, the variance value of observed and expected transmissions (<2.5) of the CCL15om and CCL15omn haplotypes was too low to make reliable conclusion (97). As indicated in Table 5a and 7b, the removal of the PP-MS families from DS101-115 did not markedly change the outcome of the