Original Paper
Med Princ Pract 2019;28:101–108
Maternal Hematological Parameters and
Placental and Umbilical Cord Histopathology in Intrauterine Growth Restriction
Mária Jakóa Andrea Surányia László Kaizerb Gábor Németha György Bártfaia
aDepartment of Obstetrics and Gynecology, University of Szeged, Szeged, Hungary; bDepartment of Pathology, University of Szeged, Szeged, Hungary
Received: September 5, 2017 Accepted: January 27, 2019 Published online: January 27, 2019
Mária Jakó
Department of Obstetrics and Gynecology, University of Szeged 1. str. Semmelweis
© 2019 The Author(s) Published by S. Karger AG, Basel
Significance of the Study
• Our aim was to improve the 50% detection rate of ultrasonographic fetal biometry in the diagnosis of intrauterine growth restriction (IUGR). This study shows that the correlation between placental vol- ume and birth weight is strong and that the umbilical artery lumen area is decreased in IUGR. Among the maternal blood parameters, only the platelet count correlates with clinical findings. The evaluation of these data can make the diagnosis more accurate.
DOI: 10.1159/000497240
Keywords
Intrauterine growth restriction · Placental morphology · Placental histopathology · Umbilical arteries ·
Two-dimensional Doppler ultrasound
Abstract
Objective: To investigate the placental and umbilical cord histopathology in intrauterine growth restriction (IUGR) and their relation to second-trimester maternal hematological parameters. Materials and Methods: Patients were selected for the IUGR group based on estimated fetal weight below the 10th percentile. Patients were recruited into the control group randomly. Patients were followed up with ultrasound, and blood samples were taken between the 20th and 24th gestational weeks. After delivery and formalin fixation, weight and volume of the placenta were recorded and his- tologic samples were processed. Results: Maternal platelet
count strongly correlates with placental weight (r = 0.766).
On the other hand, neonatal weight correlates with placen- tal volume (r = 0.572) rather than with placental weight (r = 0.469). Umbilical arterial lumen cross-sectional area corre- lates with birth weight (r = 0.338). Conclusions: Maternal he- matological parameters do not seem to affect neonatal out- come. Our main findings are the correlation of maternal platelet count with placental weight, the correlation of pla- cental volume with birth weight being stronger than the cor- relation of placental weight with birth weight, and the cor- relation of umbilical artery lumen cross-sectional area with neonatal weight. Mild histopathologic alterations might oc- cur in normal pregnancies; however, sufficient fetal nutrition can be maintained. This compensatory function of the pla- centa seems to be insufficient when two or more patholo- gies are present, which is characteristic for IUGR.
© 2019 The Author(s) Published by S. Karger AG, Basel
Introduction
Intrauterine growth restriction (IUGR) increases peri- natal mortality by 10–25% and morbidity by 50–75% and predisposes the newborn to metabolic syndrome, diabe- tes mellitus, stroke, and heart disease. The placental mi- crovasculature is essential for the sufficient transfer of gases, nutrients, and metabolites between the mother and the fetus [1]. The size, weight, and shape of the placenta may vary within wide extreme values, and placental size is related to its ability to transfer nutrients [1, 2]. The re- lationship between placental morphometry and adverse pregnancy outcome, including IUGR, is known [3]. Small placental size, decreased placental surface area [4], and small placental volume [5] have been associated with in- creased risk of IUGR. Placental weight increases linearly as gestation progresses and its capacity to transfer me- tabolites increases and compensates for its slow growth related to fetal development. Weight and volume of pla- centas associated with IUGR are lower than that of their normal-weight counterparts [6]. Placental coefficients (placental weight/fetal weight ratio) between 0.10 and 0.18 are considered normal. The literature is not consis- tent regarding overall placental volume. In some cases, as the functioning placental tissue tries to compensate for the reduced circulation, the placental weight might not be reduced in IUGR [7]. Placentas of infants with IUGR are characterized by smaller diameters, increased placental coefficient, and decreased placental weight and volume as compared to that of normal-weight infants [8]. It is not clear yet how placental weight and volume are related.
Sonographically, placental volume can be used to detect placental growth restriction that precedes fetal IUGR by several weeks [9]. There are placental vascular patholo- gies (calcification, reduced capillarization in the terminal villi, reduced cytotrophoblast proliferation, chronic vil- litis, infarcts, perivillous fibrin deposition, etc.) that are associated with growth restriction, the presence of which does not explain how low birth weight and mild forms are present in normal pregnancies too [10].
Placental function can be assessed in vivo by uteropla- cental Doppler flow velocimetry, and fetal growth can be assessed by serial ultrasonic biometry. The flow velocity waveform in the umbilical artery normally shows low re- sistance in the last trimester of pregnancy, and this is thought to reflect the development of the villous vascular tree [11]. High resistance in the umbilical artery is widely used as an indicator of placental dysfunction, where the elevation of resistance correlates with the maldevelop- ment of the tertiary villi [1]. Low-for-gestational-age fe-
tuses show abnormal blood flow velocity waveforms in the umbilical and uterine artery with reduced, absent, or reverse diastolic flow and abnormally reduced blood flow per unit of fetal weight. IUGR remains a diagnostic chal- lenge, as ultrasound provides a detection rate of only 50%.
The explanation for low detection rate might be that bi- ometry and flowmetry does not give direct information about the ratio of functional/pathological placental tis- sue, it provides information only indirectly [12].
Maternal hemoglobin level (Hgb) might be another marker in IUGR screening. High placental coefficient with low maternal Hgb suggests differences in placental growth related to fetal growth [13]. Although severe ane- mia is associated with IUGR, maternal iron status cannot be assessed simply from Hgb concentration because plas- ma volume is increased in pregnancy and Hgb concentra- tion decreases accordingly. The failure of the plasma vol- ume to expand itself might cause growth restriction too [14]. Mean corpuscular volume of red blood cells does not change substantially during pregnancy; therefore, it might be a better choice for predicting adverse fetal out- come [14]. Yet there is no sufficient evidence of a rela- tionship between placental ratio, Hgb concentration, or mean corpuscular volume [15]. Other studies report that the decrease in Hgb concentration in pregnancy is related to birth weight; failure of the Hgb concentration to fall below 105 g/L indicates an increased risk of low birth weight and preterm delivery [16]. High blood viscosity, elevated platelet count, and spontaneous platelet aggrega- tion can be risk factors for vascular occlusions and a nov- el risk factor for adverse pregnancy outcomes such as pre- eclampsia and IUGR too [17]. Most studies on the inter- relationships between antenatal uteroplacental Doppler blood flow velocimetry and the postnatal findings have focused on the microscopic and ultrastructural character- istics of the placenta [18] or the relationship between fetal weight and the gross morphology of the placenta [19].
The objective of this study was to evaluate pathological changes of the placenta and umbilical cord in connection with IUGR pregnancies and to investigate whether birth weight or placental changes are influenced by maternal hematologic blood parameters.
Materials and Methods Study Design
Pregnant subjects were recruited in a prospective case-control study between January 2014 and December 2016 in the Department of Obstetrics and Gynecology, University of Szeged, Szeged, Hun- gary. Each subject signed informed consent in accordance with the
Declaration of Helsinki and was followed up until delivery. Clinical data were collected from the medical anamnesis, blood parameters were taken in the second trimester, between the 24th and 30th weeks of gestation. Subjects were classified into the IUGR group if the es- timated fetal weight on the 20th week of gestation was below the 10th percentile as per race, gender, and gestational age, and recruited into the control group randomly. For birth weight percentile, we used the sex-specific percentile scale of the International Society of Ultra- sound in Obstetrics and Gynecology [20]. Patients with twin preg- nancies, preterm births, genetic malformations, chromosomal or developmental disorders, hypertension (<140/80 Hg mm), diabetes (fasting plasma glucose <6.9 mmol/L measured at the 24th week of gestation), alcohol, nicotine or drug abuse were excluded from the study. Patients involved in the study did not have immunological, cardiovascular, gastrointestinal, or pulmonary disease.
Data Collection
Every ultrasound examination was performed by the same per- son to avoid interobserver variability. All patients were scanned in a semi-recumbent position. The factorial default setting “Obstet- rics/2–3 trimester” was used in 2-D mode on a GE Voluson 730 machine. Gestational age was determined based on the first day of the last menstrual period and on ultrasound biometry (crown- rump length and biparietal diameter) between the 9th and 11th weeks of pregnancy. In the 20th–24th week, fetal biometry was
used to assess estimated fetal weight by the formula B of Hadlock [21]. A conventional color Doppler study of the umbilical arteries were also performed and the S/D ratio was read from report dis- play of ultrasound. After delivery, the weight of the neonate and placental volume were measured. For volume measurements, we used the water replacement technique.
Umbilical Cord and Placental Sample Processing
After 3–7 days of formalin fixation, placental weight and vol- ume were measured and gross examination of the placenta and the umbilical cord was executed by an expert pathologist according to the Guideline of The Royal College of Pathologists, 2011 [22]. Af- ter measuring the diameters, the placenta was cut along the longest diameter in 1-cm-thick strips using a brain knife and the thickness of the tissue was measured at the umbilical cord insertion. Um- bilical cord samples were taken from the placental end and cut into transversal slices of 4 mm, perpendicular to the umbilical cord.
The slices were dehydrated in graded ethanol series, cleaned in xy- lene, and embedded in paraffin. Paraffin samples were sectioned at 4 μm. After hematoxylin/eosin (HE) staining, histologic samples were analyzed via Axio Vision SE64 Rel. 4.9.1. microscope. The following parameters of the umbilical cord were measured in dig- itized HE-stained sections; umbilical cord longest cross-sectional diameter, vessel lumen area, and vessel wall thickness. Because of the umbilical cord coiling, the surface of the vessels were not math- Table 1. Clinical data of the mothers and newborns
IUGR (n = 8) Control (n = 46) p
mean ±SD mean ±SD
MCV, fL 84.48 0.96 88.25 1.26 ns
RBC, T/L 4.07 0.03 4.03 0.10 ns
Hgb, g/L 123.80 4.48 121.50 2.31 ns
Htk, L/L 0.35 0.01 0.36 0.01 ns
PLT, ×109/L 235.50 24.73 197.80 11.81 ns
MPV, fL 10.65 0.66 12.01 0.32 ns
Prothrombin time, s 12.80 0.10 12.93 0.13 ns
INR 0.97 0.01 0.98 0.01 ns
APTT, s 33.93 0.26 32.03 0.47 ns
Umbilical artery S/D 3.39 0.38 2.22 0.11 0.0006
Maternal age, years 29.75 1.11 25.72 3.64 ns
Maternal BMI 28.48 2.35 22.46 1.83 ns
Parity 0.85 0.16 1.48 0.34 ns
Birth weight, g 2,110.00 194.0 3,367.73 435.04 0.0023
Gestational age, weeks 37.29 1.10 38.58 1.58 ns
1-min Apgar score 7.71 1.14 8.38 1.85 0.036
5-min Apgar score 8.86 1.46 9.46 1.13 ns
10-min Apgar score 9.57 1.13 9.92 0.28 ns
Male, % 50.00 – 45.94 – ns
Female, % 50.00 – 54.05 – ns
Maternal peripheral venous blood parameters: MCV, mean corpuscular volume of red blood cells; RBC, red blood cell count; Hgb, hemoglobin; Htk, hematocrit; PLT, platelet count; MPV, mean platelet volume; INR, international normalized ratio; APTT, activated partial thromboplastin time; BMI, body mass index; S/D, systolic and diastolic blood flow velocity ratio; ns, not significant.
ematically perfect cross-sections, and we standardized our mea- surements to the highest point of torsion, lowest point of torsion, and an extra measurement at the 3, 6, or 9 o’clock position depend- ing on the first two points. Placental histological samples (3 mm × 10 mm × 20 mm) were taken from the umbilical cord insertion, the edge of the placenta, the fetal and maternal side of the placenta, and from the pathological alteration(s), if there were any.
Statistical Analysis
For normally distributed maternal and neonatal characteris- tics and outcomes of the umbilical cord and placenta, we used t test, and analysis of variance (ANOVA) was applied to assess dif- ferences in vessel wall thickness depending on different lumen
shapes in arteries. The Kruskal-Wallis test was applied to skewed variables with Bonferroni correction. Differences were considered statistically significant at p < 0.05. After a multiparametric corre- lation analysis with post hoc adjustment for multiple compari- sons, linear regression analysis was applied to investigate the re- lationships among maternal blood parameters and clinical out- come. Correlation was evaluated as “strong” if the value of r was above 0.5, “moderate” between 0.3 and 0.5, and “weak” under 0.3.
All analyses were performed via Prism 6 (Graph Pad Software Inc., San Diego, CA, USA).
900800 700600 500400 300200 1000
1,000 1,500 2,000 2,500 3,000 3,500 4,000 4,500 5,000
Placental volume after delivery, mL
Birth weight, g 900800
700600 500400 300200 1000
1,000 1,500 2,000 2,500 3,000 3,500 4,000 4,500 5,000 Placental volume after formaline fixation, mL
Birth weight, g 900
800700 600500 400300 200100
01,000 1,500 2,000 2,500 3,000 3,500 4,000 4,500 5,000 Placental weight after formaline fixation, g
Birth weight, g a
b
c
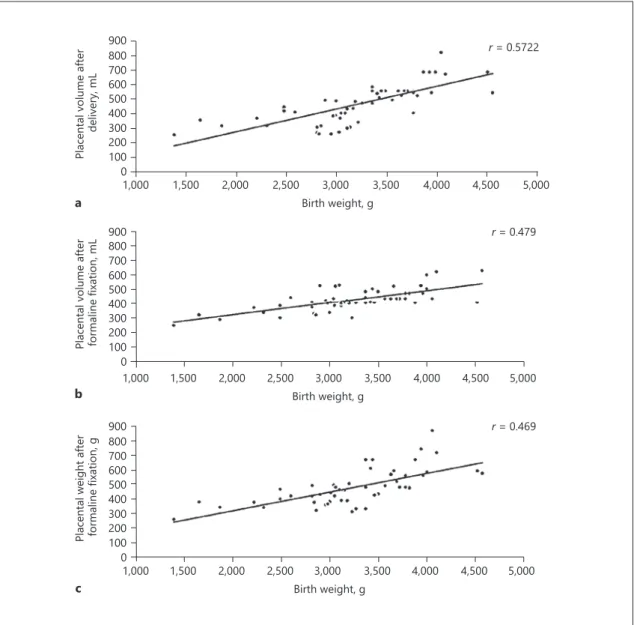
r = 0.469 r = 0.479 r = 0.5722
Fig. 1. Placental morphometry; placental volume measured after delivery (a) shows the strongest correlation with birth weight, not the placental volume (b) or weight (c) after formalin fixation.
Results
Fifty-four patients (46 controls, 8 IUGR) were recruit- ed. Clinical data and maternal blood parameters are shown in Table 1. Values of mean corpuscular volume of red blood cells (r = 0.0487), red blood cell count (r = 0.0147), Hgb (r = 0.1098), hematocrit (r = 0.0016), plate- let count (r = 0.0009), prothrombin time (r = 0.0048), INR (r = 0.0148), or activated partial thromboplastin time (r = 0.0240) did not correlate with neonatal weight. Platelet count showed a strong correlation with placental weight (r = 0.7660). Gross pathological examination revealed that placental volume measured right after delivery shows
the strongest correlation with birth weight rather than with placental weight or with volume after formalin fixa- tion (Fig. 1). The results of histological examination are shown in Tables 2 and 3. The prevalence of obliterated, star-shaped lumen in one or both arteries did not differ in the IUGR or control cases (Fig. 2), but the lumen cross- sectional area shows a mild correlation with birth weight (r = 0.336). We found non-conversion of maternal arter- ies in the placenta that is similar to that of the uterine ar- teries seen via ultrasound as end-diastolic stop of blood flow (notch). The five cases did not coincide with notch in uterine arteries in our ultrasonographic data on uterine arteries.
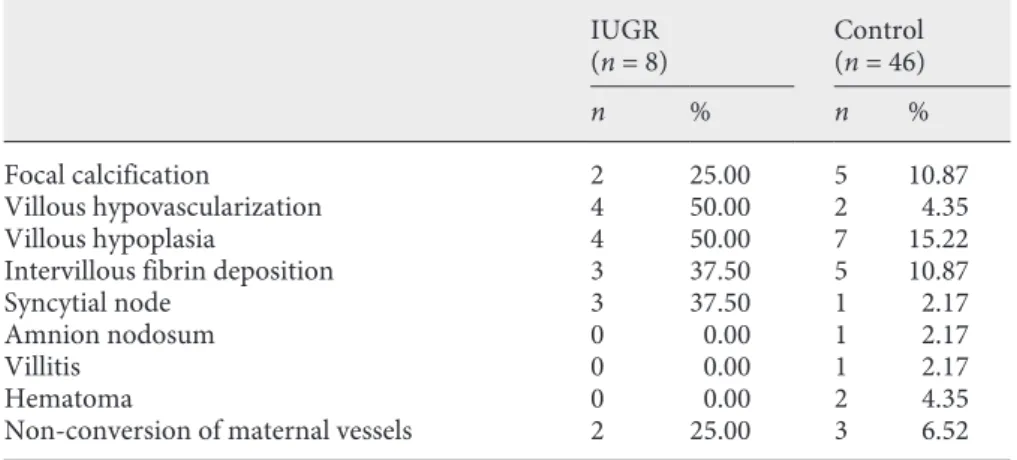
IUGR
(n = 8) Control
(n = 46)
n % n %
Focal calcification 2 25.00 5 10.87
Villous hypovascularization 4 50.00 2 4.35
Villous hypoplasia 4 50.00 7 15.22
Intervillous fibrin deposition 3 37.50 5 10.87
Syncytial node 3 37.50 1 2.17
Amnion nodosum 0 0.00 1 2.17
Villitis 0 0.00 1 2.17
Hematoma 0 0.00 2 4.35
Non-conversion of maternal vessels 2 25.00 3 6.52
Table 3. Umbilical cord and placental pathology
IUGR (n = 8) Control (n = 46) p
mean ±SD mean ±SD
Vena umbilicalis vessel wall thickness, µm 663.8 41.6 605.4 20.6 ns
Vena umbilicalis lumen area, µm2 1,563,000.0 1,054,000.0 1,803,000.0 514,365.0 ns
Arteria umbilicalis vessel wall thickness, µm 636.4 41.0 678.2 15.0 ns
Arteria umbilicalis lumen area, µm2 146,825.0 18,369.0 526,659.0 77,690.0 0.0296
Ratio of star-shaped arteries 0.71 0.29 0.89 0.13 ns
UCI 1.05 0.27 1.52 0.44 ns
Umbilical cord diameter, mm 93.20 8.34 116.10 6.24 ns
Number of placental pathologies present 2.13 0.30 0.70 0.11 <0.0001
Native placental volume, mL 315.30 23.44 492.50 17.95 <0.0001
Placental volume after formalin fixation, mL 368.80 23.15 461.50 15.01 0.0018
Placental weight after formalin fixation, g 401.80 18.33 468.90 15.49 0.0226
Longest placental diameter, cm 15.50 1.15 15.86 0.20 ns
Shortest placental diameter, cm 13.11 0.46 14.39 0.29 0.0196
Placental thickness, cm 2.58 0.14 2.71 0.08 ns
Placental coefficient 1.19 0.01 0.14 0.01 <0.0001
Table 2. Placental histopathologic alter- ations
Discussion
This study shows that the correlation between placental volume and birth weight is stronger than the correlation between placental weight and birth weight. The umbilical artery lumen area is significantly decreased in IUGR preg- nancies. Among the maternal peripheral venous blood pa- rameters, only the platelet count correlates with the clinical findings. Other blood parameters that could alter maternal blood viscosity seem to have no effect on fetal weight.
Blood samples were taken between the 20th and 24th weeks of gestation, right after when the placental vascular tree had developed and the ultrasonographically measurable sings of placental malperfusions were detectable.
The results draw attention to antenatally measurable possible predictors of intrauterine growth restriction, the placental volume, the shortest diameter of placenta, and the lumen area of umbilical arteries in IUGR. The strength
of this study is that each kind of measurement was per- formed blindly and by only one researcher. A limitation of this study is the small number of cases. In our clinic, the annual birth rate is about 2,300, and IUGR pregnan- cies with known etiologic backgrounds (other than pla- cental insufficiency) were excluded.
Elevated numbers of maternal mononuclear cells and increased levels of cytokines have been reported in pre- eclampsia, and also the cytokine levels produced is high- er. The high proinflammatory cytokine concentration may cause endothelial dysfunction and thus vasocon- strictions [23]. We excluded pregnant patients with pre- eclampsia or hypertension, and in connection with intra- uterine growth restriction, we did not observe the same correlation. Based on the data collected from maternal hematologic parameters in our study, we would not sug- gest them for further studies of predictors of low birth weight. Only the platelet count shows a correlation with
a b
c d
Color version available online
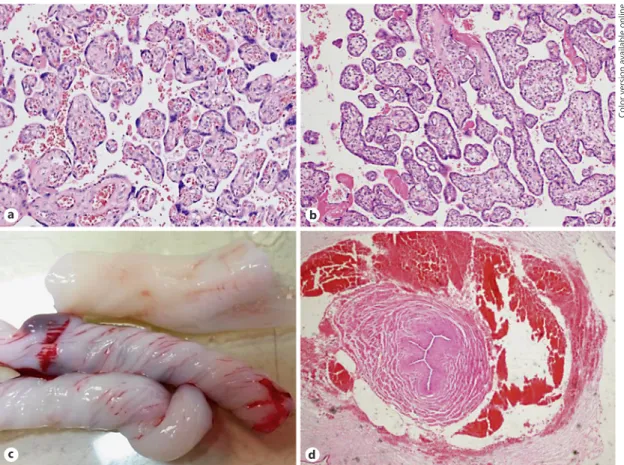
Fig. 2. Placental and umbilical cord histopathology; normal pla- cental tissue (a) with vascularized villi and intrauterine growth- restricted placental tissue (b) with hypovascularization and inter- villous fibrin deposition (HE, 200×). Different coiling patterns
(c) that can distort vessel cross-section and an obliterated, star- shaped umbilical artery lumen (d) with perivascular hematoma and asymmetrical vessel wall (HE, 400×). Perivascular hematoma is the result of intrapartum pulling of the umbilical cord.
clinical findings and it does not affect birth weight. In contrast with the cellular compounds of the maternal blood, cytokines and tumor necrosis factor alpha levels might be worth measuring in IUGR pregnancies [23, 24].
Our data shows that placental volume measured after delivery has a stronger correlation with birth weight than does placental weight with birth weight. Although these parameters differ significantly between the two groups, they do not reflect functional variability within the tissue.
In a large placental disc with confluent infarctions, calcifi- cation would still be in the upper range of weight and vol- ume but would belong to a growth-restricted fetus. We rec- ommend the development of a reliable in utero method to estimate functional placental volume that refines the esti- mated fetal weight. We also suggest establishments of per- centile curves of trimmed placental weights to be used for predicting growth restriction. The placental volume can be estimated by ultrasound more accurately than by placental weight [13]. Placental volume and shape also can be deter- mined via medical resonance imaging (MRI). MRI gives additive information about the textural features and shape of the placenta. Placentas in IUGR pregnancies tend to be more oval and thicker than placentas of healthy fetuses, which are more circular [25]. Our morphologic measure- ments support these observations. Some studies managed to establish a percentile curve placental volume. After some routinely performable measurements, new diagnostic ref- erence values could be used [26]. Three-dimensional pla- cental measurements in the first trimester showed a mod- erate correlation with fetal weight. Measurements in the second trimester performed along the fetal side of the pla- centa have better predictive values (up to 45%) and can be used for screening patients at high risk [27].
Our results confirm that mild histopathologic altera- tions might be present in normal pregnancies, and until there is enough functional placental tissue, sufficient fetal nutrition can be maintained [13]. This compensatory re- sidual of the placenta becomes insufficient when two or more pathologies are present, which is characteristic for IUGR. We have found non-conversion of the arteries in the maternal side of the placenta. The five cases did not coin- cide with notch in uterine arteries. With a mathematical model, it has been demonstrated that the vessel wall shear stress and blood velocity jets are bigger in uterine arteries in IUGR and also vortices occur more often in the intervil- lous space [28]. This condition of increased turbulence with increased platelet count promotes the formation of microthrombus that explains the intervillous deposition of fibrin and increased placental weight related to birth weight in IUGR pregnancies. Umbilical vessels are coiling togeth-
er along the cord and their cross-section perpendicular to the longitudinal axis of the cords will rarely be a true math- ematical cross-section. This artefact causes torsion, oval or bean-shaped lumen, and variability in measurements of vessel wall thickness. In cases of strict arterial constriction, a star-shaped lumen can be seen. To overcome this adver- sity, we standardized our method based on this torsion and performed an additional measurement semi-independent- ly. This method is reproducible in ultrasonography. Only the lumen cross-sectional area of the umbilical arteries dif- fered between the IUGR and control group. Our finding of non-significantly decreased arterial vessel wall thickness conforms to the published literature [29, 30].
Conclusion
The novelty of our study is the correlation of maternal platelet count with placental weight, the stronger correla- tion of placental volume with birth weight than the cor- relation of placental weight with birth weight, and the correlation of umbilical artery lumen cross-sectional area and neonatal weight. Larger studies are needed to ascer- tain whether these alterations in umbilical arteries are part of a fetal response to undernutrition or the etiology of part of IUGR. Further studies are also needed to estab- lish a diagnostic method involving similar findings to in- crease the accuracy of predicting fetal outcome.
Statement of Ethics
This study was conducted with the permission of the Hungar- ian Medical Research council (Permission No. 49870-3773/2014/
EKU 586). Each recruited patient has signed the informed consent.
Disclosure Statement
The authors have no conflict of interest to declare.
References 1 Benirschke K, Burton GJ, Baergen RN. Pa- thology of the Human Placenta. 6th ed.
Springer; 2012. https://doi.org/10.1007/978- 3-642-23941-0.
2 Burton GJ, Barker DJ, Moffett A, et al. The Pla- centa and Human Developmental Program- ming. Cambridge University Press; 2010.
https://doi.org/10.1017/CBO9780511933806.
3 Longtine MS, Nelson DM. Placental dysfunc- tion and fetal programming: the importance of placental size, shape, histopathology, and molecular composition. Semin Reprod Med.
2011 May;29(3):187–96.
4 Ducray JF, Naicker T, Moodley J. Pilot study of comparative placental morphometry in pre-eclamptic and normotensive pregnancies suggests possible maladaptations of the fetal component of the placenta. Eur J Obstet Gy- necol Reprod Biol. 2011 May;156(1):29–34.
5 Odibo AO, Zhong Y, Longtine M, Tuuli M, Odibo L, Cahill AG, et al. First-trimester se- rum analytes, biophysical tests and the asso- ciation with pathological morphometry in the placenta of pregnancies with preeclampsia and fetal growth restriction. Placenta. 2011 Apr;32(4):333–8.
6 Egbor M, Ansari T, Morris N, et al. Morpho- metric placental villous and vascular anom- alities in early and late-onset preeclampsia with and without fetal growth restriction. Br J Obstet Gynaecol. 2006;113:580–9.
7 Biswas S, Ghosh SK. Gross morphological changes of placentas associated with intra- uterine growth restriction of fetuses: a case control study. Early Hum Dev. 2008 Jun;
84(6):357–62.
8 Oliveira LH, Xavier CC, Lana AM. [Changes in placental morphology of small for gesta- tional age newborns]. J Pediatr (Rio J). 2002 Sep-Oct;78(5):397–402.
9 Higgins LE, Simcox L, Sibley CP, Heazell AE, Johnstone ED. Third trimester placental vol- ume and biometry measurement: A method- development study. Placenta. 2016 Jun;42:
51–8.
10 Nkwabong E, Kamgnia Nounemi N, Sando Z, Mbu RE, Mbede J. Risk factors and placental histopathological findings of term born low birth weight neonates. Placenta. 2015 Feb;
36(2):138–41.
11 Salavati N, Sovio U, Mayo RP, Charnock-Jones DS, Smith GC. The relationship between hu- man placental morphometry and ultrasonic measurements of utero-placental blood flow and fetal growth. Placenta. 2016 Feb;38:41–8.
12 Javor D, Nasel C, Schweim T, Dekan S, Cha- lubinski K, Prayer D. In vivo assessment of putative functional placental tissue volume in placental intrauterine growth restriction (IUGR) in human fetuses using diffusion ten- sor magnetic resonance imaging. Placenta.
2013 Aug;34(8):676–80.
13 Larsen S, Bjelland EK, Haavaldsen C, Eskild A.
Placental weight in pregnancies with high or low hemoglobin concentrations. Eur J Obstet Gynecol Reprod Biol. 2016 Nov;206:48–52.
14 Steer PJ. Maternal hemoglobin concentration and birth weight. Am J Clin Nutr. 2000 May;
71(5 Suppl):1285S–7S.
15 Perry IJ, Beevers DG, Whincup PH, Bareford D. Predictors of ratio of placental weight to fetal weight in multiethnic community. BMJ.
1995 Feb;310(6977):436–9.
16 Steer P, Alam MA, Wadsworth J, Welch A.
Relation between maternal haemoglobin con- centration and birth weight in different ethnic groups. BMJ. 1995 Feb;310(6978):489–91.
17 Burke N, Flood K, Muellers S, Murray A, Dunne E, Cotter B, et al. Reduced spontane- ous platelet aggregation: a novel risk factor for adverse pregnancy outcome. Eur J Obstet Gy- necol Reprod Biol. 2016 Apr;199:132–6.
18 Sovio U, White IR, Dacey A, Pasupathy D, Smith GC. Screening for fetal growth restric- tion with universal third trimester ultraso- nography in nulliparous women in the Preg- nancy Outcome Prediction (POP) study: a prospective cohort study. Lancet. 2015 Nov;
386(10008):2089–97.
19 NICE. Antenatal Care. NICE Clinical Guide- line 62. UK: National Collaborating Centre for Women's and Children's Health; 2008.
20 Schwärzler P, Bland JM, Holden D, Campbell S, Ville Y. Sex-specific antenatal reference growth charts for uncomplicated singleton pregnancies at 15-40 weeks of gestation. Ultra- sound Obstet Gynecol. 2004 Jan;23(1):23–9.
21 Hadlock FP, Harrist RB, Sharman RS, Deter RL, Park SK. Estimation of fetal weight with the use of head, body, and femur measure- ments—a prospective study. Am J Obstet Gy- necol. 1985 Feb;151(3):333–7.
22 Cox P, Evans C. Tissue pathway for histopath- ological examination of the placenta. The Royal College of Pathologists. 2011. Docu- ment number: G108. www.rcpath.org/re- sourceLibrary/tissue-pathway-histopatho- logical-placentaSept11.html
23 Raghupathy R. Cytokines as key players in the pathophysiology of preeclampsia. Med Princ Pract. 2013;22(s1 Suppl 1):8–19.
24 Azizieh FY, Raghupathy RG. Tumor necrosis factor-α and pregnancy complications: a pro- spective study. Med Princ Pract. 2015;24(2):
165–70.
25 Dahdouh S, Andescavage N, Yewale S, Yarish A, Lanham D, Bulas D, et al. In vivo placental MRI shape and textural features predict fetal growth restriction and postnatal outcome. J Magn Reson Imaging. 2018 Feb;47(2):449–
26 Isakov KM, Emerson JW, Campbell KH, 58.
Galerneau F, Anders AM, Lee YK, et al. Esti- mated Placental Volume and Gestational Age. Am J Perinatol. 2018 Jul;35(8):748–57.
27 Quant HS, Sammel MD, Parry S, Schwartz N.
Second-trimester 3-dimensional placental so- nography as a predictor of small-for-gesta- tional-age birth weight. J Ultrasound Med.
2016 Aug;35(8):1693–702.
28 Roth CJ, Haeussner E, Ruebelmann T, Koch FV, Schmitz C, Frank HG, et al. Dynamic modeling of uteroplacental blood flow in IUGR indicates vortices and elevated pressure in the intervillous space - a pilot study. Sci Rep. 2017 Jan;7(1):40771.
29 Herzog EM, Eggink AJ, Reijnierse A, Kerkhof MA, de Krijger RR, Roks AJ, et al. Impact of early- and late-onset preeclampsia on features of placental and newborn vascular health. Pla- centa. 2017 Jan;49:72–9.
30 Sharony R, Eran K, Biron-Shental T, Kidron D. Morphometric characteristics of the um- bilical cord and vessels in fetal growth restric- tion and pre-eclampsia. Early Hum Dev. 2016 Jan;92:57–62.