THESES OF DOCTORAL (PhD) DISSERTATION
UNIVERSITY OF WEST HUNGARY
FACULTY OF AGRICULTURAL AND FOOD SCIENCES Institute of Animal Breeding and Husbandry
Program leader, subprogram leader and supervisor Prof. Dr. Dr. h.c. János Iváncsics †
DSc in Agriculture
SOME ASPECTS OF UDDER HEALTH RELATED TO MILK QUALITY AND GRAVITY OF MASTITIS
Written by
LÁSZLÓ PONGRÁCZ
MOSONMAGYARÓVÁR 2002
1. INTRODUCTION AND AIM
Despite considerable research on bovine mastitis the disease still remains a relevant problem to the dairy industry. Losses are estimated due to reduced production, increased replacement costs, discarded milk, drug costs, veterinary fees and labour costs (DeGraves and Fetrow, 1993). Additional costs that are seldom mentioned are incurred by the processing industry in terms of reduced cheese yields and consumer acceptance (Heeschen et al., 1985; Barbano et al., 1991; Barbano, 1999).
While it has done a great job in mastitis control in producer herds the need to control mastitis is increasingly driven by the consumers of milk and milk products. These quality and safety demands of the international trade also continue to apply pressure on producers in many countries to control mastitis (Rasmussen, 1999; Smith and Hogan, 1999). Furthermore, the concept that mastitic animals are diseased people believe that mastitis is an animal welfare issue, too (Rasmussen, 1999; Smith and Hogan, 1999).
Dairy products possess a wide range of beneficial nutritional and sensory properties but this change due to the composition of milk. Because correlation was found between some properties of milk and prevalence/gravity of mastitis a number of tests and methods have been developed for detecting the disease. Most tests estimate the somatic cell count (SCC) of a milk sample (Kitchen, 1981).
Milk somatic cells are primarily leukocytes coming from the blood. Some epithelial cells shed from the lining of the mammary gland. Leukocytes accumulate at the inflamed site to combat invading bacteria. This indigenous antibacterial effect of the healthy udder is activated by the inflammatory and immune system (Korhonen and Sandholm, 1985).
According to an internationally accepted standard the cell count for
“normal” milk is nearly always less than 200,000 cells/ml. Higher counts are considered “abnormal” and indicate probable infection, and also associated with decreased production. Factors such as late lactation, age, environmental stress, milking technique and hygiene or genetic disposition may cause elevations of SCC (Harmon, 1994; Heeschen, 1996; Hillerton, 1999; Smith and Hogan, 1999).
Nearly all developed countries have adopted upper regulatory limits for SCC in milk. Hungary, the EU and Nordic countries, Switzerland, New Zealand, Australia etc. all accepted 400,000 cells/ml as the upper limit but already
discussing lowering it to 300,000 or perhaps even 250,000 cells/ml. Many countries are able to determine a national average SCC based on all registered/evaluated producers in the country. In countries it is less than 200,000 cells/ml clearly indicate that producers can control the technical, environmental and hygienical, biological and genetic effects caused subclinical or clinical mastitis (Dohy, 1984; Iváncsics et al, 1996; Dohy, 1999).
The demand of basic and advanced research on mastitis shows an upward tendency worldwide. The National Mastitis Council (NMC) in the USA established a National Mastitis Research Foundation (NMRF). The goal is to provide consumers with consistently high-quality, good tasting dairy products free
of chemical and pathogenic contaminants (www.nmconline.org/nrmf/nmrfinfo.htm, 2001). This phenomenon can be
accounted for people working in different sectors of the Hungarian dairy industry, too.
As a result of the facts discussed above, the Dissertation meets a long-felt want since reports on similar experiments were carried out in areas affecting udder and cow health and milk quality in order to protect the image of milk as one of nature’s most complete foods.
Aims
This work aims to study the genetic and bacteriological aspects of udder health and carry out applied research related to milk quality.
Special attention follows:
• the role of some factors (environment and sire) on milk production and quality of milk (somatic cell count) in different stocks (Holstein Friesian and Hungarian Spotted),
• evaluation the effect of genotype – resistance (within and across breeds),
• examination of the bacteriological status,
• the comparison of some screening methods,
• the applicability of flow cytometry.
Thereafter, experiments conduct to identify the substances responsible for the observed effects according to regular and advanced technology of cattle breeding and milk production.
2. MATERIALS AND METHODS
2.1. BREED AND GENOTYPE DIFFERENCES The objectives of this part of the dissertation were:• to study the effect of environment on production and milk quality,
• to determine the differences among the value of some sires in the respect of milk yield and SCC in selected stocks (Hungarian Spotted and red Holstein Friesian cows),
• to calculate correlations between mastitis resistance (presented by SCC and SCS) and milk yield.
2.1.1. Quantity – quality: Simmental and crossbreed cows
To study the value of sires in the respect of milk yield and SCC and correlations between mastitis resistance (presented by SCC and SCS) and milk yield farms were selected from an initial group of 9. Information from a background questionnaire was used to select farms with similar management practices and operational procedures. At last, 2 stocks keeping Simmental (Hungarian Spotted) cattle were chosen. To preserve anonymity, stocks were assigned a reference letter like A and B.
Milk yield and SCC data from the Livestock Performance Testing Ltd., Gödöllő (Hungary) between January 1996 and September 1997 was calculated of 305 days of lactations contained 66 and 32 cows respectively. Herd-year-season- calving age at first calving effects were not taken into consideration. The existing differences among progeny groups of some sires were studied. Biometric calculations were processed by Microsoft Excel 97 and BIO MATE softwares.
Student’s t-test was used for comparison of means. A P value of 0.1 (***), 1 (**), 5 (*) and 10 (+) (and NS=not significant) was considered as significant.
2.1.2. Quantity – quality: red Holstein Friesian cows
To study the value of sires in the respect of milk yield and SCC and correlations between mastitis resistance (presented by SCC and SCS) and milk yield 1 stock keeping red Holstein Friesian cattle was chosen. To preserve anonymity, the stock was assigned a reference letter of C.
305 days of lactations were calculated from the database from the Livestock Performance Testing Ltd., Gödöllő (Hungary) between April 1995 and
January 2002 contained 4614 lactations. Herd-year-season-calving age at first calving effects were not taken into consideration. Estimations based on SCC but data were transformed to SCS and LSCS, too. Correlations were estimated for means of SCS (LSCS) and milk yield in different lactations. The existing differences among progeny groups of some sires were studied, too. Biometric calculations were processed by Microsoft Excel 97, BIO MATE and Statistica softwares. Student’s t-test was used for comparison of means. A P value of 0.1 (***), 1 (**), 5 (*) and 10 (+) (and NS=not significant) was considered as significant.
2.2. GENOTYPE AND ENVIRONMENT
2.2.1. Hygiene
The objectives of this part of the dissertation were:
• to study the effect of environment on milk quality,
• to determine the bacterial background.
Experiments (combined with everyday routine, in every ~two month) were carried out at farm C and D keeping (red) Holstein Friesian cattle from November 1999 till the end of 2001. The so called environmental and contagious microorganisms were studied.
Samples were obtained from quarters graded 3 and K (clinical) in both stocks and were transported on ice (cool box) to the laboratory (private veterinary laboratory run by DVM Gabriella Markus – udder health specialist). Quarter milk samples were cultured for presence of bacteria and antibiotic resistance. Bulk milk samples were taken at the same time to evaluate the hygienic and udder health status of the given heard. Bulk milk samples were analysed for SCC, TPC, coliform count, S. aureus count and antibiotic residuals (detergent) and the tanks and different sites of the milking machine (teat cup, collector, milk tube etc.) also were cultured.
2.2.2. Resistance
The objective of this part of the study was:
• to evaluate the differences of incidence risk (defence mechanism) of black and red Holstein Friesian cows.
To answer the question mentioned above experiments (combined with everyday routine) were carried out in stock C and D from November 1999 till the end of 2001.
Combined with a heard mastitis control program cows with clinical signs of mastitis were selected and examined visually. Than milk samples were obtained from quarters graded 3 and K (clinical) in both stocks (and were transported for bacteriological examination). Basic data of cows were taken from the register of the stocks. Numbers of examined cows were 1503 and 898, respectively.
The number and ration of total and sampled black and red cows were calculated and comparisons were made.
2.2.3. Herd mastitis control program
The objective of this part of the dissertation was:
• to study and compare some practical screening methods.
A preliminary diagnosis was based on the health record (and calving date) of the cow and its clinical signs (if any).
The general examination included assessment of the posture, behaviour, body condition and general condition (respiratory rate, pulse frequency, rumen motility and body temperature). Then the udder itself was examined during milking at the milking parlour by inspection, palpation and examination of quarter milk secretion and milk appearance. Inspection includes the size, shape and symmetry of the udder and teats by viewing it from behind and each side.
Then the milk was examined and sample (strip test, CMT) was taken if needed.
Samples were obtained from quarters graded 3 and K (clinical) in both stocks and were transported on ice (cool box) to the laboratory (private veterinary laboratory run by DVM Gabriella Markus – udder health specialist) as described before (2.2.1.).
2.3. TOTAL AND DIFFERENCIAL CELL COUNT 2.3.1. Differential cell stain (DCS)
Milk samples were obtained from one stock of farm E which consists of ~ 600 Holstein Friesian cows aged 2 to 10 years with most animals being 4-5 years of age. Samples (n=16 x 5) were collected weekly during January – February in 2000 from individual quarters in mid lactation cows by hand stripping and were examined within 1-2 hours.
Smears of raw milk from “healthy” cows were air-dried, fixed and stained according to May-Grünwald (Reanal R6-R3). Alternatively, 5 ml of milk was added to a centrifuge tube containing 3 ml of ice-cold isotonic salt solution.
Aliquots were centrifuged at room temperature for 10 min at 2000 rpm in order to multiply cells. The supernatant, including the butterfat layer, was removed from the walls of the tube by cotton-tipped applicators and the pellet was resuspended in 0,5 ml isotonic salt solution. Smears were air-dried, fixed and stained as described before. On each slide 100 (or 200) cells were counted at magnification and identified as lymphocytes, granulocytes (neutrophils, eosinophils and basophils) or monocytes.
Approximately 10 ml of each sample were transported on ice (cool box) to the laboratory (Hungarian Dairy Research Institute at Mosonmagyaróvár).
Samples were analysed for SCC, fat, protein and lactose content, and TPC.
Means of somatic cell count and the number of different cells identified as lymphocytes, granulocytes (neutrophils, eosinophils and basophils) or monocytes were registered and correlations were calculated.
2.3.2. Differential cell count (DCC)
The objectives of this part of the study were:
• to test and adapt the use of this advanced method in the scientific and the routine animal breeding practice,
• to evaluate DCC as a tool to monitor udder health,
• to compare some different methods of sample preparation.
Individual quarter milk samples from mid lactation cows were obtained aseptically by hand stripping at one stock of farm E which consists of ~ 600 Holstein Friesian cows aged 2 to 10 years with most animals being 4-5 years of age (2.3.1.).
5 ml of raw milk sample (n=3 x 8 in duplicate, Σ 48) from so called “sic”
cows (high somatic cell count) was added to a centrifuge tube containing
• 3 ml of ice-cold isotonic salt solution,
• 2 ml of ice-cold 1% formaldehyde,
• Bromopol pills.
Aliquots were centrifuged at room temperature for 10 min at 2000 rpm in order to multiply cells. The supernatant, including the butterfat layer, was removed from the walls of the tube by cotton-tipped applicators. Followed by two more centrifugations the pellets were resuspended in 5 ml isotonic salt solution.
Samples were then sent to flow cytometric analysis using a Becton- Dickinson FACS-III flow cytometer (Becton-Dickinson Inc., USA). Cells were determined as lymphocytes, granulocytes or monocytes.
Approximately 10 millilitres of milk from cows identified as “sic”
(infected, high SCC) was obtained for bacteriological evaluation (mastitis pathogens) and somatic cell count. Milk samples from the same quarters were sent and transported on ice (cool box) simultaneously to a private veterinary laboratory at Budapest and to the laboratory of Hungarian Dairy Research Institute at Mosonmagyaróvár.
DCC data were digitalised and cell counts were analysed statistically using a spreadsheet program (Microsoft Excel for Windows).
3. RESULTS
3.1. MILK PRODUCTION: YIELD AND CELL COUNT
3.1.1. Milk yield and somatic cell count of Simmental and Holstein Friesian F1 cows in different lactations
Significant differences in fat and protein content were not found (Table 1).
However, milk production and somatic cell count present large deviations. Milk production and somatic cell count data were calculated according to stocks, progeny groups and lactations, too. Summarised milk production, means of SCC and lactation No. of progeny groups of two proven sires at stock A and B can be seen in Table 2.
Table 1. Overall means of 305 days milk production, fat and protein content, somatic cell count and average lactation No. at stock A and B (nA=66, nB=32)
Milk kg Fat % Protein % SCC Lactation Stock A 3998 *** 3.78 NS 3.28 NS 479,000 *** 3.3 * Stock B 3027 *** 3.75 NS 3.30 NS 946,000 *** 3.7 *
(level of significance: ***: P=0.1 %, **: P=1 %, *: P=5 %, +: P=10 %, NS=not significant)
Table 2. 305 days milk production, means of SCC and lactation No. of progeny groups of two proven sires at stock A and B
Stock Sire Milk kg (Σ) SCC (mean) Lactation (mean) 9117 4334 ** 737,000 *** 3.5 ***
A 8958 4043 ** 455,000 *** 1.9 ***
9117 3433 *** 547,000 *** 4.1 ***
B 8958 2894 *** 1,121,000 *** 2.1 ***
n9117A=23, n8958A=24, n9117B=10, n8958B=13
(level of significance: ***: P=0.1 %, **: P=1 %, *: P=5 %, +: P=10 %, NS=not significant)
Conclusions are as fallows:
• milk yield was higher at stock A,
• daughters of sire No. 9117 produced more milk at both stocks than daughters of sire No. 8958,
• somatic cell counts are especially high and show extreme differences,
• evaluations show that there is a lot to be desired and a lot to be done for improving udder health,
• test day somatic cell count is just a very basic step in udder health work but even the first most important.
3.1.2. Milk yield and somatic cell count of red Holstein Friesian cows in different lactations
Correlation of milk yield and number of lactation was rf=0.88. The maximum milk yield can be obtained at nlact=3.88. It reflects the importance of longevity and lifetime performance. Because of the lognormal distribution of somatic cell count data were transformed by log2. Correlation of transformed somatic cell count (called SCS) and number of lactation was rf=0.93 while correlation of 305 days milk production and transformed somatic cell count was rf=-0.12.
Test day data were processed according to the somatic cell count, too.
Taking into account the SCC lower and higher than 400,000 cells/ml during 8 test day procedures, at last 1175 and 117 observations (lactations) have left, respectively. The difference is clear but the level of significance and the ratio of 305 days production loss can be seen in Table 3.
Table 3. 305 days milk yield (and ratio of losses), SCC and its phenotypic correlation in high and low SCC groups in comparison with mean of the stock (nmean=4614, n<400=1175, n>400=117)
SCC<400,000 Mean SCC>400,000
nlact. (SD) 2.4 *** (1.5) 2.8 (1.7) 4.4 *** (2.0)
305 days milk yield (kg)
7351 ***
100%
6835 92.9%
6194 **
84.3% (90.6)
SD 1998 2200 2020
SCC x 1000 107 *** 328 1650 ***
SD 55 393 814
rf 0.06 -0.12 -0.25
(level of significance: ***: P=0.1 %, **: P=1 %, *: P=5 %, +: P=10 %, NS=not significant)
Conclusions are as follows:
• The maximum milk yield can be obtained at nlact= 3.88. It reflects the importance of longevity and lifetime performance. Correlation of milk yield and number of lactation was rf=0.88.
• Somatic cell counts are readily available to most dairy farmers today on a monthly basis through the Livestock Performance Testing Ltd., Gödöllő (Hungary). Because of the lognormal distribution of somatic cell count data were transformed by log2. (The logarithmic transformation may facilitate the international comparison of breeding value estimation of Hungarian dairy herds and therefore adaptation and home application of this method is also desirable and suggested.)
• The correlation of transformed somatic cell count (SCS) and number of lactation was rf=0.93 and the correlation of the transformed somatic cell count (SCS) and milk yield ranged from -0.5 to -0.09 in different lactations but most values were closer to the mean of -0.12 as many authors reported (Kennedy, 1982; Monardes and Hayes, 1985; Emanuelson et al., 1988; Banos and Shook, 1990; Boettcheret al., 1992). Remarkable that older cows, producing more milk, has lower somatic cell count in milk.
• The ESCC test fulfills several needs which dairymen desire. The ESCC focuses attention on the individual cow. It does not pinpoint the quarter(s) affected but does monitor udder health of individuals.
• The ESCC also allows a herd average SCC to be calculated which serves as a monitor of the udder health of the herd.
• Losses in milk production associated with elevated SCC can be estimated, too.
Reasons are lower yields and worst persistence. The differences were statistically significant.
• 25% of the cows start their lactation with high somatic cell count. Till the second test day it drops to the half.
• The ratio of healthy cows during the whole lactation is approximately 25%.
• Clinical mastitis is an expensive, management-intensive problem. Selection to improve udder health is desirable for numerous reasons. Single-trait selection for increased milk yield should result in increased susceptibility to mastitis of dairy cows. However, direct selection for reduced mastitis is not possible because mastitis incidence is not consistently recorded in majority of the cow
population. Indirect selection for lower mastitis incidence is an alternative to direct selection.
• Health professionalists and geneticists in the dairy industry have the responsibility to inform producers of the proper use of SCC evaluations.
These evaluations will in no way displace improved environmental conditions as the key ingredient in mastitis control. However, long-term trend in incidence of mastitis will have major economic implications if genetic resistance to mastitis is ignored by breeding programs. Genetic evaluations for SCC enable producers to moderate such undesirable economic consequences.
All in all, for producing high quality milk we should balance the importance of technological - environmental, biological - genetic and economic factors.
3.2. INFECTION, DEFENCE MECHANISMS AND DETECTION
3.2.1. Bacteriological environment and milking
Somatic cell counts varied widely. Individual sample counts ranged
~300,000 (from 12,000 to 7,000,000) cells/ml, whereas individual farm averages ranged from 230,000 to 420,000 cells/ml during the studied period.
Microbial contamination of bulk milk originates from three main sources:
within the udder, the teats and udder exterior, and milk handling and storage equipment. TPC presented sometimes extremely high results (450.000 cells/ml) that reflect on the luck of proper washing!
In 1996 a new milking parlour was built and in 1999 a strict udder health control program was started at stock C. Results are increased milk production and decreased somatic cell count (Figure 1). Means of number of lactation from 1995 till 2001 were 2.5, 2.7, 2.8, 2.9, 3.0, 2.8 and 3.2, respectively but considered its correlations with the milk production and the somatic cell count results are even more valuable. Reasons of differences are not (only) the increased age of the population but better environment (milking technique and hygiene) and of course, genetic improvement in production and conformation traits.
305 days milk production and somatic cell count data were extrapolated according to number of lactation, too. The used formula was y=-48.253 x2 + 375.76 x + 6280 for milk production and y=69.647 x + 140.3 for somatic cell count.
Figure 1. 305 days milk production and somatic cell count according to the first test day (year) in stock C
(n1995=675, n1996=673, n1997=694, n1998=697, n1999=642, n2000=728, n2001=463)
3.2.2. Defence system
3.2.2.1. Genotype differences (red and black)
Prevalence and detection of mastitis is much probable among black cows.
It is because of the high production and therefore, lower resistance against environment. Red cows produce less milk but their power of resistance is higher.
It is also worth to think after to balance the harmony of genotype and circumstances.
3.2.2.2. Unusual correlations (“breakers”)
In most cases, high production and high rates of mastitis are genetically correlated. The good news, however, is that not all high-production bull sire high rates of mastitis.
“Across herd” results
To compare overall means of milk production and somatic cell count of stock and progeny group of sire No. 9117 at farm A, B and C the number of lactations should always be taken into account!
0 1000 2000 3000 4000 5000 6000 7000 8000 9000
1995 1996 1997 1998 1999 2000 2001
Milk kg
0 50 100 150 200 250 300 350 400 450
SCC x 1000
305 days milk production SCC x 1000
“Within a herd” results
In stock C, 83 progeny groups of different sires were found by studying 4614 lactations. Based on pedigrees of sires closer relations can be noticed. It reflects the importance of maternal ancestry.
Conclusions are as fallows:
• Environmental factors (keeping and milking hygiene, feeding etc.) may differ but genetic trends are “constant”.
• Number of lactations and stage of lactation should be known for correct evaluation of the udder health status of a cow/progeny group/stock.
• Younger cows (1st lactation) usually produce less milk and less somatic cell in it.
• Cows in their 2nd and 3rd lactation produce a lot of milk but sometimes older cows (4th lactation) are able to produce also higher yields than the overall mean of the stock. Remarkable that older cows, producing more milk, has lower somatic cell count in milk. It reflects the importance of the value of
“correlation breaker” sires and longevity of cows.
• The ESCC also allows a SCC (and SCS) calculation, which serves as a monitor of the udder health of a progeny group average in the herd.
• Studying the pedigrees of sires closer relations can be noticed that reflect on the importance of maternal ancestry.
3.2.3. The use of a few screening methods
The first step is always inspection, while washing should include palpation, too. Inter-quarter comparison is helpful in recognizing abnormal quarters.
Milk sample can be examined first physically, then chemically and microbiology if necessary. The strip test is rapid and can easily be adapted as a part of the normal milking routine. The CMT is a practical cow-side test for detecting mastitis in milk. The CMT can be used several ways. Bulk tank, composite samples from individual cows and individual quarter samples can all be examined using this procedure. Each is valuable in monitoring udder infection.
However, the interpretation is different depending upon the type of sample. The test should be conducted at least monthly and the scores recorded to be of any value. Low test scores do not indicate absence of udder irritation but high scores do indicate that a herd problem exists and the milk supply is of poor quality.
Correct interpretation of test results requires some experience and knowledge of the cow or herd.
Electronic counting procedures have numerous advantages and disadvantages, too. The SCC program pinpoints problem cows. Management options for these cows are: selecting cows for culture, lactation treatment, dry cow treatment, milking order and culling. A monthly summary of SCS on milk samples from each cow provides an evaluation of the effectiveness of the mastitis control procedures. SCS allows measuring the reduction in subclinical mastitis as management is improved.
An effective and economic mastitis control has to rely on prevention rather than treatment by antibacterials. This recent change of the bacterial spectrum towards less virulent and less contagious organisms hint that the resistance of the cow has decreased. One should look for means to increase the endogenous resistance of the cow.
A mastitis control programme, even when successful, requires follow-up.
Bulk milk somatic cell count is a basic means for permanent monitoring of udder health. Inflammation and infection percentages on a cow and quarter basis, in addition to various health reports, are useful tools. And, only a motivated herdsman can achieve a lasting result in mastitis control.
3.3. SOMATIC CELL COUNT AND DISTRIBUTION 3.3.1. Differential staining of milk somatic cells
Fat, protein and lactose content presented “normal” samples.
Microbiological analyses (and TPC) resulted negative (first class) samples (“healthy” cows), but two. In week 4 and 5 HL (hind left) quarter of cow No. 4 had E. coli infection. This could be the reason of the elevated somatic cell count.
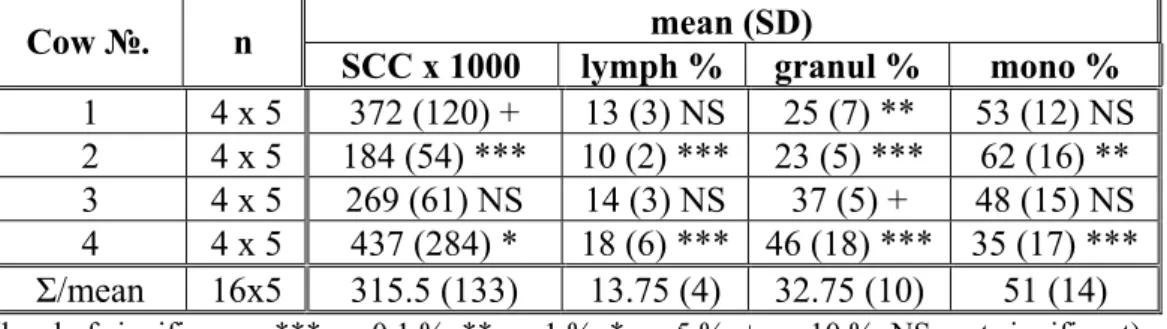
Overall means of somatic cell count (SCC) and percentages of different cell types (Figure 2-4) are given in Table 4. Correlations of SCC and ratio of cell types can be seen in Table 5.
Figure 2. Figure 3. Figure 4.
Table 4. SCC, ratio of cell types (lymphocytes, granulocytes and monocytes) and level of significance
mean (SD) Cow №. n
SCC x 1000 lymph % granul % mono % 1 4 x 5 372 (120) + 13 (3) NS 25 (7) ** 53 (12) NS 2 4 x 5 184 (54) *** 10 (2) *** 23 (5) *** 62 (16) **
3 4 x 5 269 (61) NS 14 (3) NS 37 (5) + 48 (15) NS 4 4 x 5 437 (284) * 18 (6) *** 46 (18) *** 35 (17) ***
Σ/mean 16x5 315.5 (133) 13.75 (4) 32.75 (10) 51 (14)
(level of significance: ***: p=0,1 %, **: p=1 %, *: p=5 %, +: p=10 %, NS=not significant)
Table 5. Correlations of SCC and ratio of cell types
SCC Lymphocyte Granulocyte Monocyte
SCC - 0,83 0,62 -0,83
Lymphocyte - 0,93 -0,99
Granulocyte - -0,95
Monocyte -
Conclusions are as follows:
• Each cell type has its own more or less specific function in the immune response.
• The number of lymphocytes and monocytes show higher correlation with SCC than granulocytes.
• Monocytes show a strong negative effect in comparison with SCC and the other type of cells.
• DCS is a tedious staining procedure and requires extensive training but sufficient to allow identification of cell populations in milk and appropriate for processing relatively “large” numbers of samples.
3.3.2. DCC: flow cytometric analysis of milk samples
In this study, experiment 1 and 2 produced quite similar results (Table 6).
Based on FSC and SSC dot plots three populations were identified.
“Unfortunately” we couldn’t realise bacterial infection because samples were obtained from treated (but “originally” high SCC) quarters but other studies have reported that number of lymphocytes increases significantly when there is infection of the udder.
Table 6. SCC, means, SD and level of significance of the identified populations and the bacteriological results (Exp. 1-2, n=3 x 8 x 2)
Sample SCC (x 103) Pop. I. % Pop. II. % Pop. III. % Bacter.
1 2,600 (897) NS 67 (6) NS 17 (2) NS 7 (3) NS - 2 740 (266) *** 69 (5) NS 17 (2) NS 2 (1) NS - 3 1,470 (237) ** 67 (4) NS 18 (3) + 3 (1) NS - 4 3,150 (1301) + 63 (5) + 17 (3) NS 6 (3) NS - 5 830 (325) *** 57 (3) *** 15 (1) NS 8 (2) * - 6 950 (316) *** 66 (6) NS 17 (2) NS 9 (3) ** - 7 2,330 (612) NS 82 (10) *** 11 (2) *** 1 (1) * - 8 4,860 (1563) *** 74 (9) + 18 (5) + 1 (1) * -
Mean 2,116 68 16 4.6
(level of significance: ***: p=0,1 %, **: p=1 %, *: p=5 %, +: p=10 %, NS=not significant)
Conclusions are as follows:
• The electronic SCC is the standard method for monitoring udder health at the moment but it seems to be clear that flow cytometric assay is comparable, too.
The findings of the present study suggest that DCC may develop as a good alternative or supplementary tool to SCC to evaluate udder health.
• PI in detergent may be used to stain milk cells, too.
• Formaldehyde increased the ratio of cell debris but there were no significant differences between samples treated with isotonic salt solution or Bromopol pills.
• The ratio of lymphocytes and monocytes show significant differences with SCC more often than granulocytes.
• Further studies are required to establish discrimination limits for intramammary infections.
4. NEW FINDINGS
• The negative phenotypic correlation (-0.12) of milk yield and somatic cell count refers to the very serious effect of environment. Besides, the increase of susceptibility for mastitis proposes the more widespread use of resistance breeding.
• The correlation of 305 days milk yield and number of lactations is rf=0.88 while correlation of somatic cell count (or somatic cell score as result of the logarithmic transformation of SCC) and number of lactations is rf=0.93 in the studied population. Highest milk yield was detected during the 3rd and 4th lactations that notices the importance of longevity.
• Some (older) progeny groups present lower increase of somatic cell count (because of the age of cow) even producing more milk. This means the reserve of future breeding programmes from the view of advanced progeny testing (correlation breakers).
• There are significant differences among genotypes in the respect of somatic cell count and therefore, mastitis resistance that reflects on the importance of pedigree. It is true across and within breeds (colours), too.
• Somatic cell count (score) evaluated properly, is a suitable tool not only for genetic evaluations but also for measuring of losses and furthermore, the international comparison is a realistic goal.
• Staining methods applied in the human routine work can be adopted for milk samples, too. Differential staining and flow cytometric technique may develop as a good alternative or supplementary tool to evaluate udder health.
5. SUGGESTIONS
(THE USE OF NEW FINDINGS FOR THEORETICAL AND PRACTICAL PURPOSES)
5.1. Milk production: yield and cell count
The maximum milk yield can be obtained at nlact= 3.88. It reflects the importance of longevity and lifetime performance. Correlation of milk yield and number of lactations was rf=0.88.
The correlation of transformed somatic cell count (SCS) and number of lactations was rf=0.93 while the correlation of the transformed somatic cell count (SCS) and milk yield ranged from -0.54 to -0.09 in different lactations but most values were closer to the mean of rf=-0.12. Remarkable that older cows, producing more milk, had lower somatic cell count in milk.
The number of lactations should be known for correct evaluation of the udder health status of a cow/progeny group/stock. Younger cows (1st lactation) usually produce less milk and less somatic cells in it. Cows in their 2nd and 3rd lactation produce more milk but sometimes older cows (4th lactation) are able to produce also higher yields than the overall mean of the stock. Remarkable that older cows, producing more milk, had lower somatic cell count in milk. It reflects the importance of the value of “correlation breaker” sires and longevity of cows.
Studying the pedigrees of sires closer relations can be noticed that reflect the importance of maternal ancestry.
Losses in milk production associated with elevated SCC can be estimated, too. Reasons are lower yields and worst persistence. 25% of the cows start their lactation with high somatic cell count. Till the second test day it drops to the half.
The ratio of healthy cows during the whole lactation was approximately 25%.
5.2. Infection, defence mechanisms and detection 5.2.1. Bacteriological environment and milking
There are no magic cell counts at which a cow is free from mastitis. A level of 400,000 cells per ml of milk is commonly used as a starting point for closer observation. Research has shown that over 50 percent of the cows with SCCs above this level will be infected to some degree. Cows with counts below this level may be infected since the sample is a composite from all four quarters.
Checking may be in the form of visual and CMT examination or bacteriological culture. Good hygiene is most essential in the prevention.
5.2.2. Defence system
Red cows produce less milk but their power of resistance is higher. It is also worth to think after to balance the harmony of genotype and circumstances.
5.2.3. The use of a few screening methods
Improvements in mastitis control program will appear within a few months. Perhaps the best group of cows to monitor is first lactation cows. These cows should not have SCS above 3 (100,000 cells/ml) since they are not affected as much as older cows by prior herd conditions. The percentage of cows in a herd with SCS greater than 3 for the first time is a good indicator of the success or failure of a control program.
5.3. Somatic cell count and distribution
DCS is a tedious staining procedure and requires extensive training but sufficient to allow identification of cell populations in milk and appropriate for processing relatively “large” numbers of samples.
Differential cell count (DCC) is a quite new flow cytometric technique that uses DNA-binding fluorescent dyes to identify the types of inflammatory cells present in milk. PI in detergent uniformly stains all cells with a red nuclear fluorescence. Based on linear forward scatter (size) and log side scatter (cellular complexity), cell type determination is available.
DCC may develop as a good alternative or supplementary tool to SCC to evaluate udder health. Further studies are required to establish discrimination limits for intramammary infections.
6. PUBLICATIONS
ON THE TOPIC OF THE Ph.D. DISSERTATION
1. PAPERS PUBLISHED IN SCIENTIFIC JOURNALS 1.1. In Hungarian
1.1.1. Pongrácz, L. (1999): Hegyitarka és holstein-frízzel keresztezett F1 állomány tejtermelésének és szomatikus sejtszámának alakulása különböző laktációk idején (Előzetes közlemény). Acta Agronomica Óváriensis. 41. 1., 89-100. p.
1.1.2. Pongrácz, L. – Iváncsics, J. (2001): A szomatikus sejtszám szerepe a tőgy egészségi állapotának jellemzésében. Szemlecikk Állattenyésztés és Takarmányozás. 52. 2., 155-167.p.
1.1.3. Pongrácz, L. (2001): A laktoperoxidáz-rendszer hatása a nyers tej eltarthatóságára. Tejgazdaság. 60. 2., 37-38.p.
1.1.4. Tóth L. – Pongrácz, L. –Iváncsics, J. (2001): Automatizált fejőrendszerek 1. A fejőrobot üzemeltetésének technikai és technológiai vonatkozásai. Tejgazdaság. 61. 2., 32-34.p.
1.1.5. Pongrácz, L. – Iváncsics, J. – Tóth L. (2001): Automatizált fejőrendszerek 2. A fejőrobot üzemeltetésének biológiai, fiziológiai és higiéniai vonatkozásai. Tejgazdaság. 61. 2., 35-38.p.
1.2. In English
1.2.1. Pongrácz, L. – Báder, E. – Iváncsics, J. (1999): Relationship of somatic cell count to milk yield of red Holstein Friesian cows in different lactations. Acta Agronomica Óváriensis. 41. 2., 187-196.p.
2. PAPERS PUBLISHED IN PROCEEDINGS 2.1. In Hungarian
2.1.1. Pongrácz, L.: A származás és a laktációk száma, mint befolyásoló tényezők a nyers tej mennyiségére valamint szomatikus sejtszámára egy hegyi tarkát tartó gazdaság két telepén. XXVII. Óvári Tudományos Napok. Pannon Agrártudományi Egyetem Mezőgazdaságtudományi Kar Mosonmagyaróvár, 1998. szeptember 29-30., 263-265. p.
2.1.2. Pongrácz, L. – Iváncsics, J.:. Egyszerűen kivitelezhető eljárás a tejben található szomatikus sejtek festésére. XXVIII. Óvári Tudományos Napok. Nyugat-Magyarországi Egyetem Mezőgazdaságtudományi Kar Mosonmagyaróvár, 2000. október 5-6., 255-256. p.
2.1.3. Pongrácz, L. – Iváncsics, J.:. Tejminőség – sejtmegoszlás: egyszerűen kivitelezhető eljárás. XXIX. Óvári Tudományos Napok. Nyugat- Magyarországi Egyetem Mezőgazdaságtudományi Kar Mosonmagyaróvár, 2002. október 3-4., 249-250. p.
2.2. In English
2.2.1. Pongrácz, L.: Influence of breeding on the improvement in milk quality. I.C.A. Summer School on "Agricultural Challenges and EU Enlargement". Pannon Agricultural University Faculty of Agricultural Sciences Mosonmagyaróvár. 11-21 August 1997. 253-255. p.
2.2.2. Pongrácz, L.: The regional LP programme in Central and Eastern Europe. Proceedings of the Third Annual Meeting of the Lactoperoxidase Group of Experts National Centre for Animal and Plant Health, Havana Cuba, March 25-30 2001. 11.p.
2.2.3. Pongrácz, L. – Iváncsics, J. (2001): Differential staining of milk somatic cells and the udder health. International Conference on Physiological and Technical Aspects of Machine Milking. Nitra, Slovak Republic. June 26-27 2001. ICAR Technical Series No.7. 61- 62.p.
3. ABSTRACTS OF LECTURES 3.1. In Hungarian
3.1.1. Pongrácz L: A származás és a laktációk számának hatása a nyers tej mennyiségére valamint szomatikus sejtszámára egy hegyitarkát tartó gazdaság két telepén., IV. Ifjúsági Tudományos Fórum. Keszthely, Pannon Agrártudományi Egyetem, 1998. március 19., 75-79. p.
3.1.2. Pongrácz L: Vöröstarka holstein-fríz tehenek tejtermelése és szomatikus sejtszáma., V. Ifjúsági Tudományos Fórum. Keszthely, Pannon Agrártudományi Egyetem, 1999. március 11., 233-237. p.
3.1.3. Iváncsics J. – Gulyás L. – Pongrácz L: A tej szomatikus sejtszám csökkentésének genetikai lehetőségei. IV. Magyar Genetikai Kongresszus. Siófok, 1999. április 11-14.
3.2. In English
3.2.1. Pongrácz, L. – Iváncsics, J. (2000): Simple and practical staining of milk somatic cells. International Conference on Robotic Milking, Lelystad, The Netherlands, 17-19 August 2000, 124 p.
3.2.2. Pongrácz, L. – Iváncsics, J. (2000): May-Grünwald staining of milk somatic cells. XXX. Annual Meeting of European Society for New Methods in Agricultural Research. University of Veszprém Faculty of Agricultural Science Georgikon Keszthely, Hungary, 26-30 August 2000, 35 p.
3.2.3. Iváncsics, J. – Báder, E. – Gulyás, L. – Pongrácz, L. (2001):
Improvement of quality of raw milk with selection based on somatic cell count. 52nd Annual Meeting of the European Association for Animal Production. Budapest, 26-29 of August 2001., 82. p.
4. THESES
4.1. In Hungarian
4.1.1. Pongrácz, L. (1998): A hazai minőségügy és a szaktanácsadás kapcsolata, távlati lehetőségek a tejtermelésben. Szakmérnöki Diplomadolgozat. Mosonmagyaróvár, 57. p. (lektor: Dr. Szakály Sándor, Magyar Tejgazdasági Kísérleti Intézet, Pécs)
5. PAPERS IN TECHNICAL JOURNALS 5.1. In Hungarian
5.1.1. Pongrácz, L. (2000): Tejmennyiség-tejminőség Izraelben., Holstein Magazin. VIII. 1. 45-46.p.
5.1.2. Pongrácz, L. (2000): A tőgygyulladás néhány genetikai vonatkozása és következménye., Holstein Magazin. VIII. 2. 53-54.p.
5.1.3. Pongrácz, L. (2000): Szomatikus sejtpontszám – tőgyegészségügy., Holstein Magazin. VIII. 3. 28-29.p.
5.1.4. Pongrácz, L – Tóth, L – Iváncsics, J. (2001): Fejőrobotok a gyakorlatban. Holstein Magazin. IX. 3. 8-12.p.