3.3 WAGE LEVELS, MANIFEST SHORTAGE, PLANNED AND ACTUAL PAY RISES
János Köllő, László Reszegi & István János Tóth This chapter explores the link between the wage levels in the business sec-
tor and “manifest” shortages (already created but unfilled jobs as well as ex- isting capacities unused due to the lack of skilled or unskilled workers) on the one hand, and how shortage affected planned and actual wage increases, on the other hand. We presume that firms paying wages below the market rate are more likely to complain of labour shortage and that firms facing shortages have a stronger tendency to raise wages, if they can afford it.
These questions can only be examined using a smaller sample – the database created by merging the 2015 HLMF1 and the 2015 and 2016 Wage Surveys.
Since only companies participating in all three surveys may be included in the analysis, the number of cases is smaller and may change in accordance with the presence of certain enterprise characteristics.
Wage levels and shortage
The wage levels in the business sector were assessed using the residual average wage estimate based on the data of the Wage Surveys. First, wage equations were estimated on workers in the for-profit sector using the 2015 Wage Sur- vey and the following explanatory variables: gender, labour market experi- ence and its square, the estimated number of years spent in education, sector, firm size and the county in which the plant is based. The equations were es- timated for the total sample and separately for the low qualified (completing fewer than 10 grades) and qualified (completing more) subgroups. Then the enterprise-level residual average wage was determined as the company aver- age of the differences between the observed and predicted individual wages.
Wages were measured in logarithmic form.
Positive average residual wage means that a company pays its employees bet- ter than the level expected on the basis of the above variables, while negative residual average wage means that it pays below the wage level expected on the basis of workforce composition and enterprise characteristics.
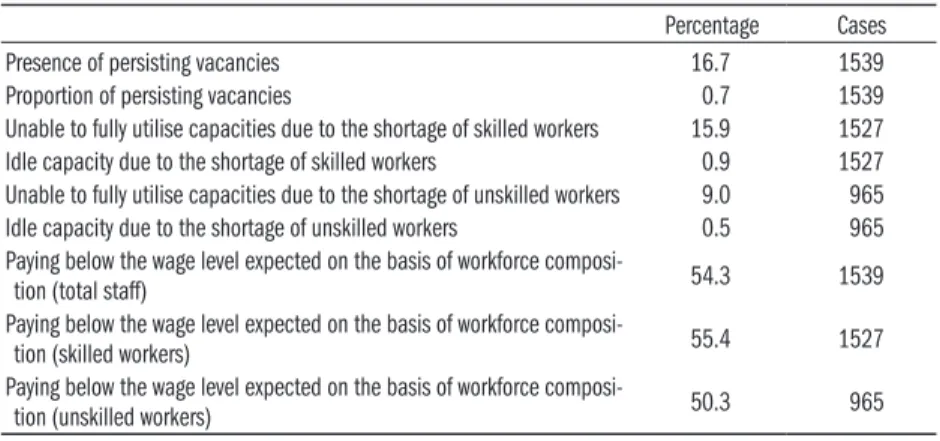
The average values of shortage indicators and the number of companies in this sample is presented in Table 3.3.1. Using linear (OLS) regressions and binary probit models, we estimated how underutilisation related to residual wage levels in 2015. It was explored how the higher or lower level of residual wage affected the shortage indicators such as the incidence and proportion of persistently unfilled vacancies as well as the incidence and extent of idle capacity attributable to labour shortage. Because of the small number of cases, equations were only controlled for one further dummy variable, measuring
1 The Hungarian Labour Market Forecast is the online database of the joint, national labour market survey of the National Ministry for Economy and the Institute for Economic and En- terprise Research of the Cham- ber of Commerce and Industry.
the occurrence of investment. The results are presented, along with a detailed explanation, in Table 3.3.2.
Table 3.3.1: The average of shortage indicators and the number of cases in the sample analysed in this chapter
Percentage Cases
Presence of persisting vacancies 16.7 1539
Proportion of persisting vacancies 0.7 1539
Unable to fully utilise capacities due to the shortage of skilled workers 15.9 1527
Idle capacity due to the shortage of skilled workers 0.9 1527
Unable to fully utilise capacities due to the shortage of unskilled workers 9.0 965
Idle capacity due to the shortage of unskilled workers 0.5 965
Paying below the wage level expected on the basis of workforce composi-
tion (total staff) 54.3 1539
Paying below the wage level expected on the basis of workforce composi-
tion (skilled workers) 55.4 1527
Paying below the wage level expected on the basis of workforce composi-
tion (unskilled workers) 50.3 965
Source: The merged database of the 2015 HLMF and the Wage Survey.
Table 3.3.2: The impact of the enterprise-level residual wage on the occurrence and the value of shortage indicators, 2015,
probit marginal effects and linear regression coefficients Impact on shortage indicator
Model cases
residual wageb investmentc
Are there vacancies? (0/1) –0.008 0.087***
Probit 1539
(0.3) (4.7)
Vacancies (proportion) –0.058** –0.005
OLS 1539
(2.5) (0.2)
Unable to fully utilise capacities due to the shortage of skilled workers (0/1)a
–0.126*** 0.087***
Probit 1527
(3.5) (4.9)
Idle capacity due to the shortage of skilled workers (proportion)
–0.119*** 0.076***
OLS 1527
(4.5) (3.0)
Unable to fully utilise capacities due to the shortage of unskilled workers (0/1)
–0.013 0.049**
Probit 965
(0.4) (2.4)
Idle capacity due to the shortage of un- skilled workers (proportion)
–0.035 0.069**
OLS 965
(1.3) (2.3)
a Idle capacity attributable to labour shortage: C = (1 – c)l, where c is the utilisation rate of capacity (0 ≤ c ≤ 1) and l is the extent of idle capacity attributable to the shortage of skilled and unskilled workers (0 ≤ l ≤1), as reported by companies.
b For estimating the enterprise-level residual average wage, see the main text. The first two blocks contain the enterprise-level residual average wage, while the others contain the residual wage estimated for the qualification groups.
c Binary variable with a value of 1 if the company made investment in 2015 and 0 if they did not make any.
T-values are provided in brackets. Standard errors were calculated using bootstrap resampling repeated 100 times. Interpreting the coefficients in the OLS (ordinary least square) model: the impact of one standard deviation of residual wage differ- ence on the shortage indicator, measured in standard deviation units. As for the
probit model: marginal effect at the sample mean. Company size was also included in the equations; however, its coefficients were close to zero and not significant, thus they are not presented here.
Note: Dependent variables: shortage indicators.
*** Significant at a 1 per cent level, ** significant at a 5 per cent level, * significant at a 10 per cent level.
Source: The merged database of the 2015 HLMF and the Wage Survey.
The results indicate that the coefficients for the residual wage are negative in each case, suggesting that manifest shortages occur more often at firms pay- ing below the market rate. However, effects are significant for only half of the indicators included. Strong effects were observed at companies paying their skilled workers below the market rate. Considering the estimated mar- ginal effects (β) and the range of residual wages (σ = 0.29), it is seen that if the average enterprise-level wage is one standard deviation unit below the market rate, it increases the probability of idle capacity attributable to labour short- age by βσ ≈ 3.5 percentage points. Results concerning unskilled workers are also negative but they are much weaker and not statistically significant. Re- sults concerning vacancies as shortage indicators are also weaker.
At a given level of residual wage, shortage occurs more frequently and is more severe at firms that have made investments. It is important to note though that this is more likely to be interdependence than causality, because investment may both alleviate or worsen shortage. Additionally, sometimes investments are made as a result of shortage.
The opposite relationship between residual wage and complaints of shortage would work against the above interpretation. A firm facing shortage would probably like to increase wages, not decrease them: this would imply a positive relationship between shortage and residual wage. Observing a negative rela- tionship between residual wages and complaints of shortage clearly indicates that there is an opposite effect: shortage arises more often at low-paying firms.
Furthermore, it is possible that wages below the market rate are compensated for by non-pecuniary benefits. However, it would be difficult to explain why these unobserved non-monetary benefits, such as above-average work condi- tions, convenient working hours, better promotion prospects and job security would entail more frequent and serious complaints of shortages. These factors, holding wages equal, tend to reduce the probability of shortage and weaken the negative relationship between residual wages and complaints.
Shortages and wage increase
The samples analysed lend themselves to investigating the relationship be- tween shortage as well as planned and actual wage increases and also how the planned and actual increases relate to each other. Corporate intentions are of interest in themselves, as they depend not only on factors determining actual wage increases but also on the expectations of businesses. Consequently, it
cannot be expected even in principle that actual wage increases would equal the intended ones. However, it is reasonably expected that the two have a sig- nificant positive relationship: that companies plan changes in the wages they offer taking account of the factors actually influencing their wages.
The analysis relies on the 2015 HLMF and the 2015 and 2016 Wage Sur- veys. The HLMF survey was conducted in September–October 2015 and it provides information on wage increases planned for 2016. The related ques- tion was as follows: “How is the average wage expected to change in 2016 (in nominal value) at your company (site) compared to the previous year?” The fig- ures for the actual wage increases obtained from the Wage Surveys also con- cern the increase in average wage between May 2015 and 2016. Although the two indicators do not exactly measure the same thing, a strong relation- ship is presumed between them, since the majority of companies raise wages in the first half of the year.
The effect of shortage indicators on planned and actual wage increases is evaluated using univariate regressions. We apply robust regression (Stata rreg) because of some extreme values in the changes of wage levels, which would imply ambiguous results in linear regression.
Table 3.3.3 suggests that it was only the presence and proportion of vacan- cies as well as the occurrence of idle capacity attributable to the shortages of skilled workers that affected 2016 wage increase plans. It may additionally con- tribute to the positive correlation that some factors (market opening, launch- ing a new factory or shift) can result both in wage increase and (temporary) shortage at the same time.2 However, effects are very weak even in univariate equations not controlled for additional effects: companies reporting vacancies in 2015 had only 0.7 percentage point faster wage increases for 2015–2016 than companies not complaining of shortages.
What is even more striking: complaints of shortage did not result in faster actual wage increase in any of the cases, compared to companies not report- ing shortages – coefficients are positive in each case but not significant even at a 10 per cent level. It is partly due to the fact that planned and actual wage increases had a positive but loose relationship. When regressing the actual figures to the forecast (using a robust model again), the coefficient obtained is 0.31 and significant at 1 per cent level, that is, a one per cent faster planned wage increase was likely to result in an actual wage increase faster by only one- third of a per cent.3
Ideally, the relationships touched upon herein should be investigated us- ing a sample that allows more detailed analysis. However, such data are not available: at present, the merged database of the 2015 HLMF and the 2015 and 2016 Wage Surveys is the largest, most recent and most reliable sample suitable for analysis. These data do not suggest a strong relationship between manifest shortage reported by firms and the pace of wage increase.
2 However, the qualitative re-However, the qualitative re- s u l t s r e m a i n t h e s a m e when a variable for firm size is also included in the model.
3 Th is is not modifi ed by includ-This is not modified by includ- ing investment or company size.
Table 3.3.3: The effect of the 2015 shortage indicators on the 2016 planned and 2015–2016 actual corporate average wage increase – robust regression
coefficients
Effect on the The mean and the standard deviation of the shortage
indicator
planned actual
wage increase measured at the logarithmic point
Are there vacancies? 0.007*** 0.003 0.172
(3.1) (0.32) ..
Proportion of vacancies 0.064** 0.105 0.007
(2.0) (0.66) (0.025)
Unable to fully utilise capacities due to the shortage of skilled workers (0/1)
0.004* 0.006 0.159
(1.8) (0.6) ..
Idle capacity due to the shortage of skilled workers (shortage)
0.016 0.134 0.009
(0.6) (1.0) (0.294)
Unable to fully utilise capacities due to the shortage of unskilled workers (0/1)
–0.000 –0.007 0.090
(0.1) (0.5) ..
Idle capacity due to the shortage of un- skilled workers (proportion)
–0.013 0.041 0.005
(0.3) (0.2) (0.021)
The mean and the standard deviation of
wage increase 0.022 0.076
Number of observations 869 869
Note: Dependent variables: shortage indicators. Actual wage increases were calcu- lated based on the average wage level of the business sector in May 2015 and 2016.
Source: The merged database of the 2015 HLMF and the 2015 and 2016 Wage Sur- veys.
Shortcuts for alleviating shortages
The above findings do not reveal everything about the impact of labour short- age on wages (and other forms of remuneration) for several reasons. Firstly, due to the lack of data, it is not possible to assess the changes in the wage lev- els of firms which do not face manifest shortage but still regard the workforce as a factor limiting their development. Secondly, the relationship between wage increase and shortage is not unidirectional: shortage in the past may lead to wage increase, which mitigates shortage. Simultaneity bias could only be avoided if we had variables which influence shortage but do not influence wage increase plans. However, we did not find such potential “instruments”
in the available databases. Thirdly, some of the firms facing recruitment dif- ficulties attempt to find solutions other than wage increase to alleviate short- age. Less productive companies, unable to raise wages, are easily prompted by lack of prospects to find grey, unlawful solutions.
A wide range of firms may be tempted to do that. The value added per head is 50 per cent lower at Hungarian companies in manufacturing and 60 per cent lower at Hungarian companies in the construction industry and ICT services than at foreign-owned companies (HCSO, 2017). Some of the for-
eign-owned companies – primarily the ones employing assemblers, machine operators and semi-skilled workers on the minimum wage – also offer below- average wages and this circle is more characterised by the value added per head typical of Hungarian firms (Reszegi–Juhász, 2013). These firms find it diffi- cult to raise wages without risking going under. However, if they do not raise wages, the disadvantages arising from low productivity cumulate in a tighter labour market. Their headcount decreases because of the workforce drain of more productive firms. This erodes their earlier investments, the number of their vacancies increase and so does the proportion of fixed costs, while their revenues decrease, reducing their investment opportunities, including pro- ductivity enhancing investments, which would replace workforce. The only legal way for these firms would be development and innovation – they have also had the opportunity before, by relying on subsidised loans, for example in the Funding for Growth Scheme. Not having taken advantage of this op- portunity suggests management problems. And firms trapped in a vicious cir- cle are more likely to opt for grey or black, unlawful solutions.
This process is difficult to illustrate by data; thus we only provide some ad- ditional input in order to describe it. The source of information is primarily interviews with executives and the examples also come from them.
“All the workers are fast like hell, I don’t want to work here”, said an entrant after the probationary period as a good-bye to the manager of an exceptionally productive factory although he was offered a gross salary of HUF 300 thou- sand [about 970 Euro] for semi-skilled work. “I don’t dare to discipline work- ers ignoring instructions because I’m afraid they’ll quit”, explains the executive of another company. “In autumn, there are so many workers on sick leave as if there was an epidemic – because it is harvest time. I know if someone is not ill but I don’t want to check on him otherwise he might quit, although this absenteeism breaks up production”, says the executive. The question of an ap- plicant for a logistics job at the job interview: “Do I also have to pack goods and work with a forklift? I thought I’d just have to sit at the computer in the office all day”. “I must leave to earn more because workers are paid less here”, says a worker changing jobs every three or four years.
In addition to involuntary lenience with workers, unlawful ways also emerge, which owners blame on the struggle for survival, excusing themselves. Several firms do not register workers as a full-time, fully paid employee: the job is of- ficially reported as a part-time job, while in reality it is full time and the dif- ference is paid out off-the-books. This practice is frequent in trade, catering and hospitality. Overtime is often compensated in another way because pay- ing it would be twice as expensive. “I didn’t understand why I have to tell the net pay to applicants at interviews. Then I asked a thirtysomething applicant who answered that because he had never been registered as a full time em- ployee!” All these are paid out from unlawful sales, made without issuing an
invoice, or purchasing bills of costs, or from the dividends at best. If shortage becomes prevalent, this kind of unlawful behaviour will probably proliferate among less productive firms.
* * *
Considering that the direct analysis of the relationship between labour short- age and wages, based on enterprise-level data, can only be performed using small samples and a limited set of variables, the next subchapter will explore indirectly, over a longer time-frame and based on individual data, whether the trends in wages reflect intensifying labour shortage.
References
KSH (2017): Egy főre jutó hozzáadott érték nemzetgazdasági ág és a végső tulajdonos székhelye szerint (2008–). (Value added per head according to sector and the site of the ultimate owner). HCSO, Budapest.
Reszegi László–Juhász Péter (2013): A vállalati teljesítmény nyomában (Tracking corporate performance). Alinea, Budapest.