Contents lists available atScienceDirect
Vision Research
journal homepage:www.elsevier.com/locate/visres
Electrodiagnosis of dichromacy
Mirella Telles Salgueiro Barboni
a,b,⁎, Einat Hauzman
a,e, Balázs Vince Nagy
a,d,
Cristiane Maria Gomes Martins
a, Avinash J. Aher
c, Tina I. Tsai
c, Daniela Maria Oliveria Bonci
a,e, Dora Fix Ventura
a,e, Jan Kremers
c,faDepartment of Experimental Psychology, University of Sao Paulo, Brazil
bDepartment of Ophthalmology, Semmelweis University, Budapest, Hungary
cDepartment of Ophthalmology, University Hospital, Erlangen, Germany
dDepartment of Mechatronics, Optics and Engineering Informatics, Budapest University of Technology and Economics, Budapest, Hungary
eInstituto Israelita de Ensino e Pesquisa Albert Einstein, Sao Paulo, Brazil
fDepartment of Biology, Animal Physiology, FAU Erlangen-Nürnberg, Erlangen, Germany
A R T I C L E I N F O
Keywords:
Electroretinogram Visual evoked potential Color vision Cone-isolating stimulus Silent substitution Spectral compensation Opsin gene
A B S T R A C T
Retinal and cortical signals initiated by a single cone type can be recorded using the spectral compensation (or silent substitution) paradigm. Moreover, responses to instantaneous excitation increments combined with gra- dual excitation decreases are dominated by the response to the excitation increment. Similarly, the response to a sudden excitation decrement dominates the overall response when combined with a gradual excitation increase.
Here ERGs and VEPs were recorded from 34 volunteers [25.9 ± 10.4 years old (mean ± 1 SD); 25 males, 9 females] to sawtoothflicker (4 Hz) stimuli that elicited L- or M-cone responses using triple silent substitution.
The mean luminance (284 cd/m2) and the mean chromaticity (x = 0.5686, y = 0.3716; CIE 1931 color space) remained constant and thus the state of adaptation was the same in all conditions. Color discrimination thresholds along protan, deutan, and tritan axes were obtained from all participants. Dichromatic subjects were genetically characterized by molecular analysis of their opsin genes. ERG responses to L-cone stimuli were absent in protanopes whereas ERG responses to M-cone stimuli were strongly reduced in deuteranopes. Dichromats showed generally reduced VEP amplitudes. Responses to cone-specific stimuli obtained with standard electro- physiological methods may give the same classification as that obtained with the Cambridge Colour Test and in some cases with the genetic analysis of the L- and M-opsin genes. Therefore, cone-specific ERGs and VEPs may be reliable methods to detect cone dysfunction. The present data confirm and emphasize the potential use of cone- specific stimulation, combined with standard visual electrodiagnostic protocols.
1. Introduction
Visual electrodiagnosis has been long used in diseases of the central nervous system (Arden, 1967) because it allows non-invasive record- ings of neural activity initiated by photoreceptor stimulation in vivo.
The International Society of Clinical Electrophysiology of Vision (ISCEV) has standardized several procedures that are periodically up- dated, to evaluate the functional integrity of the visual system (Bach et al., 2013; Hood et al., 2012; McCulloch et al., 2015; Odom et al., 2016). Retinal and cortical electrophysiological recordings are often obtained with white light stimuli. In the electroretinogram (ERG), short flashes elicit an initial negative a-wave, representing the activation of the photoreceptors and OFF-bipolar cells (photopic), followed by a larger positive b-wave related to the activation of ON-bipolar cells and
Müller cells (Berson, Gouras, & Gunkel, 1968; Berson, Gouras, Gunkel,
& Myrianthopoulos, 1969; Brown, 1968; McCulloch et al., 2015). Visual evoked cortical potentials to a single-flash stimulation generate earlier (minor) and later (major) components (Odom et al., 2016). The stan- dard clinical protocols are useful for the differential diagnosis of several diseases affecting specific groups of cells in the retina such as cones or rods, or specific visual processes related with either the amplitude or time to peak of cortical responses. However, these clinical procedures do not take into account the contribution of cone subtypes (i.e. S-, M- or L-cones) to the signals. Additionally, they are not designed to access specific post-receptoral mechanisms, such as the ON- and OFF-path- ways.
Previous studies have demonstrated that retinal photopic responses using long-duration flash stimulation show an initial negative
https://doi.org/10.1016/j.visres.2019.02.011
Received 9 November 2018; Received in revised form 13 February 2019; Accepted 17 February 2019
⁎Corresponding author at: Department of Experimental Psychology, University of Sao Paulo, Av. Prof. Mello Moraes, 1721, 05508-030 Sao Paulo, Brazil.
E-mail address:mtsbarboni@gmail.com(M.T.S. Barboni).
0042-6989/ © 2019 Elsevier Ltd. All rights reserved.
T
component followed by a positive component (resembling but not completely equivalent to the a- and the b-waves of the short-flash ERGs) to stimulus onset while the response to light decrement shows only a positive component which is called the d-wave (Sieving, 1993; Sustar, Hawlina, & Brecelj, 2006). These ON- and OFF-responses are also eli- cited with rapid-on and rapid-off sawtooth modulation around the mean luminance, respectively. They are less burdening for the ob- servers than long-flashes and thus less disturbed by blinks and squints.
These electrophysiological protocols can be useful to evaluate asym- metrical impairment of ON- and OFF- post-receptoral visual pathways (Alexander, Barnes, Fishman, & Milam, 2002; Alexander, Fishman, Barnes, & Grover, 2001; Barboni et al., 2013; Pangeni, Lämmer, Tornow, Horn, & Kremers, 2012; Tsai, Barboni, et al., 2016). However, these signals are initiated by a combined and in-phase stimulation of all cone types. Since it is well known that some visual conditions affect differently specific cone types (Kellner & Foerster, 1992; Nathans, Piantanida, Eddy, Shows, & Hogness, 1986), it is more informative to access specific cone contributions to the post-receptoral ON- and OFF- mechanisms.
The spectral compensation paradigm (Estévez & Spekreijse, 1982) allows the stimulation of the L- or the M-cone while silencing the other types of photoreceptors (the amount of excitation of non-stimulated photoreceptors is held constant in stimulus and background). The sti- mulus method can be combined with square wave or sawtooth mod- ulation and has been implemented in visual electrophysiology (Brainard, Calderone, Nugent, & Jacobs, 1999; Kremers, 2003). It was already demonstrated that ERG responses to selective L-cone excitation increments and decrements are similar in shape to those obtained with luminance increments and decrements respectively. On the other hand, ERG responses to M-cone isolating increments and decrements are an- tagonistic: the responses to M-cone excitation increments resemble those to L-cone (and luminance) decrements andvice versa. Additional evidence that this is caused by L/M opponency comes from thefinding that the responses in protanopes to M-cone isolating stimuli are not sign-inverted relative to the L-cone driven responses in trichromats (Kremers et al., 2014; McKeefry et al., 2014; Tsai, Jacob, et al., 2016).
The L-/M-opponency is also present in VEP responses (Barboni et al., 2017), pupillary reflexes (Murray, Kremers, McKeefry, & Parry, 2018; Woelders et al., 2018) and psychophysical data (Parry, McKeefry, Kremers, & Murray, 2016). Moreover, subjects with congenital color vision deficiencies show near to absent VEP and ERG responses when the absent cone type is selectively stimulated (Barboni et al., 2017;
Crognale, Rabin, Switkes, et al., 1993, Crognale, Switkes, Rabin, et al., 1993; Kremers et al., 2014; McKeefry et al., 2014; Tsai, Barboni, et al., 2016).
The above-described studies indicate the potential use of these non- invasive electrodiagnostic procedures to precisely investigate the sites of visual impairment. The aim of the present study is to compare in- dividual data obtained from different methods in order to investigate cone-specific function and dysfunction. To reach the aim we recorded cone driven ERGs and VEPs from a large group of subjects with normal color vision as well as subjects with hereditary color vision deficiency and compared the individual electrophysiological data with each other, with psychophysical color vision thresholds and with molecular ana- lysis of the opsin genes, as previously proposed (Crognale, Teller, Motulsky, & Deeb, 1998). Parts of these results were presented during the 24th symposium of the International Color Vision Society (ICVS 2017) in Erlangen (Germany).
2. Materials and methods 2.1. Participants
The experiments adhered to the tenets of the Declaration of Helsinki and were approved by the ethics committee of the University Hospital, University of São Paulo, Brazil (CEP-HU/USP 156.826). Signed
informed consent was obtained from each subject after explanation of the nature and possible consequences of the study. Participants were 34 volunteers separated into three groups according to their color dis- crimination thresholds obtained with the Cambridge Colour Test (CCT):
23 trichromats [23.2 ± 7.9 years old (mean ± 1 SD); 15 males and 8 females];five protanopes (34.2 ± 18.7 years old; 4 males and 1 fe- male); and six deuteranopes (29.5 ± 6.4 years old; all males).
Inclusion criteria were: best-corrected visual acuity of at least 20/
20, the absence of ophthalmological diseases as well as systemic dis- eases that could affect the visual system (such as diabetes mellitus). The subjects were recruited among students and workers at the University of Sao Paulo (Brazil). When recruiting the volunteers, we especially looked for subjects with self-reported and/or known color vision defi- ciencies. Part of the study population participated in a previously published study (Aher et al., 2018).
2.2. Visual stimulation
A Ganzfeld bowl (Q450SC; Roland Consult, Brandenburg, Germany) equipped with six arrays of differently colored light-emitting diodes (LEDs) was used as a stimulator. As previously described (Barboni et al., 2017; Kremers et al., 2014; Tsai, Barboni, et al., 2016), four LED arrays were used: red (peak wavelength ± half width at half max- imum = 638 ± 9 nm), green (523 ± 19 nm), blue (469 ± 11 nm), and amber (594 ± 8 nm). The luminance of each LED array was modulated with rapid-on or rapid-offsawtooth profiles. Mean lumi- nance, temporal frequency, modulation depth, and phase of each LED were independently controlled by the RETiport software (Roland Con- sult, Brandenburg, Germany).
The luminance for the red, green, blue and amber diodes were 80, 40, 4 and 160 cd/m2respectively. The total mean luminance (284 cd/
m2; resulting in about 14,200 ph td and 5600 scot td assuming an 8 mm diameter pupil) and the mean chromaticity (x = 0.5686, y = 0.3716;
CIE 1931 color space), and thus the state of adaptation, were the same for all stimulus conditions. The mean (yellow) chromaticity was chosen in order to obtain maximal and equal L- and M-cone contrasts. We may consider that inputs to the S-(L + M) pathway may affect VEP responses in trichromats. The temporal frequency was always 4 Hz.
The stimuli were triple silent substitution conditions (i.e. the ex- citation of three photoreceptor types, including the S-cones and the rods, was not modulated) thereby isolating the output of the L- or the M-cones. The cone contrasts in L- and M-isolating stimuli were 18% and 17% respectively. Cone contrast is defined as the Michelson contrast, e.g. (ELmax−ELmin)/(ELmax + ELmin) in which ELmax and ELmin are the maximal and minimal L-cone excitation respectively. Two modes of temporal modulation of cone-excitation were used: rapid-on (incre- ments) and rapid-off(decrements). In increments, each cycle consisted of an abrupt increment in cone excitation, to activate the ON me- chanism, followed by a linear decrease in excitation (observe that this also includes a rapid deactivation of the OFF mechanisms). Decrement profiles were the opposite, to activate the OFF mechanism.
2.3. Electrophysiological recordings
ERG and VEP responses were simultaneously recorded using monocular stimulation of one randomly chosen dilated (one drop of 0.5% tropicamide) eye. For the ERG recordings, a DTLfiber electrode attached to the outer and the inner canthus of the eye was used as the active electrode and gold cup skin electrodes were used as reference and ground electrodes attached to the ipsilateral temple and the fore- head, respectively. For the VEP recordings, gold cup skin electrodes were used as the active electrode (Oz position), as reference electrode (Fz position), and as the ground electrode (placed on the forehead and also used for the ERG recordings). The ERG and VEP signals were amplified 100,000×,filtered between 1 and 300 Hz, and sampled at 1024 Hz using the RetiPort system (Roland Consult, Brandenburg,
Germany). At least 20 episodes, each lasting one second, were aver- aged. Thefirst two seconds of each recording were discarded to avoid onset artifacts. The impedances between the electrodes were below 5 kΩ.
2.4. Color vision test
Type of color vision (trichromatic, protanopic, or deuteranopic) was determined using the Cambridge Colour Test (CCT) (Regan, Reffin, &
Mollon, 1994). The CCT is a psychophysical test that determines color discrimination thresholds along different directions in the CIE 1976 color space (Mollon & Reffin, 1989). The test was performed using a Sony FD Trinitron color monitor GDMF500T9 (Sony Electronics, Tokyo, Japan; 100 Hz temporal resolution and 800 × 600 spatial resolution) and a VSG 5 graphics card (Cambridge Research Systems, Rochester, United Kingdom) controlled by the CCT version 2.0 software (Cam- bridge Research Systems, Rochester, United Kingdom) (Regan et al., 1994).
The stimuli were pseudoisochromaticfields composed of discs with a given chromaticity varying in size (between 5.2 and 22.8 arcmin) and in luminance (between 7 and 15 cd/m2). The chromaticity of the discs forming the background was constant (u′= 0.1977, v′= 0.4689; CIE 1976), while the chromaticity of the discs forming the target (a Landolt
“C”) was set at specific points in the CIE diagram and varied during the presentations.
In order to determine the thresholds for discriminating target and background chromaticities, a maximum excursion of 0.110 units and a minimum excursion of 0.002 units in CIE color space were used. A four- alternative (up, down, left, and right) forced choice (4AFC) procedure was used and the chromaticity of the target was changed according to staircase procedures in which step sizes decreased after a reversal in the direction in the CIE space. After 11 reversals, a threshold was calculated (as the means of the target chromaticities at the last 7 reversals).
Thresholds were obtained for protanopic, deuteranopic, and tritanopic confusion axes. The three axes were tested in random order during a single session. Results are given as the difference between the chro- maticity of the background and the average chromaticity of the threshold. The chromaticity difference of thefinal result was quantified by the multiplication of the threshold excursion by 10,000 (u′v′* 104).
Only participants showing color discrimination thresholds below 100 along protan and deutan axes and below 150 along the tritan axis were considered trichromats.
2.5. Genetic analysis
The L and M opsin genes of the subjects with color vision defi- ciencies were screened by extracting DNA samples from buccal brushes using the Gentra Puregene Buccal Cell Kit (Gentra Systems, Inc., Minneapolis, Minn., USA), according to the manufacturer’s protocol.
Polymerase chain reactions (PCR) were performed to amplify a frag- ment of about 300 base pairs containing the exon 5 of the X-linked (L and M) opsin genes, using primer pairs and protocols described byNeitz and Neitz (1995). We used restriction endonuclease Rsa I (Invitrogen, Carlsbad, USA) to digest and separate the two genes that were observed in electrophoresis at 1.0% agarose gel. The restriction endonuclease Rsa 1 recognizes a specific nucleotide sequence (GT-AC), which is present in exon 5 of the L-gene, but not in the M-gene. Thus, the enzyme re- cognizes and cleaves the amplified exon 5 of the L-gene in two smaller fragments, while the M-gene, not recognized and cleaved by the en- zyme, displays only one band (Neitz & Neitz, 1995).
When two opsin genes were detected, we performed new rounds of PCRs to amplify the exons 2, 3, and 4 of both genes in order to search for polymorphisms. The primers and PCR conditions were described by (Neitz et al., 2004). PCRs were carried out in 50 µl reactions, using High Fidelity Platinum Taq Polymerase, 10× High Fidelity Buffer, 10 mM GeneAmp dNTPs (Applied Biosystems, Inc., Foster City, USA), MgCl2
(Invitrogen, Carlsbad, USA), and 20 mM primers. PCR products were visualized by electrophoresis in 1.0% agarose gel and purified with Il- lustra GFX™PCR DNA and Gel Band Purification Kit (GE Healthcare, Little Chalfont, UK). Genetic sequencing was performed directly in both directions, using the BigDye® Terminator v3.1 Cycle Sequencing Kit (Applied Biosystems, Inc.) and the 3500 Applied Biosystems Sequencer.
The electropherograms were visualized and aligned in BioEdit v7.0.9.0 (Hall, 1999).
2.6. Data analysis
Electrophysiological signals were analyzed offline using self-written MATLAB programs and Excel routines. Prior to further analysis, a notch 60 Hz offlinefilter was applied to the signals to reduce intrusion from the mains. Subsequently, the four cycles of each signal lasting 1000 ms (1024 points) were averaged in order to obtain a single cycle of 250 ms signal. Amplitudes (µV) and times to peak (ms) of each individual ERG responses were analyzed (see components analyzed inFig. 2). Ampli- tude and time to peak of thefirst negative component (in the L-incre- ment: NLI and M-decrement: NMD conditions) were analyzed by se- lecting the minimum in a 0 to 20 ms time window. The amplitude was calculated from the baseline (average voltage of thefirstfive ms of the signal). The first positive component was analyzed for all ERG re- sponses (PLI, PLD, PMI, PMD). The positive peak was the maximum be- tween 25 and 50 ms (for PLIand PMD) and between 15 and 30 ms (for PLDand PMI). The positive amplitudes were calculated from the pre- viously analyzed negative peak (for PLIand PMD) or from the baseline (for PLDand PMI) to the positive peak.
Total deviations, defined as sum of the absolute values of the dif- ferences between the baseline and the measured voltage at each time stamp of the signal between 50 and 150 ms after the sudden change in the stimulus (the average voltage of thefirst and the lastfive ms of the VEP signal), were used as a measure for VEP amplitude.
To obtain an estimate of the signal to noise ratio (SNR) the ampli- tude of the fundamental harmonic (4 Hz) was divided by the average amplitude of the neighboring frequencies (3 Hz and 5 Hz) provided by a Fast Fourier Transform (FFT). Responses with SNR (Meigen & Bach, 1999) less than two were considered to be non-significant, and the delay times of the response components were discarded.Meigen and Bach (1999) recommended an SNR of 2.82 for a significant signal.
However, this recommendation was solely based on response ampli- tudes. We noticed that implicit times and phases were in the expected range when comparing to larger responses for responses with SNR down to 2.0.
We calculated the ratios between L- and M-cone driven responses (LI/MDand LD/MI), taking into account the previously described L/M opponency in ERG (Tsai, Jacob, et al., 2016) and VEP (Barboni et al., 2017) responses to cone isolating stimulus. The ratios were calculated by dividing the respective positive amplitudes for the ERGs and the total deviations for the VEP.
Statistical comparisons (SPSS, Statistical Package for the Social Sciences, Hong Kong, China) were performed using ANOVA and Bonferroni post hoc correction for multiple testing.
3. Results
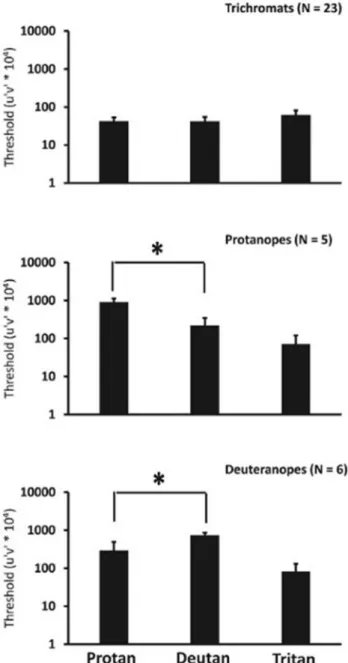
The results (average and one standard deviation) of the psycho- physical CCT are shown inFig. 1. The upper graph shows averages ( ± one standard deviation) of color discrimination thresholds from 23 subjects. These values were within the normal range of color dis- crimination thresholds for the three axes (protan, deutan, and tritan) with no significant difference between thresholds along the protanopic (average = 41.6 ± 11.5) and the deuteranopic confusion lines (average = 41.0 ± 13.6) (p = 0.89). The color vision of these subjects was classified as normal trichromatic.
Five subjects showed (middle graph) significantly higher thresholds
along the protanopic confusion lines compared to their thresholds along the deuteranopic confusion lines (p = 0.001) and they were classified as protanopes. The remaining six subjects showed (lower graph) thresholds along deuteranopic confusion line that were significantly higher (p = 0.001) than those along the protanopic confusion lines thresholds and the subjects were considered to be deuteranopes. All dichromats displayed higher thresholds along the two confusion lines protan (p < 0.001) and deutan (p < 0.006), but not along the tritan confusion line (protanopes p = 0.9 and deuteranopes p = 0.4) when compared to trichromats. Average results from the subjects with normal color vision as well as the individual results from the protanopes and the deuteranopes are summarized inTable 1.
Genetic analysis was used to estimate the opsins’λmax(nm) from each of the 11 dichromats. The estimate was based on the amino acid composition, at the sites that determine the spectral tuning (Asenjo,
Rim, & Oprian, 1994).Table 1shows the age and gender of the subjects, CCT results, expressed opsin gene with the respectively estimatedλmax, and the genetic sequencing of exons 2, 3, and 4.
Allfive protanopes (P1–P5; four males and one female) had one or more M-opsin genes and no L-genes. The genetic sequencing of exons 2, 3, and 4 showed that one protanope (P2) had one hybrid M-opsin gene resulting in an expectedλmaxof 538 nm, instead of the normalλmaxof 532 nm. In addition, another protanope (P3) had at least two copies of the M-opsin gene: one normal and one hybrid, but both resulting in photopigments with expectedλmaxvalues at 532 nm.
Deuteranopes D3 and D5 only had L-opsin genes with expectedλmax
of 563 nm. Two deuteranopes (D1 and D2) had hybrid L-opsin genes resulting in photopigments with expected λmax values at 556 and 559 nm, respectively. The remaining two deuteranopes (D4 and D6) had at least one copy of each (L- and M-) opsin gene. In one subject (D6) there were two L-genes: one normal withλmaxvalue at 563 nm and one hybrid withλmaxat 559 nm. Another deuteranope (D4) had one hybrid L-opsin gene resulting in a photopigment with expectedλmaxat 556 nm as well as one hybrid M-opsin gene with expectedλmaxat 532 that we hypothesize it has not been expressed (see discussion).
The absorption peaks (nm) of the opsins were estimated based on the amino acids located at spectral tuning sites according toAsenjo et al. (1994). A = alanine; I = isoleucine; L = leucine; M = methio- nine; S = serine; T = threonine; V = valine; Y = tyrosine.
Averaged electrophysiological traces are shown inFig. 2. Sketches of the stimuli are shown in the left column. The average ERG and VEP responses of the trichromats are displayed inFig. 2A. Their ERGs dis- play negative and positive components depending on the stimulus type.
The L-cone increment response has an initial negative peak (NLI) around 18.6 ± 2.0 ms after the instantaneous increase in excitation followed by a positive peak (PLI) after about 31.8 ± 3.1 ms. L-cone decrements elicited only one positive component (PLD) at 20.3 ± 3.5 ms. The ERG responses elicited by M-cone isolating stimuli are smaller and delayed compared to those from the L-cone driven re- sponses. Moreover, it shows more variability among healthy subjects.
The positive peak of the M-cone increment (PMI) protocol was found at about 23.8 ± 6.2 ms. M-cone decrements displayed mainly a positive component (PMD) in which peak was found at 37.9 ± 10.4 ms. These results are in agreement with previous findings (Tsai, Jacob, et al., 2016).
The VEP responses of trichromats show a positive (main) compo- nent with a delay between 50 and 150 ms. The time to peak was similar for the four stimulus types.
The averaged responses offive protanopes are shown inFig. 2B.
They displayed strongly reduced ERG and VEP responses to L-cone in- cremental and decremental stimuli. The M-cone driven ERGs in the protanopes were quite similar to the L-cone driven responses and unlike the M-cone driven responses in the trichromats.Fig. 2C displays the average traces of the deuteranopes. Their responses to L-cone stimula- tion showed similar profiles as the average response of the trichromats, although with somewhat smaller amplitudes. ERG and VEP responses to M-cone isolating stimuli were reduced in the deuteranopes, although still measurable. This has been found before (Kremers et al., 2014; Tsai, Jacob, et al., 2016) when recording full-field ERGs.
We compared results from the responses driven by the dominant cone (defined as the cone whose stimulation results in the largest re- sponse, i.e. L-cones for trichromats and deuteranopes and M-cones for protanopes).Fig. 3shows the average ( ± standard deviation) ampli- tudes (in µV) and implicit times (in ms) of ERG negative and positive components and VEP total deviations of the dominant cone responses.
Fig. 3A shows that the ERG components are similar between trichro- mats (opened dots), protanopes (grey dots), and deuteranopes (black dots). There were no significant differences for increment amplitudes of the negative (p = 0.077) and of the positive (p = 0.101) component.
Moreover, the positive components of responses to decrements were similar for the three groups (p = 0.190). The implicit times of the Fig. 1.Average ( ± one standard deviation) of color discrimination thresholds
for the three groups of volunteers: trichromats (upper graph), protanopes (middle graph), deuteranopes (lower graph). Trichromats show low thresholds for all three axes: protan, deutan, and tritan. Protanopes showed significantly elevated protan thresholds and deuteranopes showed significantly higher deutan thresholds.
negative (p = 0.053) and positive (p = 0.070) ERG components to in- crements and of the positive ERG component to decrements (p = 0.160) were also similar.
Fig. 3B shows the comparison of the total deviation of the VEP re- sponses. In trichromats, VEPs to dominant (i.e. L-) cone increments were larger than those in protanopes to M-cone stimulation (p = 0.009 and those in deuteranopes to L-cone stimulation (p = 0.002). For de- crement stimulation of the dominant cone, significantly lower total deviations were found for the deuteranopes (p = 0.042), but not for the protanopes (p = 0.182). There was no significant difference between the increment responses (p = 0.958) and decrement responses (p = 0.414) of trichromats, protanopes, and deuteranopes.
Fig. 4shows the average ( ± standard deviation) amplitudes (in µV) and implicit times (in ms) of ERG negative and positive components and VEP total deviations as in Fig. 3, for responses driven by the non- dominant cone (M-cone for trichromats and deuteranopes and L-cone for protanopes). Amplitudes of the positive ERG components (Fig. 4A) were significantly higher for trichromats compared to protanopes (in- crements: p = 0.040; decrements: p = 0.009) and deuteranopes (in- crements: p = 0.009; decrements p = 0.003). Negative ERG compo- nents were absent in the responses obtained from most of the dichromats. Implicit times were not estimated because of the absent responses of the positive components in protanopes and deuteranopes.
Fig. 4B shows the same comparison for the VEP total deviations as shown inFig. 3B, but now for the responses driven by the non-dominant cone type. In trichromats, VEPs to M-cone increments resulted in total deviation of 364 ± 166 µV while decrements resulted in larger total deviations (449 ± 238 µV) and opposite of what was found for the dominant (i.e. L-) cones (cf. Fig. 3B). Protanopes and deuteranopes showed smaller averaged total deviations to increments (protanopes
p = 0.018 and deuteranopes p = 0.008) and decrements (protanopes p = 0.003 and deuteranopes p = 0.020). However, there were no sig- nificant differences between protanopes and deuteranopes for the total deviation in the responses to increments (p = 0.553) and to decrements (p = 0.282). In trichromats, VEPs always elicited responses above the noise level in both dominant and non-dominant cone responses. How- ever, protanopes and deuteranopes showed measurable responses for the dominant cone, but more than half of the non-dominant cone re- sponses (12 out of 22) were below the noise level, and therefore absent.
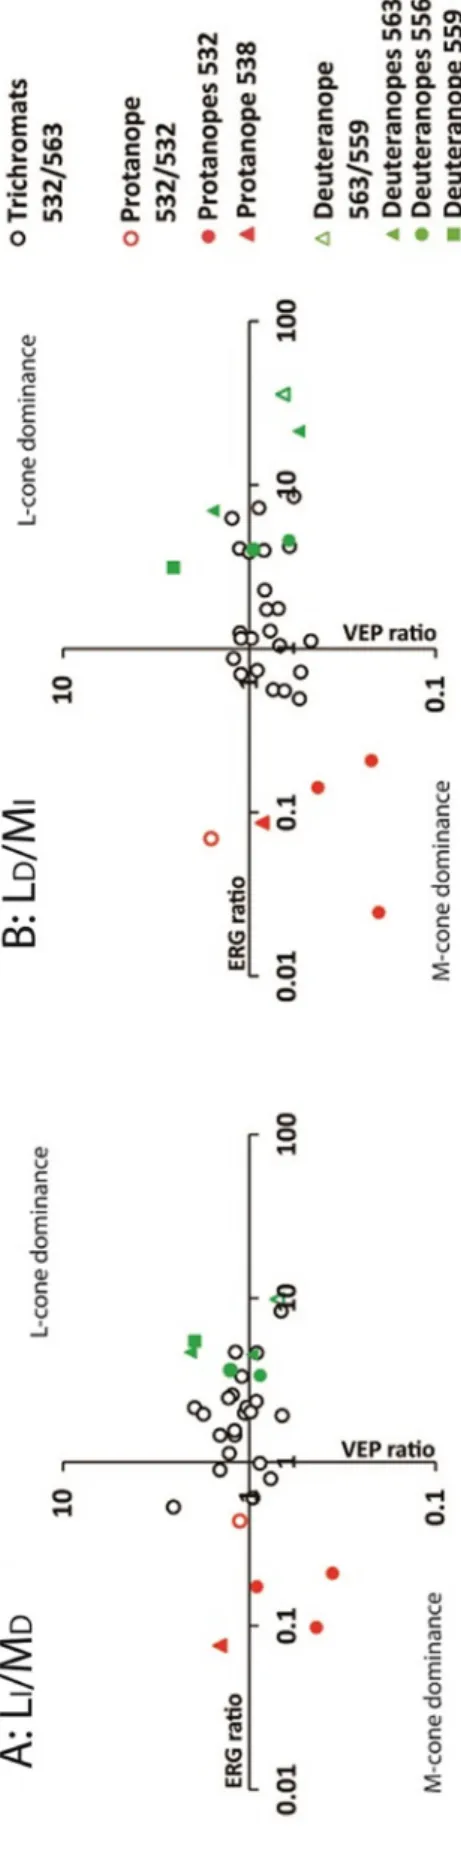
InFig. 5we plotted the ratios of the L- and M-cone driven responses in the ERGs and VEPs. The ratios were calculated considering the am- plitudes of the positive peaks (ERG) and the total deviations (VEP) using LI/MD(A) and LD/MI(B). In order to identify the estimatedλmax
(in nm) from each subject tested, different symbols were used.
ERG L/M ratios were 2.26 ± 1.72 (LI/MD) and 2.42 ± 2.31 (LD/ MI). The ERGs were L-cone dominated in the majority of the trichro- mats (black opened circles), although some trichromats showed M-cone dominated responses with L/M ratios were close to unity. L/M ERG ratios of protanopes were lower than unity showing that their ERGs were M-cone dominated. L/M ERG ratios of the deuteranopes were larger than unity, indicating that the ERGs were L-cone dominated.
Stimuli activating the non-dominant cone always elicited measur- able total deviation of the VEPs for the trichromats (Fig. 4B). Although there were no significant differences (p = 0.243 for LI/MD and p = 0.165 for LD/MI)), the L-/M-cone VEP ratios were on average 1.20 ± 0.43 (LI/MD) and 0.84 ± 0.23 (LD/MI) for trichromats, smaller than one for protanopes (LI/MD= 0.85 ± 0.46 and LD/ MI= 0.66 ± 0.9) and larger than one for deuteranopes (LI/ MD= 1.31 ± 0.58 and LD/MI= 1.15 ± 0.78).
All protanopes with one M-gene with an estimatedλmaxof 532 nm Table 1
Control average and individual dichromatic CCT thresholds and genetic results.
CCT Genetic analysis Amino acid at the spectral tuning sites
Normal color vision (N = 23)
Age Gender Protan Deutan Tritan Expressed opsin gene Estimatedλmax (nm)
Exon 2 Exon 3 Exon 4
65 111 116 153 180 230 233 236
AVE 23.2 15 males 41.6 41.0 60.5 L 563 T I S L S I A M
SD 7.9 8 females 11.5 13.6 20.7 M 532 I V Y M A T S V
Protanopes Age Protan Deutan Tritan Expressed opsin gene Estimatedλmax
(nm)
Exon 2 Exon 3 Exon 4
65 111 116 153 180 230 233 236
P1 36 male 1100 266 30 M 532 I V Y M A T S V
P2 66 male 1100 422 155 M-hybrid 538 T V S L S I A V
P3 23 male 658 144 64 M 532 I V Y M A T S V
M-hybrid 532 T I S M A T S V
P4 21 female 752 99 45 M 532 I V Y M A T S V
P5 25 male 965 168 63 M 532 I V Y M A T S V
AVE 34.2 915.0 219.8 71.4
SD 18.7 202.2 128.5 48.8
Deuteranopes Age Protan Deutan Tritan Expressed opsin gene Estimatedλmax
(nm)
Exon 2 Exon 3 Exon 4
65 111 116 153 180 230 233 236
D1 33 male 227 849 29 L-hybrid 556 T I S M A I A M
D2 24 male 377 687 145 L-hybrid 559 T V Y L S I A M
D3 39 male 325 953 68 L 563 T I S L S I A M
D4 24 male 364 1003 114 L-hybrid 556 T I S L A I A M
M-hybrid 532 I V Y L A T S V
D5 33 male 282 469 78 L 563 T I S L S I A M
D6 24 male 172 443 55 L 563 T I S L S I A M
L-hybrid 559 I V Y L S I A M
M 532 I V Y M A T S V
AVE 29.5 291.2 734.0 81.5
SD 6.4 80.3 241.1 41.8
had L/M ERG and VEP ratios that were smaller than unity. The prota- nope with an additional hybrid M-gene with aλmaxat 532 nm (grey opened circles) and the protanope with one hybrid gene resulting in pigment withλmaxat 538 nm (greyfilled triangle) had larger VEP ra- tios. The deuteranopes show ERG L/M ratios that were substantially larger than one whereas the VEP L/M ratios were closer to unity.
4. Discussion
The present data confirm (Barboni et al., 2017; Brainard et al., 1999; Crognale, Rabin, Switkes, et al., 1993, Crognale, Switkes, Rabin, et al., 1993; Jacob et al., 2015; Kremers et al., 2014; McKeefry et al., 2014; Tsai, Jacob, et al., 2016) and emphasize the potential use of cone isolating stimuli, combined with electrophysiological standard proto- cols (full-field ERG and VEP), to determine color vision type. The pre- sent study extends the previously obtained data by comparing psy- chophysical, genetic and electrophysiological ERG and VEP data obtained from the same individuals. Recently, ERGs to heterochromatic (red-green) modulation stimulus was shown to allow determining the type of color vision deficiency (Aher et al., 2018; Brainard et al., 1999;
Kremers & Bhatt, 2016). The present data show that ERGs to cone se- lective stimuli can also be used to identify dichromacy.
As expected, and previously reported (Kremers et al., 2014), the ERG responses to the absent cones are absent or substantially smaller in dichromats. In addition, cone driven VEP signals are generally smaller (including to the dominant cone; seeFig. 3B) in dichromats (Barboni et al., 2017) and may also be delayed (Crognale, Rabin, Switkes, et al., 1993, Crognale, Switkes, Rabin, et al., 1993) depending on stimulus condition. This is not the case with the ERGs, where the responses to stimulation of the dominant cone have very similar amplitudes in di- chromats and trichromats (seeFig. 3A). It might also be considered that individual variations such as macular pigment density, may explain the small but detectable responses in M-cone isolating conditions (Huchzermeyer & Kremers, 2017).
Previous reports indicated that the absent cone pigment may be replaced by the present cone pigment in dichromats without a change in the number of functional cones (Carroll, Neitz, Hofer, Neitz, &
Williams, 2004; Kremers & Meierkord, 1999). This was demonstrated by studying ERG responses to high frequency stimulation of the domi- nant cone that is larger in dichromats than in trichromats (Kremers, Usui, Scholl, & Sharpe, 1999). ERG responses to high frequency stimuli reflect luminance responses and their amplitudes are correlated with the number of stimulated cones (Murray, Parry, Kremers, Stepien, &
Schild, 2004). Here we found that responses to M-cone increments in protanopes were similar to those to L-cone increments (the dominant cone) in trichromats. Furthermore, response amplitudes to L-cone in- crements were not different in trichromats and deuteranopes. Thus, ERG responses to sawtooth cone isolating stimuli contradict the‘re- placement model’. However, we previously suggested that the re- sponses to 4 Hz sawtooth stimuli are probably a mixture of luminance and cone opponent responses (Tsai, Jacob, et al., 2016). The latter is absent in dichromats which may explain the relatively smaller ERG responses in dichromats.
It has been shown that pattern-onset cone-specific VEPs of the dominant cone (Rabin, Kryder, & Lam, 2016) are normal in anomalous trichromats. In the present study, the fact that the VEP responses to stimulation of the dominant cone type are substantially smaller in di- chromats than in trichromats (Fig. 4B), indicates that, compared to the fullfield ERGs, the fullfield VEPs are even more strongly dominated by cone opponent activity. This is in agreement with previously proposed ideas (Barboni et al., 2017).
In trichromats, the ERG ratios were calculated from responses to pairs of opposite stimuli (i.e. to LI/MDand to LD/MI) because of the resemblance in the response waveforms. This was also found previously (Kremers et al., 2014; McKeefry et al., 2014; Tsai, Barboni, et al., 2016) and indicates the above-mentioned presence of cone opponency in the Fig. 2.Averaged ERG and VEP signals of trichromats (A), protanopes (B), and
deuteranopes (C). On the left side, sketches of the stimulus profiles are shown.
The two upper lines show the L-cone driven responses and the two lower lines show the M-cone driven responses. The scale for the amplitude and time is shown below. The signals of the normal color vision group show the compo- nents analyzed: NLIand PLI, PLD, PMI, and PMD.
responses. Interestingly, the L-/M-ratio is what is expected from a lu- minance reflecting response because cone-opponent retinal pathways have a balanced input from L- and M-cones (Lee, 1996; Smith, Lee, Pokorny, Martin, & Valberg, 1992). Although it is unclear how the lu- minance and cone-opponent pathways are ‘translated’in an ERG re- sponse (Brainard et al., 2000; Cicerone & Nerger, 1989; Krauskopf, 2000; Kremers et al., 2000), the ERG ratios are as in the expected range.
However, if the ERG responses are a mixture of luminance and cone-
opponent responses, the ratios in the luminance reflecting responses may be larger than those obtained from the ERGs. Indeed ERG re- sponses to fullfield sinewave stimuli have generally larger L/M ratios (Jacob et al., 2015).
VEP ratios to LI/MDand to LD/MIare around one in trichromats.
Although most protanopes show VEP ratios below one (M-cone dom- inance) and most deuteranopes show VEP ratios above one (L-cone dominance), they are closer to the trichromatic range than ERGs. This Fig. 3.Average ( ± one standard deviation) component responses of the ERG (A) and total deviation and latency responses of the VEP (B) for responses elicited by the dominant cone: L-cone for trichromats (open symbols) and deuteranopes (blackfilled symbols) and M-cone for the protanopes (greyfilled symbols). Respective average signals are shown below. Significant differences are marked with an asterisk. For increment total deviation VEP responses trichromats were different from both protanopes and deuteranopes. For decrement VEP responses only trichromats and deuteranopes were significantly different.
may be influenced by larger inter-individual variability of cone-driven VEP responses. The data may also indicate that cone opponent re- sponses have larger input to the VEP. As mentioned above, this may also explain why VEPs to cone isolating sawteeth are generally smaller in the dichromats.
The genetic information allowed estimating the expectedλmaxof pigments of the dichromats (Asenjo et al., 1994). All subjects classified as protanopes according to their CCT thresholds and by their genetic results, showed L-/M-cone ratios smaller than unity in the ERGs and the majority showed L-/M-cone ratios smaller than one in the VEPs. L-cone Fig. 4.Average ( ± standard deviation) component responses of the ERG (A) and total deviation responses of the VEP (B) for responses elicited by the non-dominant cone: M-cone for trichromats (open symbols) and deuteranopes (blackfilled symbols) and L-cone for the protanopes (greyfilled symbols). Respective average signals are shown below. Significant differences are marked with an asterisk. Trichromats are different from protanopes and deuteranopes and there is no significant difference between protanopes and deuteranopes.
specific absence, as demonstrated here for protanopes, may be reliably identified using electrodiagnostic tools such as these protocols to measure cone-driven responses. Further investigations may consider characterizing L-cone driven ERGs and VEPs in anomalous trichromats, as previously demonstrated (Brainard et al., 1999; Crognale, Rabin, Switkes, et al., 1993, Crognale, Switkes, Rabin, et al., 1993), as well as subjects with acquired L-cone deficiency to verify potential use of these examinations in milder L-cone specific dysfunction.
Subjects were classified as deuteranopes according to their CCT thresholds. Four subjects had their phenotypes confirmed by their ge- netic results. The genetics of one deuteranope (D4) showed the pre- sence of both L- and M-opsin genes. Although the L-opsin gene was hybrid with estimatedλmax= 556 and the M-opsin gene was hybrid with estimated λmaxof 532 nm, the subject was classified as deuter- anope according to his CCT thresholds. The L-/M- ERG ratios of this subject are 3.64 for LI/MD(greenfilled circle on the L-cone dominance quadrant ofFig. 5A) and 4.02 for LD/MI(greenfilled circles on the x- axis ofFig. 5B). Therefore, the ERGs confirm the results of the CCT supporting the possibility of inactivating mutations in non-coding re- gions of the M-cone opsin gene that were not sequenced, as intron-exon junctions or the promoter regions, or due to the position of the genes in the chromosomal array, leading to his deuteranopic color vision phe- notype (Hayashi, Motulsky, & Deeb, 1999; Neitz et al., 2004).
Congenital color deficiency classifications obtained with the CCT and with the genetic analysis of the opsin genes were previously shown to be in agreement with each other (Honnell et al., 2015). In the present study, the comparison is extended to a quantitative analysis of CCT scores, molecular genetics, and responses to cone-driven ERGs and VEPs. The present study confirms (Aher et al., 2018; Barboni et al., 2017) that specific cone-driven responses obtained with standard electrophysiological methods may give the same classification as that obtained with the CCT and in some cases with the genetic analysis of the L- and M-opsin genes.
Although the ERG is a worldwide non-invasive clinical tool for di- agnosing inherited and acquired retinal diseases allowing direct as- sessment of the functional integrity of retinal cells (McCulloch et al., 2015; Perlman, 1983), its application may not be possible in young infants or in patients who refuse to accept ERG electrodes. Our data suggest that VEP recordings, though more variable, are possibly an alternative to investigate cone-specific deficiencies in these subjects, with consistent VEP responses provided by L- and M-cone isolating unpatterned full-field stimulation.
The use of chromatic stimuli to elicit ERG responses has long been considered to identify specific cone abnormalities (Copenhaver &
Gunkel, 1959). For instance,Kellner and Foerster (1992)showed that color stimulation to record ERGs is efficient to identify cone-specific retinal dysfunction in several retinal conditions. The characteristics of stimulation generated by four primaries allowed for a silent substitution in three photoreceptor types including the rods and, therefore, to pre- vent a possible asymmetric influence from On- and Off-bipolar cells.
ERG responses to increments and decrements have different morphol- ogies, indicating that responses of On- and Off-pathways are not mirror- images of each other.
Currently, cone isolating stimuli can be programmed in commer- cially available instruments used in clinics to record ERG and VEP re- sponses. The requirements are very simple: light sources with different spectral distributions (see the four LED arrays we used in the method section) and the possibility to independently set luminance, contrast and On- or Off-sawtooth modulation profiles. The present demonstra- tion of the efficacy of cone-isolating stimulation to detect dichromacy may be extrapolated to anomalous trichromats and to acquired color vision deficiencies.
Competing interests
The authors declare that they have no competing interests.
Fig. 5.ERG and VEP ratios for LI/MD(A) and for LD/MI(B). Black opened dots are results from 23 trichromats. Other red (protanopes) and green (deuter- anopes) symbols are used depending on the estimatedλmax of each dichromat subject. Ratios displayed on the right-upper part of the graphs indicate L-cone dominated responses. Ratios in the left-lower part of the graphs indicate M-cone dominated responses. (For interpretation of the references to color in thisfigure legend, the reader is referred to the web version of this article.)
Acknowledgments
We would like to thank São Paulo Research Foundation–FAPESP (grant numbers 2016/22007-5 to MTSB, 2014/25743-9 to EH, and 2014/26818-2 and 2016/04538-3 to DFV); National Council for Scientific and Technological Development – CNPq (grant numbers 470785/2014-4 and 404239/2016-1 to MTSB, 456746/2014-5 to DMOB, and 490428/2013-4 to DFV); CAPES (grant number 3263/2013 to DFV); Bundesministerium für Bildung und Forschung–BMBF (grant number 01DN14009 to JK); Deutsche Forschungsgemeinschaft (grant number KR1317/13-1 to JK); and the János Bolyai Scholarship of the Hungarian Academy of Sciences to BVN.
References
Aher, A. J., Martins, C. M. G., Barboni, M. T. S., Nagy, B. V., Hauzman, E., Bonci, D. M. O., ... Kremers, J. (2018). Electroretinographical determination of human color vision type.Journal of the Optical Society of America. A, Optics, Image Science, and Vision, 35(4), B92–B99.
Alexander, K. R., Barnes, C. S., Fishman, G. A., & Milam, A. H. (2002). Nature of the cone ON-pathway dysfunction in melanoma-associated retinopathy.Investigative Ophthalmology & Visual Science, 43(4), 1189–1197.
Alexander, K. R., Fishman, G. A., Barnes, C. S., & Grover, S. (2001). On-response deficit in the electroretinogram of the cone system in X-linked retinoschisis.Investigative Ophthalmology & Visual Science, 42(2), 453–459.
Arden, G. B. (1967). Electrodiagnosis tests in ophthalmology.Proceedings of the Royal Society of Medicine, 60(1), 68.
Asenjo, A. B., Rim, J., & Oprian, D. D. (1994). Molecular determinants of human red/
green color discrimination.Neuron, 12, 1131–1138.
Bach, M., Brigell, M. G., Hawlina, M., Holder, G. E., Johnson, M. A., McCulloch, D. L., ...
Viswanathan, S. (2013). ISCEV standard for clinical pattern electroretinography (PERG): 2012 update.Documenta Ophthalmologica. Advances in Ophthalmology, 126(1), 1–7.https://doi.org/10.1007/s10633-012-9353-y.
Barboni, M. T. S., Nagy, B. V., de Araújo Moura, A. L., Damico, F. M., da Costa, M. F., Kremers, J., & Ventura, D. F. (2013). ON and OFF electroretinography and contrast sensitivity in Duchenne muscular dystrophy.Investigative Ophthalmology & Visual Science, 54(5), 3195–3204.https://doi.org/10.1167/iovs.13-11700.
Barboni, M. T. S., Nagy, B. V., Martins, C. M. G., Bonci, D. M. O., Hauzman, E., Aher, A., ...
Ventura, D. F. (2017). L-/M-cone opponency in visual evoked potentials of human cortex.Journal of Vision, 17(9), 20.https://doi.org/10.1167/17.9.20.
Berson, E. L., Gouras, P., & Gunkel, R. D. (1968). Rod responses in retinitis pigmentosa, dominantly inherited.Archives of Ophthalmology, 80(1), 58–67.https://doi.org/10.
1001/archopht.1968.00980050060009.
Berson, E. L., Gouras, P., Gunkel, R. D., & Myrianthopoulos, N. C. (1969). Rod and cone responses in sex-linked retinitis pigmentosa.Archives of Ophthalmology, 81(2), 215–225.https://doi.org/10.1001/archopht.1969.00990010217012.
Brainard, D. H., Calderone, J. B., Nugent, A. K., & Jacobs, G. H. (1999). Flicker ERG responses to stimuli parametrically modulated in color space.Investigative Ophthalmology & Visual Science, 40(12), 2840–2847.
Brainard, D. H., Roorda, A., Yamauchi, Y., Calderone, J. B., Metha, A., Neitz, M., ...
Jacobs, G. H. (2000). Functional consequences of the relative numbers of L and M cones.Journal of the Optical Society of America. A, Optics, Image Science, and Vision, 17(3), 607–614.
Brown, K. T. (1968). The eclectroretinogram: Its components and their origins.Vision Research, 8(6), 633–677.
Carroll, J., Neitz, M., Hofer, H., Neitz, J., & Williams, D. R. (2004). Functional photo- receptor loss revealed with adaptive optics: An alternate cause of color blindness.
Proceedings of the National Academy of Sciences of the United States of America, 101(22), 8461–8466.https://doi.org/10.1073/pnas.0401440101.
Cicerone, C. M., & Nerger, J. L. (1989). The relative numbers of long-wavelength-sensitive to middle-wavelength-sensitive cones in the human fovea centralis.Vision Research, 29(1), 115–128.
Copenhaver, R. M., & Gunkel, R. D. (1959). The spectral sensitivity of color-defective subjects determined by electroretroretinography.AMA Archives of Ophthalmology, 62(1), 55–68.
Crognale, M. A., Rabin, J., Switkes, E., & Adams, A. J. (1993). Selective loss of S-pathway sensitivity in central serous choroidopathy revealed by spatio-chromatic visual evoked cortical potentials (VECP). In B. Drum (Ed.).Colour Vision Deficiencies XI:
Proceedings of the eleventh Symposium of the International Research Group on Colour Vision Deficiencies, held in Sydney, Australia 21–23 June 1991 including the joint IRGCVD-AIC Meeting on Mechanisms of Colour Vision 24 June 1991(pp. 229–239).
Dordrecht: Springer Netherlands https://doi.org/10.1007/978-94-011-1856-9_23.
Crognale, M. A., Switkes, E., Rabin, J., Schneck, M. E., Haegerström-Portnoy, G., &
Adams, A. J. (1993). Application of the spatiochromatic visual evoked potential to detection of congenital and acquired color-vision deficiencies.Journal of the Optical Society of America. A, Optics, Image Science, and Vision, 10(8), 1818–1825.
Crognale, M. A., Teller, D. Y., Motulsky, A. G., & Deeb, S. S. (1998). Severity of color vision defects: Electroretinographic (ERG), molecular and behavioral studies.Vision Research, 38(21), 3377–3385.
Estévez, O., & Spekreijse, H. (1982). The“silent substitution”method in visual research.
Vision Research, 22(6), 681–691.
Hall, T. A. (1999). BioEdit: A user-friendly biological sequence alignment editor and analysis program for Windows 95/98/NT. (Vol. 41, pp. 95–98). Presented at the Nucleic Acids Symposium Series.
Hayashi, T., Motulsky, A. G., & Deeb, S. S. (1999). Position of a“green-red”hybrid gene in the visual pigment array determines colour-vision phenotype.Nature Genetics, 22(1), 90–93.https://doi.org/10.1038/8798.
Honnell, V., Bonci, D., Barboni, M. T. S., Gualtiere, M., Bastos, A., Rego, L., ... Ventura, D.
F. (2015). Genetic analysis, the Color Assessment and Diagnosis (CAD) test, and the Cambridge Color Test (CCT) yield the same color vision classifications in humans.
Investigative Ophthalmology & Visual Science, 56(7), 3905.
Hood, D. C., Bach, M., Brigell, M., Keating, D., Kondo, M., Lyons, J. S., ... International society for clinical electrophysiology of vision (2012). ISCEV standard for clinical multifocal electroretinography (mfERG) (2011 edition).Advances in Ophthalmology, 124(1), 1–13.https://doi.org/10.1007/s10633-011-9296-8.
Huchzermeyer, C., & Kremers, J. (2017). Perifoveal S-cone and rod-driven temporal contrast sensitivities at different retinal illuminances.Journal of the Optical Society of America. A, Optics, Image Science, and Vision, 34(2), 171–183.https://doi.org/10.
1364/JOSAA.34.000171.
Jacob, M. M., Pangeni, G., Gomes, B. D., Souza, G. S., da Silva Filho, M., Silveira, L. C. L., ... Kremers, J. (2015). The spatial properties of L- and M-cone inputs to electro- retinograms that reflect different types of post-receptoral processing.PLoS One, 10(3), e0121218.https://doi.org/10.1371/journal.pone.0121218.
Kellner, U., & Foerster, M. H. (1992). Color electroretinography. A method for separation of dysfunctions of cones.Documenta Ophthalmologica. Advances in Ophthalmology, 80(1), 13–23.
Krauskopf, J. (2000). Relative number of long- and middle-wavelength-sensitive cones in the human fovea.Journal of the Optical Society of America. A, Optics, Image Science, and Vision, 17(3), 510–516.
Kremers, Jan (2003). The assessment of L- and M-cone specific electroretinographical signals in the normal and abnormal human retina.Progress in Retinal and Eye Research, 22(5), 579–605.
Kremers, J., & Bhatt, D. (2016). Towards an electroretinographic assay for studying colour vision in human observers.Documenta Ophthalmologica. Advances in Ophthalmology, 133(2), 109–120.https://doi.org/10.1007/s10633-016-9561-y.
Kremers, J., & Meierkord, S. (1999). Rod-cone-interactions in deuteranopic observers:
Models and dynamics.Vision Research, 39(20), 3372–3385.
Kremers, Jan, Pangeni, G., Tsaousis, K. T., McKeefry, D., Murray, I. J., & Parry, N. R. A.
(2014). Incremental and decremental L- and M-cone driven ERG responses: II.
Sawtooth stimulation.Journal of the Optical Society of America. A, Optics, Image Science, and Vision, 31(4), A170–178.
Kremers, J., Scholl, H. P., Knau, H., Berendschot, T. T., Usui, T., & Sharpe, L. T. (2000). L/
M cone ratios in human trichromats assessed by psychophysics, electroretinography, and retinal densitometry.Journal of the Optical Society of America. A, Optics, Image Science, and Vision, 17(3), 517–526.
Kremers, J., Usui, T., Scholl, H. P., & Sharpe, L. T. (1999). Cone signal contributions to electroretinograms [correction of electrograms] in dichromats and trichromats.
Investigative Ophthalmology & Visual Science, 40(5), 920–930.
Lee, B. B. (1996). Receptivefield structure in the primate retina.Vision Research, 36(5), 631–644.
McCulloch, D. L., Marmor, M. F., Brigell, M. G., Hamilton, R., Holder, G. E., Tzekov, R., &
Bach, M. (2015). ISCEV Standard for full-field clinical electroretinography (2015 update).Documenta Ophthalmologica. Advances in Ophthalmology, 130(1), 1–12.
https://doi.org/10.1007/s10633-014-9473-7.
McKeefry, D., Kremers, J., Kommanapalli, D., Challa, N. K., Murray, I. J., Maguire, J., &
Parry, N. R. A. (2014). Incremental and decremental L- and M-cone-driven ERG re- sponses: I. Square-wave pulse stimulation.Journal of the Optical Society of America. A, Optics, Image Science, and Vision, 31(4), A159–169.
Meigen, T., & Bach, M. (1999). On the statistical significance of electrophysiological steady-state responses.Documenta Ophthalmologica. Advances in Ophthalmology, 98(3), 207–232.
Mollon, J. D., & Reffin, J. P. (1989). A computer-controlled colour vision test that com- bines the principles of Chibret and of Stilling.Journal of Physiology, Proceedings of the Physiological Society, 414, 5P.
Murray, Ian J., Kremers, J., McKeefry, D., & Parry, N. R. A. (2018). Paradoxical pupil responses to isolated M-cone increments.Journal of the Optical Society of America. A, Optics, Image Science, and Vision, 35(4), B66–B71.
Murray, I. J., Parry, N. R. A., Kremers, J., Stepien, M., & Schild, A. (2004). Photoreceptor topography and cone-specific electroretinograms.Visual Neuroscience, 21(3), 231–235.
Nathans, J., Piantanida, T. P., Eddy, R. L., Shows, T. B., & Hogness, D. S. (1986).
Molecular genetics of inherited variation in human color vision.Science (New York, N.Y.), 232(4747), 203–210.
Neitz, M., Carroll, J., Renner, A., Knau, H., Werner, J. S., & Neitz, J. (2004). Variety of genotypes in males diagnosed as dichromatic on a conventional clinical anomalo- scope.Visual Neuroscience, 21(3), 205–216.
Neitz, M., & Neitz, J. (1995). Numbers and ratios of visual pigment genes for normal red- green color vision.Science (New York, N.Y.), 267(5200), 1013–1016.
Odom, J. V., Bach, M., Brigell, M., Holder, G. E., McCulloch, D. L., Mizota, A., ...
International Society for Clinical Electrophysiology of Vision (2016). ISCEV standard for clinical visual evoked potentials: (2016 update).Documenta Ophthalmologica.
Advances in Ophthalmology, 133(1), 1–9.https://doi.org/10.1007/s10633-016- 9553-y.
Pangeni, G., Lämmer, R., Tornow, R. P., Horn, F. K., & Kremers, J. (2012). On- and off- response ERGs elicited by sawtooth stimuli in normal subjects and glaucoma patients.
Documenta Ophthalmologica. Advances in Ophthalmology, 124(3), 237–248.https://
doi.org/10.1007/s10633-012-9323-4.
Parry, N. R. A., McKeefry, D. J., Kremers, J., & Murray, I. J. (2016). A dim view of M-cone onsets.Journal of the Optical Society of America. A, Optics, Image Science, and Vision, 33(3), A207–213.
Perlman, I. (1983). Relationship between the amplitudes of the b wave and the a wave as a useful index for evaluating the electroretinogram.The British Journal of Ophthalmology, 67(7), 443–448.
Rabin, J. C., Kryder, A. C., & Lam, D. (2016). Diagnosis of normal and abnormal color vision with cone-specific VEPs.Translational Vision Science & Technology, 5(3), 8.
https://doi.org/10.1167/tvst.5.3.8.
Regan, B. C., Reffin, J. P., & Mollon, J. D. (1994). Luminance noise and the rapid de- termination of discrimination ellipses in colour deficiency.Vision Research, 34(10), 1279–1299.
Sieving, P. A. (1993). Photopic ON- and OFF-pathway abnormalities in retinal dystro- phies.Transactions of the American Ophthalmological Society, 91, 701–773.
Smith, V. C., Lee, B. B., Pokorny, J., Martin, P. R., & Valberg, A. (1992). Responses of macaque ganglion cells to the relative phase of heterochromatically modulated lights.
The Journal of Physiology, 458, 191–221.
Sustar, M., Hawlina, M., & Brecelj, J. (2006). ON- and OFF-response of the photopic
electroretinogram in relation to stimulus characteristics.Documenta Ophthalmologica.
Advances in Ophthalmology, 113(1), 43–52.https://doi.org/10.1007/s10633-006- 9013-1.
Tsai, T. I., Barboni, M. T. S., Nagy, B. V., Roux, M. J., Rendon, A., Ventura, D. F., &
Kremers, J. (2016). Asymmetrical functional deficits of ON and OFF retinal proces- sing in the mdx3Cv mouse model of duchenne muscular dystrophy.Investigative Ophthalmology & Visual Science, 57(13), 5788–5798.https://doi.org/10.1167/iovs.
16-19432.
Tsai, T. I., Jacob, M. M., McKeefry, D., Murray, I. J., Parry, N. R. A., & Kremers, J. (2016).
Spatial properties of L- and M-cone driven incremental (On-) and decremental (Off-) electroretinograms: Evidence for the involvement of multiple post-receptoral me- chanisms.Journal of the Optical Society of America. A, Optics, Image Science, and Vision, 33(3), A1–11.
Woelders, T., Leenheers, T., Gordijn, M. C. M., Hut, R. A., Beersma, D. G. M., & Wams, E.
J. (2018). Melanopsin- and L-cone-induced pupil constriction is inhibited by S- and M-cones in humans.Proceedings of the National Academy of Sciences of the United States of America, 115(4), 792–797.https://doi.org/10.1073/pnas.1716281115.