arXiv:1908.06489v1 [astro-ph.GA] 18 Aug 2019
August 20, 2019
Slowly rotating Bose–Einstein Condensate confronted with the rotation curves of 12 dwarf galaxies
E. Kun1, Z. Keresztes2, L. Á. Gergely3
1 Department of Experimental Physics, University of Szeged, Dóm tér 9, H-6720 Szeged, Hungary e-mail:kun.emma0608@gmail.com
2 Department of Theoretical Physics, University of Szeged, Tisza Lajos krt 84-86, H-6720 Szeged, Hungary e-mail:zkeresztes.zk@gmail.com
3 Institute of Physics, University of Szeged, Dóm tér 9, H-6720 Szeged, Hungary e-mail:laszlo.a.gergely@gmail.com
August 20, 2019
ABSTRACT
Context. We assemble a database of 12 dwarf galaxies, for which optical (R-band) and near-infrared (3.6µm) surface brightness density together with spectroscopic rotation curve data are available, in order to test the slowly rotating Bose–Einstein Condensate (BEC) dark matter model.
Aims.We aim to establish the angular velocity range compatible with observations, bounded from above by the requirement of finite size halos, to check the modelfits with the dataset, and the universality of the BEC halo parameterR.
Methods.We construct the spatial luminosity density of the stellar component of the dwarf galaxies based on their 3.6µmand R-band surface brightness profiles, assuming an axisymmetric baryonic mass distribution with arbitrary axis ratio. We build up the gaseous component of the mass by employing a truncated disk model. We fit a baryonic plus dark matter combined model, parametrized by theM/Lratios of the baryonic components and parameters of the slowly rotating BEC (the central densityρc, size of the BEC haloR in the static limit, angular velocityω) to the rotation curve data.
Results.The 3.6µmsurface brightness of six galaxies indicates the presence of a bulge and a disk component. The shape of the 3.6µmandR-band spatial mass density profiles being similar is consistent with the stellar mass of the galaxies emerging wavelength- independent. The slowly rotating BEC model fits the rotation curve of 11 galaxies out of 12 within 1σsignificance level, with the average ofRas 7.51 kpc and standard deviation of 2.96 kpc. This represents an improvement over the static BEC model fits, also discussed. For the well-fitting 11 galaxies the angular velocities allowing for a finite size slowly rotating BEC halo are less then 2.2×10⁻¹⁶s−1. For a scattering length of the BEC particle ofa≈106fm, as allowed by terrestrial laboratory experiments, the mass of the BEC particle is slightly better constrained than in the static case asm∈[1.26×10⁻¹⁷÷3.08×10⁻¹⁷](eV/c2).
Key words. galaxies: dwarf, halos, structure - cosmology: dark matter
1. Introduction
The pioneering work by Vera Rubin and her collaborators on op- tical (Hα) galaxy rotation curves proved the presence of an un- known form of matter (Rubin et al. 1978, 1985). It was followed up by the radio (HI) observations, first systematically conducted by Albert Bosma (e.g. Bosma et al. 1977; Bosma 1981). Fritz Zwicky also concluded from the dynamic analysis of galaxy clusters the existence of some invisible material (Zwicky 1937), referred as dark matter (DM).
Since then other evidence appeared for matter inter- acting only gravitationally, such as gravitational lensing (e.g. Wegg et al. 2016; Chudaykin et al. 2016), or mea- surements on the cosmic microwave background radiation (Planck Collaboration et al. 2016). Recent observations with the Planck satellite indicate that the DM makes up about one quarter of the energy of the Universe (Planck Collaboration et al. 2016, 2018).
Galactic astronomy cannot explain the observed rota- tion curves through luminous matter alone. Several DM- type mass density profiles were proposed to relax the prob- lem of the missing mass. The Navarro-Frenk-White (NFW) DM model (Navarro et al. 1996) emerged from cold DM
structure-formation simulations. The pseudo-isothermal halo model (Gunn & Gott 1972) has a core-like constant density pro- file avoiding the density singularity of the NFW model emerging at the center of the galaxies.
Supplementing other viable proposals, Böhmer & Harko (2007) considered the possibility that DM could be in the form of a Bose–Einstein Condensate (BEC). They described DM as a non-relativistic, Newtonian gravitational BEC gas, obeying the Gross–Pitaevskii equation with density and pressure related through a barotropic equation of state. They fitted the Newto- nian tangential velocity of the model with a sample of rota- tion curves of low surface brightness and dwarf galaxies, finding good agreement.
Dwornik et al. (2015) tested the BEC DM model against ro- tation curve data of high and low surface brightness galaxies. Fits were of similar quality for the BEC and NFW DM models, ex- cept for the rotation curves exhibiting long flat regions, slightly better favouring the NFW profiles.
Kun et al. (2018) confronted a non-relativistic BEC model of light bosons interacting gravitationally either through a Newto- nian or a Yukawa potential with the observed rotational curves of 12 dwarf galaxies. The rotational curves of 5 galaxies were
reproduced with high confidence level by the BEC model. Al- lowing for a small mass the gravitons resulted in similar perfor- mances of the fit. The upper mass limit for the graviton in this approach resulted in 10−26eV c−2.
Zhang et al. (2018) derived the tangential velocity of a test particle moving in a slowly rotating Bose–Einstein Condensate (srBEC)-type DM halo. In this paper we confront their model with the rotation curve of 12 dwarf galaxies. The rotational ve- locity is parametrized by the central density of the srBEC halo (ρc), the radius of the static BEC halo (R), and the angular veloc- ity (ω) of the srBEC halo. The value ofRis determined by the scattering lengthaand the massmof the DM particle. Therefore Ris expected to be a universal constant and the different size of the srBEC halos should emerge due to the differences in their angular velocity.
In Section 2 we give the contribution of the baryonic com- ponent to the galaxy rotation curves. We present the model of the stellar component, we argue for a more sophisticated stellar model producing better results than the widely accepted expo- nential disk model, and we build up the 3.6µmandR-band spa- tial luminosity density models to compare them to each other. At the end of this Section we present the model of the gaseous com- ponent. In Section 3 we introduce the srBEC model. We address the maximum rotation of the srBEC halos, a novel concept ad- vanced in relation with this model. In Section 4 we present and discuss the best-fit rotation curve models of 12 dwarf galaxies.
In Section 5 we summarize our results and give final remarks.
2. Baryonic model
2.1. Stellar component
The stellar contribution to rotational curves is derived based on the distribution of the luminous matter, deduced from the surface brightness of the galaxies. We follow Tempel & Tenjes (2006) to derive the surface brightness density model, assuming the spatial luminosity density distribution of each visible component given by
l(a)=l(0) exp
− a ka0
!1/N
. (1)
Herel(0) = hL(4πqa30)−1 is the central density, wherea0 char- acterizes the harmonic mean radius of the respective compo- nent, and k and h are scaling parameters. Furthermore, a = pr2+z2q−2, whereqis the axis ratio, andrandzare cylindrical coordinates. From the measurements the projection ofl(a) onto the plane of the sky perpendicular to the line of sight, the surface luminosity is derived cf. Kun et al. (2017):
S(R)=2
n
X
i
qi
Z ∞
R
li(a)a
√a2−R2
da. (2)
HereS(R) arises as a sum fornvisible components, and we as- sumed constant axis ratiosqi. Equation (2) was fitted to the ob- served surface luminosity profiles, assuming a constant axis ratio q. In the two-component stellar model the spatial mass density is
ρ(a)= Υblb(a)+ Υdld(a), (3)
wherelb(a) andld(a) are the spatial luminosity densities of the bulge and disk components, and Υb andΥd are the respective mass-to-light (M/L) ratios (given in solar units).
It follows from the Poisson equation that for spheroidal shape matter, the rotational velocity squared in the galactic plane (z = 0) induced by each stellar component is given by (Tamm & Tenjes 2005):
v2i,∗(R)=4πqiG Z R
0
ρi(r)r2
(R2−e2ir2)1/2dr, (4) wherei=b,d,Gis the gravitational constant,ei=(1−q2i)1/2is the eccentricity of theith stellar component, andρi(r) is its mass density.
2.2. Exponential disk and Tempel–Tenjes models
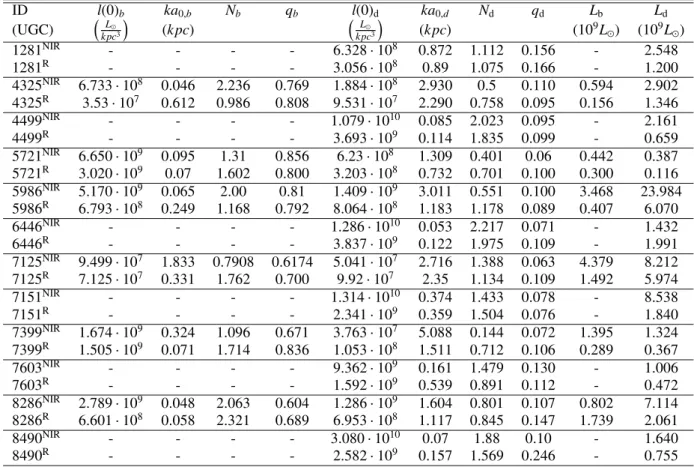
The SPARC database (Lelli et al. 2016) offers robust mass mod- els of a sample of 175 disk galaxies with Spitzer 3.6µmpho- tometry together with accurate rotation curves, well-suited to test rotation curve models. The largest number of dwarf galax- ies were assumed to be bulgeless, and their photometry was fit- ted by an exponential disk model. The disk model is a widely explored in automatized modelling. We select 12 galaxies from this database, with the longest near-infrared (NIR) surface pho- tometry profiles and accurate rotation curves, for whichR-band counterparts are also available (this last criterion being motivated in the next subsection).
Unfortunately the exponential disk model in SPARC some- times underestimates the luminosity of the inner region, in other cases under- or overestimates the outer region (see Fig.
1). Therefore we explored a more sophisticated Tempel–Tenjes model, moreover for half of the galaxies we allowed for both bulge and disk as indicated by their photometric data. We binned the NIR surface brightness profile of the galaxies on a logarith- mic scale to smooth out possible small-scale inhomogenities in them. The best-fit baryonic parameters are presented in Table 1 (the respective galaxy names carry the superscript NIR). In Fig. 1 we show the best-fit Tempel–Tenjes models for the chosen galax- ies, along with their exponential disk fit from the SPARC. It is clear that the Tempel–Tenjes model has a better fit to the surface brightness data.
2.3. Near-infrared and R-band spatial luminosity models We took the R-band (effective central wavelength 634.9 nm, FWHM 106.56 nm) surface brightness data of the same 12 late- type dwarf galaxies from the Westerbork HI survey of spiral and irregular galaxies, to build up theirR-band photometric models (Swaters 1999; Swaters & Balcells 2002; Swaters et al. 2009).
These measurements were made with the 2.54 m Isaac New- ton Telescope on La Palma in the Canary Islands. We again fit- ted the data with the Tempel–Tenjes model. Galaxies described by a two-component surface brightness model (bulge+disk) at 3.6µmare described by a two-component model in the R-band too. For the absolute R-magnitude of the Sun M⊙,R = 4.42m (Binney & Merrifield 1998) was adopted. The best-fit parame- ters describing theR-band spatial luminosity density of these 12 dwarf galaxies are given in Table 1 (the galaxy names carrying the superscriptR). Compared to the 3.6µmdata, theR-band data result in lower luminosities for almost all of the galaxies (one exception is the galaxy UGC6446).
Earlier studies indicate that the near-infrared (NIR) M/L ratio depends weakly on the color, several models predict- ing its constancy in the NIR over a broad range of galaxy masses and morphologies, for both the bulge and the disk (e.g.
McGaugh & Schombert 2014, and references therein). The NIR
Table 1.Best-fit parameters describing the luminosity density distribution of the baryonic matter of dwarf galaxies at 3.6µm(indicated by the superscriptNIR) and optical wavelengths (indicated by the superscriptR). The total luminosity of the galaxies (Lbfor the bulge andLdfor the disk) is also presented.
ID l(0)b ka0,b Nb qb l(0)d ka0,d Nd qd Lb Ld
(UGC) L
⊙
k pc3
(kpc) L
⊙
k pc3
(kpc) (109L⊙) (109L⊙)
1281NIR - - - - 6.328·108 0.872 1.112 0.156 - 2.548
1281R - - - - 3.056·108 0.89 1.075 0.166 - 1.200
4325NIR 6.733·108 0.046 2.236 0.769 1.884·108 2.930 0.5 0.110 0.594 2.902 4325R 3.53·107 0.612 0.986 0.808 9.531·107 2.290 0.758 0.095 0.156 1.346
4499NIR - - - - 1.079·1010 0.085 2.023 0.095 - 2.161
4499R - - - - 3.693·109 0.114 1.835 0.099 - 0.659
5721NIR 6.650·109 0.095 1.31 0.856 6.23·108 1.309 0.401 0.06 0.442 0.387 5721R 3.020·109 0.07 1.602 0.800 3.203·108 0.732 0.701 0.100 0.300 0.116 5986NIR 5.170·109 0.065 2.00 0.81 1.409·109 3.011 0.551 0.100 3.468 23.984 5986R 6.793·108 0.249 1.168 0.792 8.064·108 1.183 1.178 0.089 0.407 6.070
6446NIR - - - - 1.286·1010 0.053 2.217 0.071 - 1.432
6446R - - - - 3.837·109 0.122 1.975 0.109 - 1.991
7125NIR 9.499·107 1.833 0.7908 0.6174 5.041·107 2.716 1.388 0.063 4.379 8.212 7125R 7.125·107 0.331 1.762 0.700 9.92·107 2.35 1.134 0.109 1.492 5.974
7151NIR - - - - 1.314·1010 0.374 1.433 0.078 - 8.538
7151R - - - - 2.341·109 0.359 1.504 0.076 - 1.840
7399NIR 1.674·109 0.324 1.096 0.671 3.763·107 5.088 0.144 0.072 1.395 1.324 7399R 1.505·109 0.071 1.714 0.836 1.053·108 1.511 0.712 0.106 0.289 0.367
7603NIR - - - - 9.362·109 0.161 1.479 0.130 - 1.006
7603R - - - - 1.592·109 0.539 0.891 0.112 - 0.472
8286NIR 2.789·109 0.048 2.063 0.604 1.286·109 1.604 0.801 0.107 0.802 7.114 8286R 6.601·108 0.058 2.321 0.689 6.953·108 1.117 0.845 0.147 1.739 2.061
8490NIR - - - - 3.080·1010 0.07 1.88 0.10 - 1.640
8490R - - - - 2.582·109 0.157 1.569 0.246 - 0.755
Table 2.Values ofσandτfor the 12 dwarf galaxies of the sample, which give how much larger theR-band M/Lratio of the bulge and disk are compared to those of the 3.6µm M/Lratios.
1281 4325 4499 5721 5986 6446 7125 7151 7309 7603 8286 8490
σ - 3.808 - 1.473 8.521 - 2.935 - 4.827 - 0.461 -
τ 2.123 2.156 3.279 3.336 3.951 0.719 1.375 4.640 3.607 2.131 3.452 2.172 surface photometry provides the most sensitive proxy to the stel-
lar mass, as shown by e.g. Verheijen (2001). We build the spatial mass density distribution of the disk (and bulge) employing the NIR andR-band surface brightness models, and Eq. (3).
The total mass of the stellar component should not depend on the wavelength at which the galaxies are observed. The masses of the bulge and the disk should be the same for the 3.6µmand R-band measurements, i.e.:
ΥNIR,bLNIR,b(=MNIR,b)= ΥR,bLR,b(=MR,b), (5) ΥNIR,dLNIR,d(=MNIR,d)= ΥR,dLR,d(=MR,d), (6) where Υ is the M/L ratio, L is the total luminosity, M is the total mass. We give the total luminosities in Table 1 based on the best-fit surface brightness models of the galaxies. Then the R-bandM/Lratios are:
ΥR,b= LNIR,b
LR,b ΥNIR,b=σΥNIR,b, (7)
ΥR,d= LNIR,d
LR,d ΥNIR,d=τΥNIR,d, (8)
for the bulge and disk, respectively. The values forσandτare given in Table 2, calculated based on theRtoNIRratio of the total luminosities of the 12 galaxies of the sample.
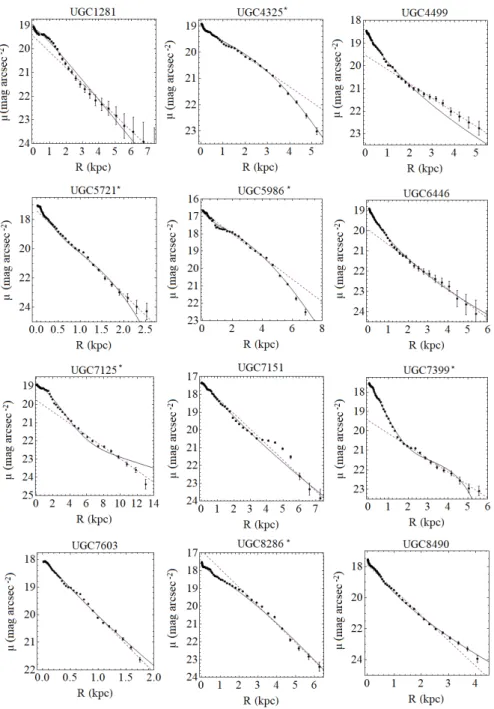
In Fig 2 we plot the mass densities of the 12 dwarf galaxies employing the best-fit surface brightness density mod- els (from Table 1) Stellar population models and earlier studies on the conversion between the NIR flux and stel- lar mass suggest that the typical value of the stellar M/L in NIR should be at about 0.5M⊙/L⊙ (e.g. Eskew et al. 2012;
McGaugh & Schombert 2014, and references therein). We as- sumeΥNIR,d≡0.5 to derive the mass density from the luminos- ity density, and for those galaxies with bulgeΥNIR,b ≡ 0.5, in order to calculate through Eqs. (8) how much larger is theM/L of the disk (and the bulge where it applies) than that of the NIR M/Ls. In case of the galaxies of the present sampleσ(where it applies) andτare given in Table 2. The predicted shape of the spatial mass densities is similar for both theR- and NIR-bands.
The SPARC 3.6µmphotometry samples the surface bright- ness of the galaxies from a region five-ten times closer to the centre of the galaxies, out of the same region where theR-band observations end. Due to their good resolution, and the fact that they are the closest proxy to the stellar mass distribution, we em- ploy the SPARC 3.6µmdata to model the stellar component of the baryonic mass of the galaxies in the next section, to test the slowly rotating BEC model.
Fig. 1.Exponential disk model (purple dashed line) from the SPARC database and Tempel–Tenjes disk model in the present paper, or bulge+disk model (black continuous line) of the 12 dwarf galaxies. The 3.6µmSPARC surface brightness data are presented by black dots with error-bars.
The⋆sign marks galaxies with two-component stellar model (bulge+disk).
2.4. Gaseous component
Observations of galaxies show that for a large fraction of dwarf galaxies the rotation velocity of the gas (measured by emission lines) is close to the rotation velocity of the stellar component (measured by absorption lines) (e.g. Rhee et al. 2004; Lelli et al.
2016). Therefore for these galaxies it is necessary to involve a gaseous contribution to the baryonic component of their rotation curves. For this purpose we include an additional velocity square of an exponential disk (Binney & Tremaine 1987):
v2gas(R)=4πGΣ0Rdy2I0(y)K0(y)−I1(y)K1(y), (9) where Σ0 is the central surface mass density, Rd is the scale length of the disk, y ≡ R/2Rd, and I and K are the modified
Bessel functions. The mass of the disk within radiusRis Md(R)=2πΣ0R2d
"
1−exp −R Rd
! 1+ R
Rd
!#
, (10)
while its total mass is:
Mtot,d=2πΣ0R2d. (11)
We employ these equation inR−Rtby a introducing a trunca- tion radiusRt, whereRtdenotes that radius outside of which the gaseous component is not negligible. To build up the contribu- tion of the gaseous component to the baryonic rotation curves we fitted this truncated exponential disk model to the discrete values of the gas velocity given in the SPARC database. The best-fit pa- rameters are given in Table 3.
Fig. 2.Mass density models of the 12 galaxies at 3.6µm(red line) and inR-band (black line). The coordinateris measured in the galactic plane (wherea=r, becausez=0). The⋆sign marks galaxies with two-component stellar model (bulge+disk).
3. Dark matter model
3.1. The slowly rotating BEC-type dark matter component The equatorial radius of the srBEC DM halo is given by Zhang et al. (2018)
R0 π
2
=π k 1+9
4Ω2
!
, (12)
where Ω2 = ω2
2πGρc
=0.02386×
× ω 10−16s−1
2
× ρc
10−24g/cm3
!−1
, (13)
ρcis the central density andωthe angular velocity of the srBEC halo (assumed to be in rigid rotation). In the non-rotating case Ω =0 andR0(π/2)=R=π/k, the radius of the static BEC DM haloR, being determined by the massmand scattering lengtha of the DM particle through
k= rGm3
a~2 , (14)
where~ is the reduced Planck-constant. The tangential veloc- ity squaredv2srBECof massive test particles rotating in the BEC galactic DM halo is given in the first order of approximation as in the equatorial plane of the galaxies by
v2srBEC(R)= 4GρcR2
π ×
"
1−Ω2sin (πR/R) πR/R −
1−Ω2 cosπR
R +Ω2 3
πR R
2# , (15) or equivalently1,
v2srBEC
km2/s2
=80.861× ρc 10−24g/cm3
!
× R kpc
!2
×
"
1−Ω2"sin (πR/R)
πR/R −cosπR R
# +Ω2
3 πR
R 2#
.
(16)
1 This equation corrects Eq. (103) of Zhang et al. (2018). When they substituted the definition ofΩ2from their Eq. (52) to Eq. (103) missed the term
ρc/10−24g/cm3−1
from the right-side of their Eq. (52) due to a misprint. We thank T. Harko for pointing this out to us.
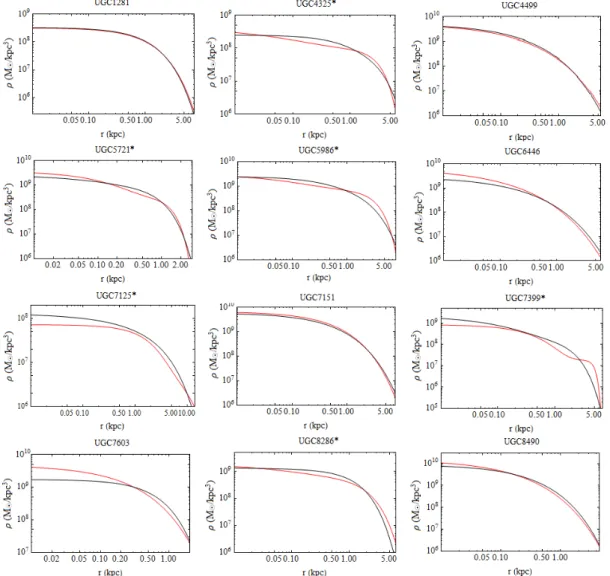
Fig. 3.Density of the srBEC halo (coloured surface), as a function of the distance measured from the rotation axis of the galaxy in its equatorial plane (R, on thex-axis), and of the angular velocity (ω, on they-axis). Theρ = 0 level surface is also indicated. Model parameters are: the size of the BEC halo in the static limitR=10 kpc, the central density isρc =1×10⁻²⁴g/cm3(left panel),ρc=2×10⁻²⁴g/cm3(middle), and ρc=3×10⁻²⁴g/cm3(right). With increasing BEC DM halo rotation, its density does not drop to zero, rather it exhibits a positive density extending to infinity. We consider the density profile realistic only when and until it first reaches the zero-level. The fastest rotation velocityωof a realistic srBEC halo (that can have zero density at a given radius) depends on the central densityρc, largerρcresulting in higher limitingω.
Fig. 4.Density profile of the srBEC model (coloured surface), as a function of the distance measured from the rotation axis of the galaxy in its equatorial plane (R, on thex-axis), and of the angular velocity (ω, on they-axis). For comparison we also indicate theρ=0 level. Three model parameters are the follows. The central density isρc =1×10⁻²⁴g/cm3, and the size of the BEC halo in static limit isR=4 kpc for the left-side panel andR=16 kpc for the right-side panel. On the left panel one can see that for small angular velocity values the srBEC density reaches zero, after which a cut-offof the model has to be applied in order to have only positive densities. This procedure also ensures the finite size of the srBEC halo. For larger angular velocities however the density oscillates around a positive value, hence no cutoffis possible and the srBEC halo extends to infinity. Comparing the left- and right-sided panels it seems the fastest angular velocityωof a finite srBEC halo does not depend onR.
3.2. On the maximal rotation of the slowly rotating BEC halo When formulating the srBEC model, Zhang et al. (2018) applied first order corrections to the density and radius of the DM halo.
On Fig. 3 we present the density profile of the srBEC halo as a function of the distance from the center of the galaxy measured in its equatorial plane and of the angular velocity of the DM halo, for three values of the central densityρc.
For fast rotation the halo density although oscillating, is pos- itive at all radii, meaning that the halo size is infinite. For slower rotation however, at some finite radius the density reaches zero, where the model should have a cut-off(otherwise it is contin- ued through negative densities). The two regimes are separated by a limiting omega value, the fastest angular velocity allowing for a finite srBEC halo (having zero density at a given radius).
This limitingω increases together with the value of the central densityρc.
On Fig. 4 we present again the density profile of the srBEC halo, varying this time the size Rof the static BEC halo. The highestωgiving a finite size halo does not seem to depend on the size of the static BEC haloR, only on the central densityρc. While for smallωthe trigonometric term in Eq. (16) dominates, for largerωthe monotonicr2term is dominant. In this paper we consider only finite-size srBEC models, thus those possessing an upper limit forω.
4. Rotation curve model of 12 dwarf galaxies
In the previous sections we gave the contribution of the bary- onic sector (Section 2.) and the slowly rotating BEC-type DM halo (Section 3.) to the combined rotation curve models. Then the model rotation curve in the equatorial pane of the galaxy is given as (Rodrigues et al. 2018)
vrot= q
vgas|vgas|+ Υbvb|vb|+ Υdvd|vd|+v2srBEC, (17) wherevgas,vb,vdandvsrBECare the contributions of the gaseous component, the bulge (where it applies), the disk, and the DM halo to the rotation curves.
When fitting Eq. (17) to the observed rotation curves, we apply a non-linear least-squares method to perform the fit with error−2weights, minimizing the residual sum of squares (χ2) be- tween the data and the model. We are interested in such models, where the mass density of the halo drops to zero for a given ra- dius, therefore we set an upper limit forω, such that we allow only fits which results in finite size halos (see Section 3.2). This limit is dynamically changing during the fit withρc. The fitted parameters areΥbandΥdfor the stellar component,ρc,Randω for the srBEC component. Fitting theM/Lratios we are able to reveal the maximal performance of the srBEC model.
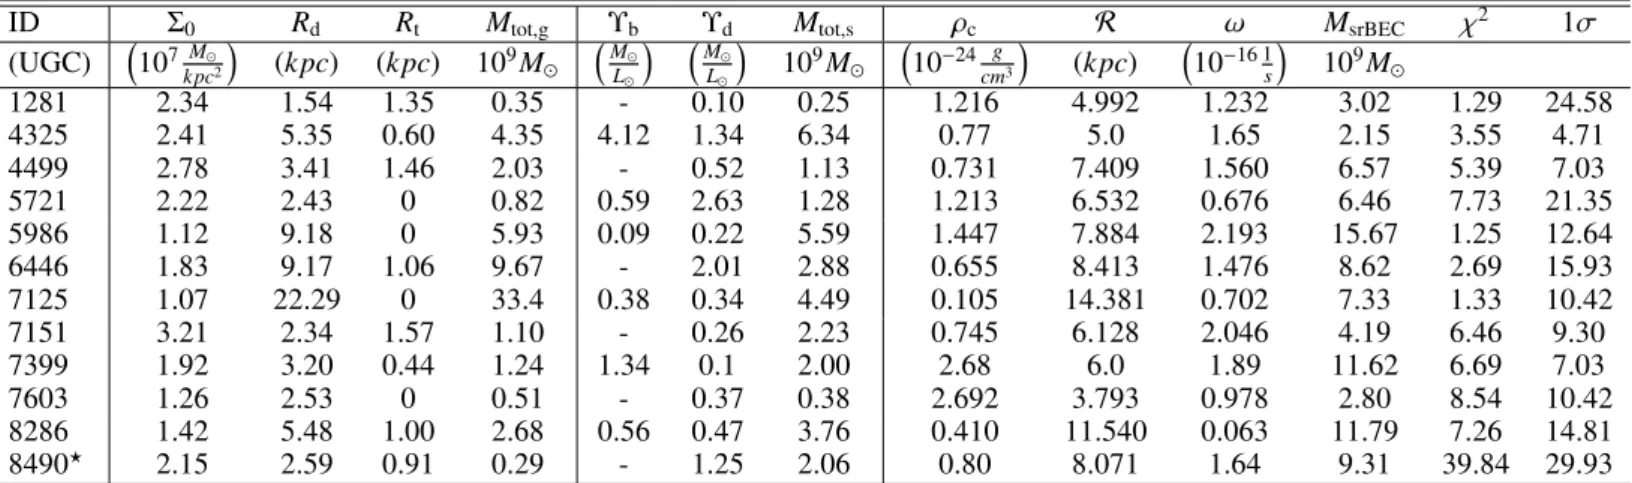
ID Σ0 Rd Rt Mtot,g Υb Υd Mtot,s ρc R ω MsrBEC χ2 1σ
(UGC)
107k pcM⊙2
(kpc) (kpc) 109M⊙ M
⊙
L⊙
M
⊙
L⊙
109M⊙
10−24cmg3
(kpc)
10−16 1s
109M⊙
1281 2.34 1.54 1.35 0.35 - 0.10 0.25 1.216 4.992 1.232 3.02 1.29 24.58
4325 2.41 5.35 0.60 4.35 4.12 1.34 6.34 0.77 5.0 1.65 2.15 3.55 4.71
4499 2.78 3.41 1.46 2.03 - 0.52 1.13 0.731 7.409 1.560 6.57 5.39 7.03
5721 2.22 2.43 0 0.82 0.59 2.63 1.28 1.213 6.532 0.676 6.46 7.73 21.35
5986 1.12 9.18 0 5.93 0.09 0.22 5.59 1.447 7.884 2.193 15.67 1.25 12.64
6446 1.83 9.17 1.06 9.67 - 2.01 2.88 0.655 8.413 1.476 8.62 2.69 15.93
7125 1.07 22.29 0 33.4 0.38 0.34 4.49 0.105 14.381 0.702 7.33 1.33 10.42
7151 3.21 2.34 1.57 1.10 - 0.26 2.23 0.745 6.128 2.046 4.19 6.46 9.30
7399 1.92 3.20 0.44 1.24 1.34 0.1 2.00 2.68 6.0 1.89 11.62 6.69 7.03
7603 1.26 2.53 0 0.51 - 0.37 0.38 2.692 3.793 0.978 2.80 8.54 10.42
8286 1.42 5.48 1.00 2.68 0.56 0.47 3.76 0.410 11.540 0.063 11.79 7.26 14.81
8490⋆ 2.15 2.59 0.91 0.29 - 1.25 2.06 0.80 8.071 1.64 9.31 39.84 29.93
Table 3.Best-fit parameters of the rotational curve models of 12 dwarf galaxies. The best-fit central surface mass density (Σ0), the scale length (Rd), and the truncation radius (Rt) of the gaseous component can be found in columns 2-4. Best-fitM/Lratio (Υb) for the bulge (where applicable) and M/Lratio (Υd) for disk are presented in the 6th and 7th columns. The best-fit parameters of the slowly rotating BEC model are given in columns 9-11: the central density of the rotating BEC halo (ρc), size of the static BEC halo (R), and the angular velocity of the rotating BEC halo (ω). The χ2of the fits and the 1σsignificance levels are also presented. The only galaxy that cannot be fitted within 1σis marked by⋆. The total masses of the gaseous (Mtot,g), the stellar (Mtot,s), and the slowly rotating BEC components (MsrBEC) are also given in columns 5, 8, 12, respectively.
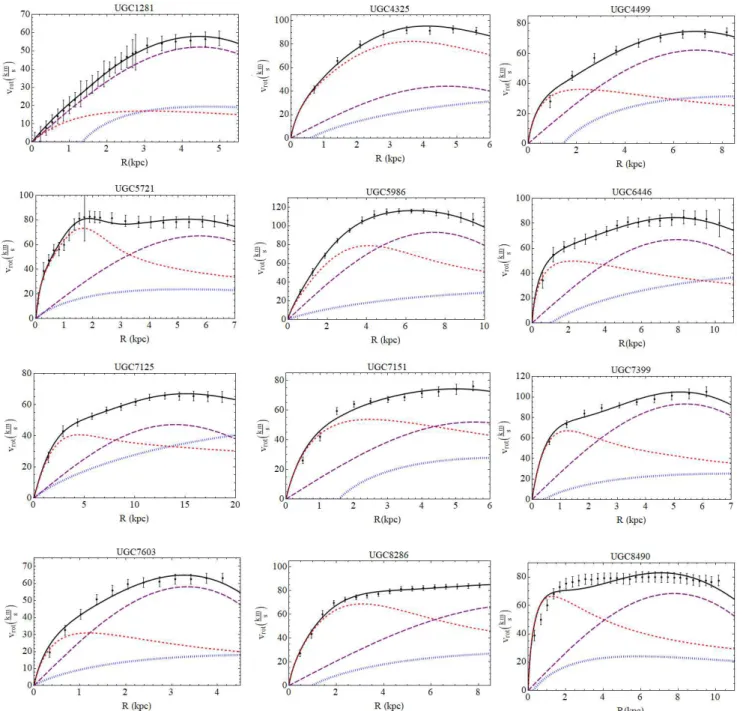
The parameters of the best-fit galactic rotation curves, com- posed by a baryonic and a srBEC-type DM component are pre- sented in Table 3, and the best-fit rotation curves are shown in Fig. 5 along the observed ones. The combined model fits the dataset within the 1σconfidence level in case of 11 dwarf galax- ies out of 12.
The size of the static BEC haloRis expected to be uniform for all of the galaxies, as it only depends on the mass and scat- tering length of the particle forming the BEC halo. From our fitting-procedure the average value ofR emerged as 7.51 kpc, with standard deviation 2.96 kpc (see Table 3).
In Section 2.3 we derived the stellar mass density from the NIR luminosity density of the galaxies assuming M/L ratios equal to 0.5 in order to calculate how much larger are the R-band M/Lratios compared to the NIR ones, and to plot the NIR and R-band mass density curves (the total mass of the stellar com- ponent should not depend on the observational band). By fitting the M/Lratios (together with the srBEC parameters) to the ro- tational curve data we got different M/Ls. Hence these galax- ies may hold diverse stellar populations resulting in different luminosity characteristics (e.g. Bell & de Jong 2001; Bell et al.
2003).
5. Summary and final remarks
In this paper we assembled photometric data and rotation curves of 12 late-type dwarf galaxies in order to test the srBEC DM–
model from the SPARC database (3.6µmphotometry) and the Westerbork HI survey of spiral and irregular galaxies (R-band photometry). Our particular interests were in 1) establishing the limiting angular velocity below which the model leads to finite size halos, 2) how well the model fits the dataset and 3) whether one of its parameters, the size of the BEC haloRin the static limit is really universal.
We investigated whether the widely employed exponential disk model accurately describes the surface brightness of the galaxies, and found necessary to employ a more complicated model than the exponential one to correctly estimate the lumi- nosity of the inner region of these galaxies. We built up the 3.6µmand R-band spatial luminosity densities of the galaxies fitting the Tempel–Tenjes model to their surface brightness den-
ID Υ′b Υ′d ρ′c R′ χ2 1σ
(UGC) M
⊙
L⊙
M
⊙
L⊙
10−24cmg3
(kpc)
1281 - 0.11 1.201 5.011 1.50 25.66
4325⋆ 4.87 1.38 0.476 5.253 6.42 5.89
4499 - 0.57 0.679 8.094 6.52 8.18
5721 0.59 2.63 1.214 6.574 7.86 22.64
5986 0.09 0.23 1.359 8.579 1.52 13.74
6446 - 2.03 0.631 9.105 3.31 17.03
7125 0.32 0.98 0.059 15.36 1.56 11.54
7151 - 0.27 0.714 6.806 7.62 10.42
7399 1.34 0.03 2.623 6.221 7.27 8.18
7603 - 0.36 2.763 3.794 10.10 11.54
8286 0.56 0.47 0.411 11.54 7.26 15.94
8490⋆ - 1.28 0.753 8.843 43.28 31.00
Table 4.Best-fit parameters of the rotational curve models of 12 dwarf galaxies. The rotational curves are composed of baryonic matter and a non-rotating BEC component. The fitted parameters are the M/L of the bulge (Υ′b, where it applies) and the disk (Υ′d), the central density of the non-rotating BEC halo (ρ′c) and size of the static BEC haloR′. The two galaxies that cannot be fitted within 1σare marked by⋆.
sities. For six galaxies a two-component model (bulge+disk) de- scribed their surface brightness density more accurately then the disk model. We found the near infrared luminosity of almost all galaxies larger compared to theR-band one, leading to higher M/Lratios inR-band in order to generate the same stellar mass.
We added a gaseous component by fitting a truncated exponen- tial disk to the gas velocity given in the SPARC database.
The stellar component+gas+slowly rotating BEC combined rotation curve model fits the dataset within the 1σ confidence level in case of 11 dwarf galaxies out of 12. The size of the static BEC haloR, related to the BEC particle characteristics, hence expected to be the same for all of galaxies, has an average value of ¯R=7.51 kpc, with standard deviation as 2.96 kpc (see Table 3). The best-fit limiting angular velocity which allows for a finite size slowly rotating BEC halo is<2.2×10⁻¹⁶ s−1for the well- fitting 11 galaxies. Its average value is 1.32×10⁻¹⁶ s−1, with standard deviation 0.66×10⁻¹⁶ s−1. Based on the total masses (Table 3) the slowly rotating BEC-type DM dominates the rota-
Fig. 5.Best-fit rotational curves of the dwarf galaxy sample. The dots with error-bars denote the observed rotational velocity curves. The fitted model, composed by a baryonic and a srBEC component is represented by the black curve. The red short-dashed curve draws the contribution of the stellar component, the blue tiny-dashed curve shows the contribution of the gas, and the long-dashed purple curve denotes the contribution of the srBEC-type DM halo to the rotation curve–models.
tion curves of 9 galaxies out of 12 (exceptions are UGC 4325, UGC 6446, UGC 7125).
The massmof the BEC particle depends on its scattering lengthaand the size of the static BEC haloR(Böhmer & Harko 2007):
m=6.73×10⁻²[a(fm)]1/3[R(kpc)]−2/3eV. (18) Terrestrial laboratory experiments render the value of a to be
≈ 106 fm (e.g Böhmer & Harko 2007). Hence the mass of the BEC particle falls into the rangem ∈ [1.26×10⁻¹⁷ ÷3.08× 10⁻¹⁷](eV/c2) based on the best-fits of the srBEC model to the rotation curves of the present galaxy sample. The lower limit is given by galaxy UGC7125 having the largest static BEC halo
(R=14.381 kpc), and the upper limit from UGC7603 having the smallest one (R=3.793 kpc). It is worth to note, that UGC7125 also has the smallest (ρc=0.105×10⁻²⁴g/cm3), while UGC7603 the largest central density (ρc = 2.692×10⁻²⁴ g/cm3) among these galaxies. A slightly different lower limit on m emerges when assuming a static BEC model, the mass of the BEC particle falling into the rangem∈[1.21×10⁻¹⁷÷3.08×10⁻¹⁷](eV/c2).
Again, the two limits are constrained by the galaxies UGC7125 (from below, R′ = 15.36 kpc) and UGC7603 (from above, R′ = 3.794 kpc). We also note that UGC7125 possesses the longest, while UGC7603 the shortest observed rotation curve in the sample, hence the size of the static BEC halo seems to cor- relate with the length of the rotation curves.
Finally we discuss whether the slow rotation improves over the fits. By settingω=0 we fit a static BEC model to the rota- tional curve data, obtaining best-fit parameters given in Table 4.
Comparison shows that the finite size srBEC model gave slightly better fits, which are below 1σin 11 cases as compared to only 10 cases for the static BEC halo fits. In the static case the aver- age value ofR′emerged as 8.42 kpc, with a standard deviation of 3.35 kpc, as compared to the rotating BEC case with average of 7.51 kpc and standard deviation of 2.96 kpc. In a srBEC dark matter halo, the tangential velocity of a test particle is larger than in the static case at the same position (Zhang et al. 2018), also the plateau of the rotation curves is slightly lifted. Withω = 0 the fitting process favours largerR′s to lift the plateau to give the same performance. This is why the average value ofR′is larger than that ofR..
According to our rotation curve analysis, the srBEC halo with suitable constrained angular velocity values proves to be a viable DM model. However the steep decrease of either the static or the slowly rotating BEC rotation curves raises doubts on whether such a halo could be well fitted with galaxy lensing data.
Acknowledgements. We thank Tiberiu Harko and Maria Cr˘aciun for suggesting to add the gas component to the baryonic sector. The authors acknowledge the support of the Hungarian National Research, Development and Innovation Office (NKFIH) in the form of the grant 123996. The work of Z. K. was supported by the János Bolyai Research Scholarship of the Hungarian Academy of Sciences and by the UNKP-18-4 New National Excellence Program of the Ministry of Human Capacities.
References
Bell, E. F. & de Jong, R. S. 2001, ApJ, 550, 212
Bell, E. F., McIntosh, D. H., Katz, N., & Weinberg, M. D. 2003, ApJS, 149, 289 Binney, J. & Merrifield, M. 1998, Galactic Astronomy
Binney, J. & Tremaine, S. 1987, Galactic dynamics Böhmer, C. G. & Harko, T. 2007, JCAP, 6, 025 Bosma, A. 1981, AJ, 86, 1791
Bosma, A., van der Hulst, J. M., & Sullivan, III, W. T. 1977, A&A, 57, 373 Chudaykin, A., Gorbunov, D., & Tkachev, I. 2016, Phys. Rev. D., 94, 023528 Dwornik, M., Keresztes, Z., & Gergely, L. Á. 2015, in Thirteenth Marcel
Grossmann Meeting: On Recent Developments in Theoretical and Experi- mental General Relativity, Astrophysics and Relativistic Field Theories, ed.
K. Rosquist, 1279–1281
Eskew, M., Zaritsky, D., & Meidt, S. 2012, AJ, 143, 139 Gunn, J. E. & Gott, III, J. R. 1972, ApJ, 176, 1
Kun, E., Keresztes, Z., Das, S., & Gergely, L. 2018, Symmetry, 10, 520 Kun, E., Keresztes, Z., Simkó, A., Sz˝ucs, G., & Gergely, L. Á. 2017, A&A, 608,
A42
Lelli, F., McGaugh, S. S., & Schombert, J. M. 2016, AJ, 152, 157 McGaugh, S. S. & Schombert, J. M. 2014, AJ, 148, 77
Navarro, J. F., Frenk, C. S., & White, S. D. M. 1996, AJ, 462, 563
Planck Collaboration, Ade, P. A. R., Aghanim, N., et al. 2016, A&A, 594, A13 Planck Collaboration, Aghanim, N., Akrami, Y., et al. 2018, arXiv e-prints Rhee, G., Valenzuela, O., Klypin, A., Holtzman, J., & Moorthy, B. 2004, ApJ,
617, 1059
Rodrigues, D. C., Marra, V., del Popolo, A., & Davari, Z. 2018, Nature Astron- omy, 2, 668
Rubin, V. C., Burstein, D., Ford, Jr., W. K., & Thonnard, N. 1985, ApJ, 289, 81 Rubin, V. C., Thonnard, N., & Ford, Jr., W. K. 1978, ApJL, 225, L107 Swaters, R. A. 1999, PhD thesis, , Rijksuniversiteit Groningen, (1999) Swaters, R. A. & Balcells, M. 2002, A&A, 390, 863
Swaters, R. A., Sancisi, R., van Albada, T. S., & van der Hulst, J. M. 2009, A&A, 493, 871
Tamm, A. & Tenjes, P. 2005, A&A, 433, 31 Tempel, E. & Tenjes, P. 2006, MNRAS, 371, 1269 Verheijen, M. A. W. 2001, ApJ, 563, 694
Wegg, C., Gerhard, O., & Portail, M. 2016, MNRAS, 463, 557
Zhang, X., Chan, M. H., Harko, T., Liang, S.-D., & Leung, C. S. 2018, ArXiv e-prints
Zwicky, F. 1937, ApJ, 86, 217