T E C H N O L O G Y O F LUNAR E X P L O R A T I O N
U. S. AIR FORCE
CARTOGRAPHIC SUPPORT OF LUNAR MISSIONS Robert W. Carder1
U. S. Air Force Aeronautical Chart and Information Center St. Louis, Missouri
ABSTRACT
The United States Air Force, in response to the advance of the national space program, i s publishing a series of photo- graphic and cartographic products of the moon, A Lunar Atlas containing a comprehensive selection of lunar photography has been published, followed by several supplements. USAF Lunar Mosaics in several sizes are now available and a series of Lunar Aeronautical Charts, scale 1:1,000,000, sheet size 22 χ 29 i n . , are under construction. These charts, lithographed in four colors, contain 300-m contours. This program i s being accomplished j o i n t l y by the Air Force Cambridge Research Laboratory and the Aeronautical Chart and Information Center in collaboration with the s c i e n t i f i c community.
INTRODUCTION
Everyone i s aware of the important r o l e played by maps and charts in the development of our society. Man, in his earth- bound experience, constantly has f e l t the need for a wide variety of cartographic aids to support continued progress in a l l walks of l i f e . Consider for a moment the progress of man on earth i f adequate maps had been available before he under- took the explorations recorded in history — the European would certainly have colonized the new world before the 15th century.
As man turns to new frontiers - space and the universe - he finds that prospects of having adequate lunar charts in hand before beginning an exploratory mission to the moon are quite
good. For this capability due credit must be given to the astronomers who have thoroughly l a i d the groundwork through
Presented at the ARS Lunar Missions Meeting, Cleveland, Ohio, July 17-19, 1962.
Cartographer, Technical Planning D i v i s i o n .
their s c i e n t i f i c and systematic study of the universe. Now, with the objective of a manned lunar landing as a national goal, U. S. Air Force cartographers and lunar scientists have pooled their resources to map the moon with a precision that has never been previously attempted in the history of
selenography.
Within the Air Force this work i s being sponsored by the Air Force Cambridge Research Laboratory (AFCRL), Hanscom F i e l d , Bedford, Massachusetts, and the Aeronautical Chart and Infor- mation Center (ACIC), St. Louis, Mo. For s c i e n t i f i c
assistance in lunar charting the Air Force has solicited the aid of Dr. Gerard Ρ· Kuiper, Director, Lunar and Planetary Laboratory, University of Arizona; Professor Zdenek Kopal, Chairman, Astronomy Department, Manchester University; Dr.
John S. Hall, Director, Lowell Observatory; Dr. Jean Rosch, Director, Pic du Midi Observatory; the International
Astronomical Union and other s c i e n t i f i c i n s t i t u t i o n s . LUNAR CHART
The prevailing ACIC lunar e f f o r t has been devoted to the production of 1 to 1 million scale Lunar Aeronautical Charts identified as the LAC s e r i e s . ACIC selected the scale of 1:1,000,000 (16 miles to the inch) for charting the moon for several reasons. F i r s t , because this scale seems to be compatible with the maximum resolution obtainable from photo- graphy, supplemented by visual telescopic observations, and second, the Air Force for years has maintained a 1:1,000,000 scale coordinated series of aeronautical charts covering this earth — the World Aeronautical Chart (WAC). Although i t takes 1851 WAC charts, sheet size 22 x 29 i n . , to cover the earth, including land and water, only 14Λ LAC charts of the same size are required to cover the entire lunar surface completely. For the v i s i b l e portion (59$), including the librated regions which we see from Earth, approximately 80 charts or portions thereof can be produced.
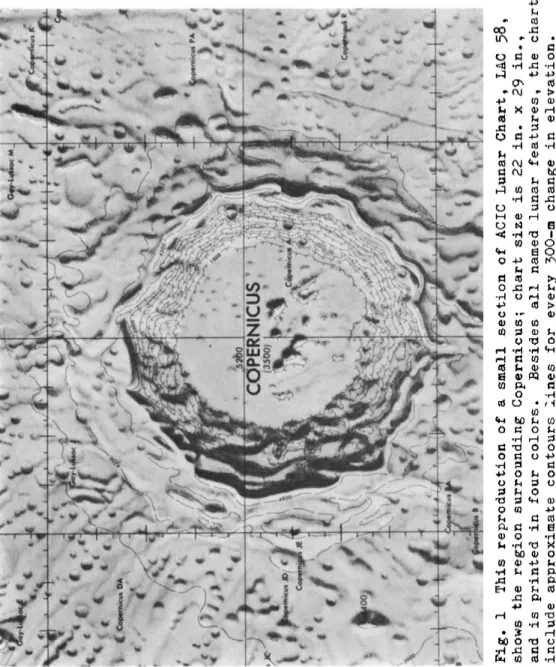
The completed LAC chart with i t s lithographed colors assumes an appearance similar to earth charts. North i s oriented at the top and the position of lunar features are designated by selenographic latitude-longitude. Surface features are a r t i s t i c a l l y drawn to give a three-dimensional e f f e c t . For example, as shown in F i g . 1 c r a t e r s , h i l l s , domes pressure r i d g e s , e t c . , are portrayed as though they were
lighted from an afternoon sun which varies so that the angle of illumination nearly matches the slope angle of the feature.
In this way, there are no cast shadows to cover up d e t a i l , yet
T E C H N O L O G Y O F LUNAR EXPLORATION
the very low or shallow features receive sufficient shading to be c l e a r l y d i s c e r n i b l e . Elevations are shown by 300-m
approximate contours. These are related to an assumed
spherical figure of the moon and a radius of 1738 km. In order to retain most of the contours on the positive side, a zero point was selected 2.6 km below the 1738 km radius.
Although i t i s not the intention of this paper to delve into the many complexities of mapping the moon, there are several fundamental factors that limit the accuracy of lunar mapping.
One obstacle i s that a l l photographs of the moon taken from the earth have various imperfections which affect resolution.
The biggest cause of trouble i s the earth's atmosphere; i t s dust obscures the view and i t s turbulence produces small random variations in scale across the moon1s image. Another obstacle i s the moon's distance from the earth. This distance of some 239,000 miles r e s t r i c t s conventional stereoscopic mapping even when maximum l i b r a t e d photography i s used.
A question most frequently asked - what i s the resolution of lunar photography? According to Dr. K u i p e r ( l )f 1 the best resolution obtained i s about four-tenths of a second of arc corresponding to about half-a-mile on the lunar surface. This matches the optical resolving power of an 11-in. visual
telescope used under perfect conditions. But with l a r g e
apertures and the "best seeing" conditions, visual observations have a resolving power of about one-tenth of one second of arc, or four times better than the best photographs.
This being the case, there i s a convincing argument for the need of visual observations to a s s i s t in photo identification of small c r a t e r l e t s , low r i d g e s , and surface features obscured by intense shadows on the moon. I n i t i a l l y arrangements were made with Dr. Kuiper f o r part-time visual use of the 4 0- i n . Yerkes r e f r a c t o r , and in 1961, through the courtesy of Dr.
John Hall, Director of Lowell Observatory, an ACIC Lunar Observation Office was established at Lowell which permits ACIC lunar cartographers to work f u l l time observing the moon with the 24-in. Clark r e f r a c t o r .
Until such time as sophisticated lunar orbiting systems provide improved selenodetic control, determining precise
elevations on the moon as related to a spherical datum has i t s limitations. Existing measures are based on the work
accomplished by Franz and Saunder some 50 years ago, but these positions have recognized systematic e r r o r s . Although new
^Numbers i n parentheses indicate References at end of paper.
measuring programs are in being with an ultimate goal of establishing a + 150-m accuracy for absolute v e r t i c a l positions; unfortunately, present limitations relegate this
standard to + 900-m.
Results have been more encouraging in determining r e l a t i v e elevations on the moon. For assistance in this area, ACIC turned to Professor Zdenek Kopal, University of Manchester.
Based on shadow measurement studies ( 2 ) made by Professor Kopal and his group (under an AFCRL contract), using time- lapse photographs taken at Pic du Midi Observatory in Southern France, r e l a t i v e elevations of lunar heights can be determined to within + 1 0 m near the center of the apparent lunar disk.
However away from the center and in the area of the f i r s t ACIC l / l million lunar charting r e l a t i v e elevations are closer to an accuracy of + 100 m.
Many photographs of varying sun angles are required to accomplish an effective shadow measuring program - for this ACIC provided Professor Kopal with a USAF K-22 a e r i a l camera.
Through arrangements with Dr. Jean Rosch, Director of Pic du Midi, the K-22 camera, which uses 9-in. r o l l film, has been mounted on the Pic du Midi 24-in. r e f r a c t o r . Astronomers of Professor Kopal1s staff operate this photographic program at the observatory, and a l l exposed films are forwarded to a USAF base in France, from which they are then flown to ACIC for processing and measurement.
As of July I962, six 1/1 million scale lunar charts have been completed (LAC 57, 58, 74, 75, 76 and 93) - ( F i g . 2 ) . Future programs c a l l f o r f i r s t producing those charts that span the equator and then progressing north and south to complete adjacent areas. A l l charts of the LAC series are available to governmental users and c i v i l i a n organizations performing contract work for the U. S. Government. In addition, arrangements have been made for public sales through the Superintendent of Documents, Government Printing Office, Washington 25, D. C.
USAF LUNAR ATLAS
The f i r s t significant Air Force cartographic contribution in support of lunar missions was the USAF Lunar Atlas, issued i n I960. This Atlas represents a comprehensive selection of the finest lunar photography ever assembled.
Air Force plans for the preparation of this work were made in early 1958 by the Air Force Cambridge Research Laboratory.
T E C H N O L O G Y O F LUNAR E X P L O R A T I O N
Dr. Gerard P. Kuiper, who was at that time Director of Yerkes and McDonald Observatories, undertook the task of supervising this work under an Air Force contract. Actually he conceived the project i n 1955, and i t was discussed at the International Astronomical Union Meeting in Dublin. His inspection of 500 plates taken between 1919 and 1927 by the l a t e Dr. F . Pease at the Cassegrain focus of the 10O-in. Mount Wilson telescope convinced him that using existing lunar photography was preferred since duplicating the best work already available would take many years and might possibly not completely
succeed. Dr. Kuiper determined that i t was preferable to base the atlas on existing plate collections at Mount Wilson, Lick, and Pic du Midi Observatories, supplemented by new photography from the McDonald and Yerkes Observatories.
Of the several thousand lunar plates analyzed, 280 of the best photographs were f i n a l l y selected for publication. The
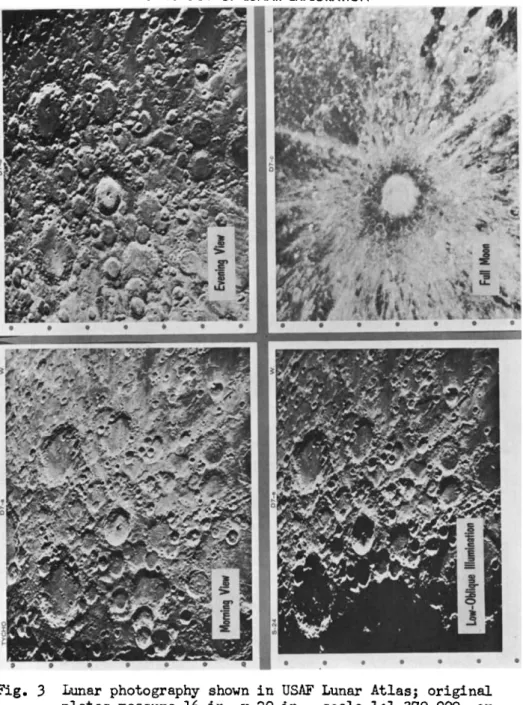
scale used was 100 i n . to the lunar diameter or about 20 miles to the inch. B r i e f l y , Dr. Kuiper divided the v i s i b l e surface of the moon into 4Λ f i e l d s , with each f i e l d covered by a minimum of four photographs taken under different illumina- tions. For example, F i g . 3 shows one morning and one evening view under moderate high sun, a f u l l moon shot with high sun,
and a supplementary view with low oblique illumination. The different angles of the sun's rays cause some lunar surface features to become clearer while others completely disappear from view.
Distribution of this Atlas for U. S. Government use i s being accomplished by the Aeronautical Chart and Information Center. Substantially the same information, identified as the Photographic Lunar Atlas, edited by Dr. Kuiper, i s available for nongovernment use on a nonprofit basis through the University of Chicago Press.
ORTHOGRAPHIC ATLAS OF THE MOON
Long before the USAF Lunar Atlas was completed, Dr. Kuiper and the Air Force made plans to issue several supplements to the basic photographic a t l a s . The f i r s t of these was to be a photo map. In other words, photographs of the moon containing a definite map projection. Thus, the Orthographic Atlas of the Moon came into being. From the basic A t l a s , containing 280 photographs, a selection was made of the best photographs covering each of the 4Λ f i e l d s , into which the lunar surface was divided. In some instances a single photograph would not show a l l features in a particular f i e l d to best advantage;
therefore, supplementary f i e l d s were selected for a total of
60 sheets to cover the entire v i s i b l e lunar surface in the Orthographic Atlas.
On these sheets, two research associates of Dr. Kuiper, D. W. G. Arthur and E. A. Whitaker, began the task of
plotting some 5000 selenographic base points using the position catalogs of Franz and Saunder and also some unpublished
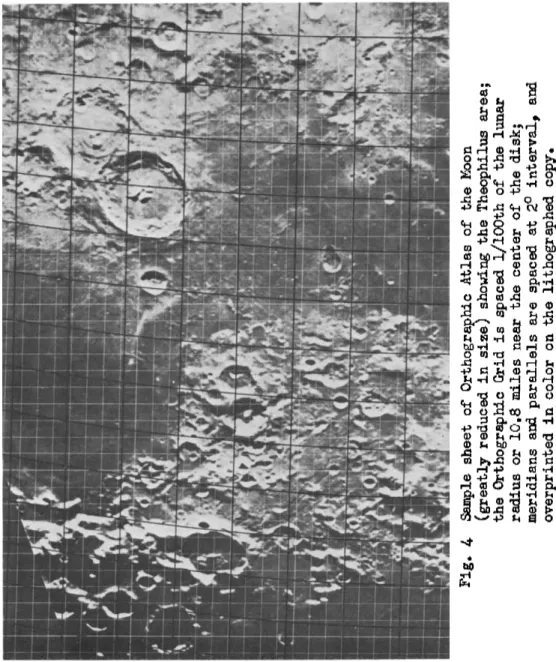
l i s t i n g s by Arthur, From these points, a standard rectangular g r i d , familiar to a l l astronomers, was computed for every 1/I00th of the lunar radius (approximately £ i n . apart on the published copy). These l i n e s , which would normally be
straight l i n e s on a s t r i c t l y orthographic projection, became s l i g h t l y curved on each plate because of the independent l i b r a t i o n within each photograph. ACIC furnished technical assistance for this project in the form of electronic computer service and the engraving of a l l g r i d s . Also, the Air Force, accustomed to working with latitude/longitude on t e r r e s t r i a l maps, constructed a set of meridians and p a r a l l e l s spaced at 2° intervals for each sheet. In the f i n a l publication the standard orthographic grid was printed in white, while the latitude/longitude projection was overprinted in color ( F i g . 4 ) .
Scientists and professional astronomers engaged in lunar research w i l l find this Atlas extremely useful in determining positions on the moon. Also, lunar cartographers now have at their disposal, for the f i r s t time, a set of reference grids accurately plotted on lunar photographs which can be used for horizontal positioning of lunar features.
The Orthographic Atlas of the Moon, identified by the Air Force as Supplement 1 to the USAF Lunar Atlas, was distributed by ACIC to government users in 1961. A s c i e n t i f i c , nonprofit edition, edited by Dr. Kuiper, i s available to others through the University of Arizona Press.
R3CTIFIED LUNAR ATLAS
Scheduled for publication in the F a l l of 1962 w i l l be
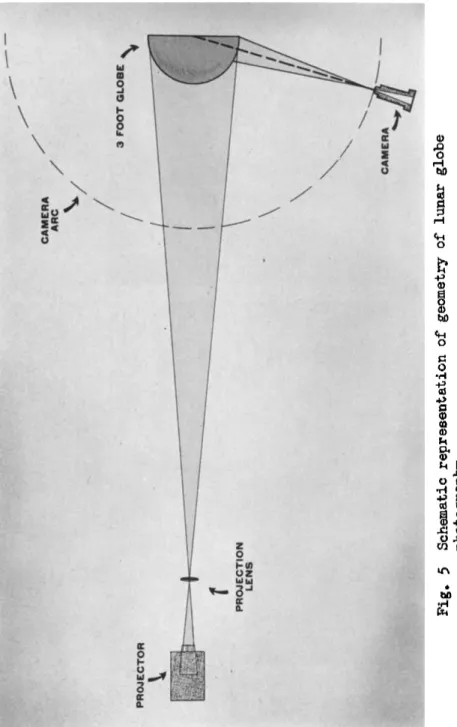
Supplement 2 to the USAF Lunar Atlas, t i t l e d "Rectified Lunar Atlas," also edited by Dr. Kuiper. As the t i t l e implies, this Atlas w i l l contain r e c t i f i e d lunar photographs which are
obtained by the technique of projecting normal lunar photo- graphy onto a hemispherical easel ( F i g . 5) and in turn photo- graphing this with a camera aimed always at the center of the hemisphere, so that the resulting view i s a v e r t i c a l of some part of the lunar surface.
T E C H N O L O G Y O F LUNAR EXPLORATION
This technique U) in effect removes the foreshortening which naturally increases as one goes toward the limb and theoretically provides the observer with a view of the moon from a point dir ec tly overhead* Craters near the limb which are e l l i p t i c a l in shape on normal lunar photography now become nearly circular in the r e c t i f i e d photographs. An example of this i s shown in F i g . 6.
Although the projected image never can show more d e t a i l than i s recorded on the o r i g i n a l photograph, r e c t i f i e d photography provides the lunar scientist with a new perspective of the moon. This type photography i s beneficial for studying the
lunar ray systems, the concentric and r a d i a l structures associated with lunar maria and similar areas. To aid in the interpretation of r e c t i f i e d limb photography, Alika Herring (l5),a research associate of Dr. Kuiper, i s making a series of freehand drawings of the limb regions to be included as supplementary reference material.
The completed Rectified Lunar Atlas w i l l consist of 30 f i e l d s of 30° χ 30° each, at an approximate scale of 1 to 3%
million on a sheet 12 i n . χ 15 i n . Each f i e l d w i l l be shown on at l e a s t three photographs, one f u l l moon and two low obliques with opposite direction of illumination. Distribu- tion w i l l be made by ACIC and the University of Arizona Press under the same arrangements as for the Orthographic Lunar A t l a s .
LUNAR MOSAIC
The military, for a number of years, have been producing
"Photo Maps" of this earth from a e r i a l photographs. Using this same technique, ACIC has published a photo mosaic of the moon identified as the "USAF Lunar Reference Mosaic."
The primary objective i n producing a lunar mosaic was to combine the best features from a number of photographs, because lunar features which show up quite prominently under low or medium illumination completely disappear on a f u l l moon photograph. Therefore, from a collection of many photographs taken at Yerkes, McDonald, and Mount Wilson, a careful
selection was made of the best features with a f a i r l y
constant sun angle. Each area in turn was copied to a common scale and r e c t i f i e d to mean l i b r a t i o n in order for i t to match or f i t adjacent sections. This i s essentially the same
process as used for removing the "tip" and "tilt" from a e r i a l photographs.
For control, the positions of Franz and Saunder, published under the auspices of the International Astronomical Union
(IAU), were used. Points were identified on the photographs and plotted to an orthographic projection with latitude- longitude spacing of 10 degrees. Most of the prominent features are named in accordance with the 1935 IAU
nomenclature system with minor changes introduced in the Photographic Lunar Atlas edited by Dr. Kuiper.
When one sees the USAF Lunar Reference Mosaic for the f i r s t time, i t is quite evident that direction has been changed contrary to astronomical convention of placing north at the bottom (corresponding to the telescopic view in the northern hemisphere). The Air Force's position on cardinal direction is that Maps and Charts of the Moon should be oriented with North at the top and East and West 180° to the right and l e f t respectively. Professional astronomers engaged in current space programs have recognized the need for this change and the IAU General Assembly of 1961 adopted a resolution to the effect that Lunar Astronautical Maps would be positioned with North at the top and East and West the same as on terrestrial maps.
The USAF Lunar Reference Mosaic has been published in two sizes. LEM 1, scale 1:5,000,000, lunar diameter 27 in. and LEM 1A, scale 1:10,000,000, lunar diameter 13è i n . In the Fall of 1962, ACIC plans to reproduce this same mosaic in a larger size suitable for wall mounting.
REFERENCES
1 Kuiper, G.P., "Photographic Lunar Atlas," University of Chicago Press, I960.
2 "Studies in Lunar Topography," Vol I through V I I ,
Astronomical Contributions from the University of Manchester (1959).
3 Arthur, D.W.G. and Whitaker, E.A., "Photographic Map of the Moon," Communications of the Lunar and Planetary Laboratoiy Vol I , The University of Arizona 1962, pp 21-22.
U Spradley, L . H . , "Lunar Globe Photography," Communications of the Lunar and Planetary Laboratory, Vol 1, The University of Arizona 1962, pp 31-34·
5 Herring, A . K . , "Rectified Drawings of the Lunar Limb Areas," Communications of the Lunar and Planetary Laboratory, Vol 1, The University of Arizona 1962, pp 27, 28.
TECHNOLOGY OF LUNAR EXPLORATION
Fig. 1 This reproduction of a small section of ACIC Lunar Chart, LAC 58, shows the region surrounding Copernicus; chart size is 22 in. χ 29 in., and is printed in four colors. Besides all named lunar features, the charts include approximate contours lines for every
300~
m change in elevation.F i g . 2 Index to the LAC Series, scale 1:1,000,000.
T E C H N O L O G Y O F LUNAR E X P L O R A T I O N
Fig. 3 Lunar photography shown i n USAF Lunar Atlas; o r i g i n a l plates measure 16 i n . χ 20 i n . , scale 1:1,370,000, or
about 20 miles to the inch; each of 4Λ divisions of the v i s i b l e lunar surface i s covered by β set of at l e a s t four photographs under different illumination:
one morning view and one evening view under moderately high sun, a f u l l moon view with high sun, and a
supplementary view generally with low oblique illumination.
Fig. 4 Sample sheet of Orthographic Atlas of the Moon (greatly reduced in size; showing the Theophilus area; the Orthographic Grid is spaced l/lOOth of the lunar radius or 10.8 miles near the center of the disk; meridians and parallels are spaced at 2° interval, and overprinted in color on the lithographed copy*
TECHNOLOGY OF LUNAR EXPLORATION
Fig. 5 Schematic representation of geometry of lunar globe photography.
globe projection; note the craters surrounding Mare Crisium assume a circular shape on r e c t i f i e d imagery;
photograph i s oriented with North at the top. Normal lunar photograph, Top. Rectified lunar photograph, Bottom.