dOi: 10.1556/168.2019.20.3.7
Introduction
The Iberian lynx (Lynx pardinus Temminck, 1827) has been regarded as the most threatened predator in Europe (Mallinson 1978) and the most endangered species of the Felidae family (Nowell and Jackson 1996). In 2002 it was catalogued as ‘Critically endangered’ in the ‘Red list of threat- ened species’ by the International Union for Conservation of Nature (IUCN, San Miguel 2006). Nevertheless, as a result of conservation and recovery actions, its threat category was officially reduced in 2015 to ‘Endangered’ (Rodríguez and Calzada 2015).
Until the middle of the nineteenth century, the Iberian lynx had not been subject to high human pressure, as it could be found in practically the entire Iberian Peninsula (Graells 1897, Valverde 1963, Rodríguez-Varela et al. 2015). However, lynx populations began their decline after 1950 (Valverde 1963), due to the synergic effect of predator control laws and the steep decline of wild rabbit (Oryctolagus cuniculus L.) popu- lations (Cabezas-Díaz et al. 2009). Consequently, the Iberian lynx populations underwent a severe decline throughout
the entire Iberian Peninsula at the end of the twentieth cen- tury (Delibes 1990, Virgós 1994, Virgós and Travaini 2005), bringing the species to the verge of extinction and relegating it to spaces with very restricted features that currently make up its known habitat. By that time the species had lost 98% of its distribution area (Rodríguez and Delibes 1992), with two large populations remaining, known as Doñana-Aljarafe and Andújar-Cardeña (Simón et al. 2011), but also some small groups in the centre of the Iberian Peninsula (Torres et al.
1998, Guzmán et al. 2005, Fundación CDV-Hábitat 2006, San Miguel 2006, Alda et al. 2008).
After six decades of decline, Iberian lynx populations have experienced continuous growth as a result, mainly, of the execution of ex-situ conservation actions (Simón et al.
2011, Rodríguez and Calzada 2015). Therefore, the estimated number of free ranging lynxes in the Iberian Peninsula is cur- rently 589 (Simón 2017).
Knowledge of the geographic distribution of species, both past (Rodríguez-Varela et al. 2015) and present (Calzada et al. 2007, Clavero and Delibes 2013), and its species-habitat relationships (Morrison et al. 2012) are extremely important
Using MaxEnt algorithm to assess habitat suitability of a potential Iberian lynx population in central Iberian Peninsula
P. Alfaya
1,3, J. G. Casanovas
1,†, J. Lobón-Rovira
1, B. Matallanas
2, A. Cruz
2, P. Arana
2and G. Alonso
11Educational Unit of Ecology, Department of Biodiversity, Ecology and Evolution, Complutense University of Madrid.
Avda. José Antonio Nováis 12, 28040 Madrid, Spain
2Educational Unit of Genetics, Department of Genetics, Physiology and Microbiology, Complutense University of Madrid. Avda. José Antonio Nováis 12, 28040 Madrid, Spain
3Corresponding author. Email: palfaya@ucm.es
† In memoriam
Keywords: Ecology; Lynx pardinus; Maximum entropy modelling; Species potential distribution.
Abstract: Iberian lynx distribution is currently restricted to the south of the Iberian Peninsula. Nevertheless, there is evidence of the presence of several small groups in the peninsular centre that have been forgotten by management and conservation ac- tions. In this research, we gathered evidences of Iberian lynx presence along 21 transects located in the southwest of the Madrid province. In these transects lynx DNA was identified in 47 scats, which scientifically proves the presence of the species in that location. Using these locations (presence-only data) we built a maximum entropy model (MaxEnt) to estimate the suitability of the study area for the species. Our results show the existence of an almost continuous area that is approximately 744 km2 that is suitable for the Iberian lynx. Seventy-eight percent of this area is within the Natura 2000 network and, therefore, it falls under regulations to preserve and restore habitat types, flora and fauna. This study shows the suitability of this territory has for the Iberian lynx.
Abbreviations: AUC–Area Under the Curve; GAM–Generalised Additive Models; GLM–Generalised Linear Models; IUCN–
International Union for Conservation of Nature; LOESS– Locally Estimated Scatterplot Smoothing; NTD5000–National Topographic Database 1:50,000; PCA–Principal Component Analysis; SAC–Special Area of Conservation; SCI–Site of Community Interest; SDIM–Spatial Data Infrastructure of the Madrid community; SPAB–Special Protected Area for Birds.
tools for establishing the theoretical framework that allows us to set conservation goals and priorities (Barea-Azcón et al.
2007, Tobler et al. 2008, Clavero and Delibes 2013), as well as for defining the conservation status of populations (Gugolz et al. 2008). The absence of such information could lead to incorrect management and/or decision making as well as the development of biased conservation programs.
There is a considerable amount of well-documented in- formation that includes the western region of the Madrid province within the distribution range of the Iberian lynx (Rodríguez and Delibes 1992, Aldama 1996). In spite of this, and probably due to the small size of the population, the species has been considered extinct from this territory since the early twenty-first century (Guzmán et al. 2002, 2004, Gil-Sánchez and McCain 2011, Garrote and de Ayala 2015).
Nevertheless, reports of Iberian lynx presence in this territory have not ceased in recent years (Virgós and Casanovas 1993, Boscaje S.L. 2000).
Mammal carnivores are usually scarce, elusive and noc- turnal (Barea-Azcón et al. 2007); therefore, classic sampling methods such as direct observation or capture-recapture techniques often fail to record such organisms (Tobler et al. 2008). Consequently, alternative non-invasive sampling methods such as sightings and other evidence, principally footprints and scats (Din and Nawaz 2010, Frey et al. 2013), have been emphasised in recent years (Long et al. 2012). This kind of information has been widely criticised because of the likelihood of error when assigning the samples to one species or another (Boshoff and Kerley 2010, Molinari-Jobin et al.
2012, Garrote and de Ayala 2015).
For this reason, other non-invasive techniques (Long et al. 2012), such as camera trapping or hair traps to obtain DNA, among others, have become crucial tools for study- ing elusive species, such as mammal carnivores (Kohn and Wayne 1997, Gompper et al. 2006, Garrote et al. 2011). Of all these techniques, the genetic analysis of scats, regarded
as critical samples due to their poor conservation (Cruz et al.
2018), is one of the most reliable for obtaining scientifically documented information about the presence, distribution and abundance of elusive species (Palomares et al. 2002, Creel et al. 2003, Rodgers and Janečka 2013, Cruz et al. 2018).
The ecological and ethological features of mammal car- nivores impose serious limitations on their study (Torre et al.
2003, Chávez et al. 2013) due to the scarce number of individ- uals and the fact that their behaviour is extremely discreet and elusive (Blanco et al. 1997, San Miguel 2006). The Iberian lynx has a social and spatial organisation that makes its study significantly more difficult, since it is territorial and solitary (San Miguel 2006, Calzada et al. 2007, Martín et al. 2007).
Moreover, young individuals go through a five-month disper- sive period in which their movements are random (Ferreras et al. 2004, San Miguel 2006), with a habitat plasticity that is higher than when they are choosing where to settle down (Gastón et al. 2016). As a consequence, lynxes are extremely difficult to find and track using conventional techniques.
Iberian lynx presence within this territory has been veri- fied through specific genetic identification analyses especial- ly designed for the treatment of critical samples (Cruz et al.
2018). We carried out an ecological characterisation of the territory based on climatic, physiographic and anthropic vari- ables. We then used maximum entropy modelling to estimate the suitability of this territory with the aim of determining if it offers features that are suitable for species survival.
Material and methods Study area
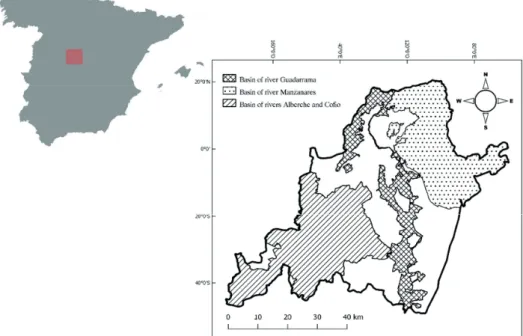
The western region of the Madrid province (Fig. 1) has a Mediterranean climate, as most of the Iberian Peninsula does. The marked seasonality of temperatures, the summer droughts and a lack of regular precipitation are thus the main Figure 1 – Location of the study area within the Iberian Peninsula. The three protected areas by
Natura 2000 within the study area are shown here. Protection status of this areas are: Site of Community Interest (SCI), Special Area of Conservation (SAC) and Special Protected Area for Birds (SPAB).
Figure 1. Location of the study area within the Iberian Peninsula. The three protected areas by Natura 2000 within the study area are shown here. Protection status of this areas are: Site of Community Interest (SCI), Special Area of Conservation (SAC) and Special Protected Area for Birds (SPAB).
climatic features (Zabía and del Olmo 2007). The forest veg- etation is predominantly evergreen (Quercus ilex, Pinus sp.
etc.) with a stratum of xerophilous shrubs (Cistus ladanifer, Lavandula pedunculata, Rosmarinus officinalis, Thymus vul- garis, etc., García and Pérez 2016).
With the exception of some relatively large cities, this ter- ritory is controlled by well-integrated human activities that depend on the characteristics of the natural environment, such as traditional mixed rural systems based on forestry and pas- toralism (Schmitz et al. 2007). In spite of the considerable number of population centres in the region, the urbanised area is low and the degree of naturalness is high (Arnaiz-Schmitz et al. 2018).
In addition, the fauna in the Madrid province is highly diverse, with some species requiring specific protection meas- ures, such as those that can be found in Ministry of Environment and Ordination of the Territory (2017). Of note are predators such as the wildcat (Felis silvestris), the European otter (Lutra lutra) and the Iberian lynx (Lynx pardinus).
Field study
Prior to the field study, we reviewed the existing docu- mentation on the presence of Iberian lynx in this territory, in- cluding two technical records (Aldama 1996, Boscaje 2000), as well as the ‘Atlas and Red Book of Terrestrial Mammals of Spain’ (Palomo et al. 2007) and the ‘Regional Catalogue of Endangered Species of Wild Flora and Fauna, and Unique Trees of Madrid province’. With the information gathered from these documents, we designed 21 transects, each seven
km long. Along these transcects, a minimum of two research- ers searched and collected scats that were morphologically similar to Iberian lynx scat, as described in Rodríguez (2003) and Iglesias and España (2010). The transects were combed twice per year, at the beginning of summer (June-July) and in autumn (October-November), for three consecutive years, from 2015 to 2017. They were searched on foot along path- ways, firebreaks, boundaries between scrubland and pasture or following other less regular landscape structures where evidence (scats) was more likely to be found (Martín et al.
2007). These structures could be at the base of large rocks, over rabbit holes, near rivers, etc.
The scats were analysed following the methodology de- scribed in Cruz et al. (2018). This methodology minimizes, as much as possible, the subjectivity inherent in visual identifi- cation in the field, providing us with scientifically confirmed locations of the presence of the species.
Ecological characterisation
In order to determine the availability of a suitable habi- tat for the Iberian lynx, we must focus on the macrohabitat scale, understood as the average minimum area that indi- viduals of a certain species use for their biological functions (Morris 1987). To perform a study at this scale, we selected 17 climatic, physiographic and anthropogenic variables (Table 1).
Variables were selected for their potential influence on the distribution of the species and their availability to the en- tire study area. Because of the latter, data related to the pres- Table 1. Code, description and source of climatic, physiographic and anthropic variables considered.
Code Variable Source
Human pressure
Rdens Road density (m/km2) Compiled by author
Topography
RivDist Distance to nearest river (m) Compiled by author
Alt Altitude (masl) Compiled by author
Vegetation structure
Bare Bare soil coverage (%) MDA Federal (2004)
Herb Herbaceous coverage (%) MDA Federal (2004)
Tree Tree coverage (%) Sexton et al. 2013
Climate
Iso Isothermality (Δ diurnal temperature / Δ annual temperature) (*100) Hijmans et al. (2006)
MaxTwm Maximum temperature of warmest month Hijmans et al. (2006)
MDRange Mean diurnal range (Mean of monthly (max temp - min temp)) Hijmans et al. (2006)
MinTcm Min temperature of coldest month Hijmans et al. (2006)
Pdriem Precipitation of driest month Hijmans et al. (2006)
Pann Annual precipitation Hijmans et al. (2006)
Psea Precipitation seasonality (coefficient of variation) Hijmans et al. (2006)
PWetM Precipitation of wettest month Hijmans et al. (2006)
TannRange Temperature annual range Hijmans et al. (2006)
Tmean Annual mean temperature Hijmans et al. (2006)
Tsea Temperature seasonality (standard deviation*100) Hijmans et al. (2006)
ence, abundance or density of potential prey and/or competi- tors were not taken into consideration.
Climatic variables were extracted from the WorldClim database at a 30-second spatial resolution (Hijmans et al.
2006). Beltrán and Delibes (1994) demonstrate that tempera- ture and precipitation have a significant influence over the daily activity patterns of the Iberian lynx. They showed that these climatic factors can display a differential effect depend- ing on whether it is day or night. For example, the maximum high temperature at night will increase Iberian lynx activ- ity, while during the day it has the opposite effect. Authors suggest that this influence could be an indirect effect of prey availability variations and, therefore, be related to Iberian lynx fitness and habitat suitability. We selected 11 variables (Table 1) to gather all possible climate features in order to reflect daily, seasonal and annual climate patterns that could influence habitat suitability.
The Iberian lynx is considered a habitat specialist that is bound to heterogeneous Mediterranean scrubland and for- est (Valverde 1963, Rodríguez and Delibes 1992, Palomares 2001). It can be described as not entirely a forestry species but one adapted to mosaic landscapes (San Miguel 2006).
Scrubland has been shown to be highly important for the spe- cies in previous research, where shrub coverage in areas were lynxes live was higher than 50% (Rodríguez and Delibes 1990, Palomares 2001). Recently Gastón et al. (2019) demon- strated that considering tree coverage when modelling habitat selection improves the performance of the model, showing the preference of the species for scattered woodlands (5-25%
tree cover). Taking this previous knowledge into account, we selected three vegetation cover variables for the analysis (Table 1). As suggested by Gastón et al. (2019), we consid- ered that these variables provide a better proxy for potential prey availability and shelter, and as a consequence, for Iberian lynx habitat suitability, than more general land cover classes.
Human pressure is one of the main reasons that led mam- mal carnivores to their global decline (Cardillo et al. 2004), with road mortality having special relevance for the Iberian lynx (Garrote et al. 2018). Road density is a reliable proxy of human pressure (Llaneza et al. 2018). We obtained both layers of highways and minor paved roads from the National Topographic Database 1:500.000 (NTD500). Then we built a road density raster layer by dividing road longitude (m) with- in each grid cell (1 km2) into which the territory was divided.
Known Iberian lynx populations are located at between 400 and 1,300 meters above sea level, with the exception of the Doñana-Aljarafe population, which is close to sea level (Rodríguez and Delibes 1990). Low- and mid-mountain land- scapes are associated with a higher diversity and abundance of potential prey, but also with lithological and edaphic fea- tures related to shelter and low human pressure (San Miguel 2006). We used a 20 m interval level curve layer, extracted from the Spatial Data Infrastructure of the Madrid province (SDIM), to build a digital elevation model.
In the Iberian Peninsula, some predators such as the badger (Meles meles L.), red fox (Vulpes vulpes L.), wildcat and stone marten (Martes foina Erxleben, 1777) used riparian
woodlands in which they find shelter and food (Virgós 2001).
High habitat heterogeneity together with the microclimate present in this kind of environment provide Iberian preda- tors with a wide range of trophic resources (small mammal communities, birds and fleshy fruits) and shelter (scrubland cover and hollow trees), which are fundamental aspects for their survival (LaRue et al. 1995). We built a distance ma- trix between each grid cell centroid and the nearest river and converted it into a raster layer. The river layer was extracted from NTD500.
All variables were converted from raster to a 1 km × 1 km grid. When more than one pixel overlapped with the same cell of the grid, we calculated the average value of the variable inside the cell. All operations related to the spatial treatment of data were realised in QGIS (QGIS Development Team, 2017).
Usually, environmental variables show high correlations (Appendix 1) that can significantly affect the results obtained and, as a consequence, the conclusions extracted (Graham 2003). To avoid problems derived from multicollinearity, we performed a Principal Component Analysis (PCA) based on the correlation matrix in the statistical software R (R Core Team, 2017), using the package FactoMiner (Le et al. 2008).
Component solutions were not rotated to extract factors in order of their importance (Hair et al. 1998). We retained only those components with an eigenvalue (λ) higher than or equal to one.
To test habitat suitability within the territory, we used a maximum entropy model (MaxEnt software version 3.4.1) because it is the most appropriate method for making infer- ences based on incomplete information (Phillips et al. 2006), as is the case of presence-only data. Such models present ad- vantages with regard to others, such as the GLM or GAM models: i) only presence data are required, together with en- vironmental information for the whole study area, ii) overfit- ting is avoided, iii) its generative, rather than discriminative, approach can be an advantage when the amount of data for training is limited (Phillips et al. 2006). To run the model, we used the genetically confirmed locations of Iberian lynx within the study area as presences and PCA extracted compo- nents with λ ≥ 1 as independent variables.
To run the MaxEnt algorithm, we used 75% of the data for model training and the remaining 25% for test fitting.
This was estimated through the area under the curve (AUC), which allows us to discern whether the predictive capacity of the model is significantly different or not from that ex- pected in a random model (AUC = 0.5) (Phillips et al. 2006).
Background samples were randomly placed in order to gather the entire environmental variability of the study area and avoid model parameter overestimation (Warton and Shepherd 2010, Northrup et al. 2013). The regularisation multiplier was adjusted at two for overfitting avoidance (Radosavljevic and Anderson 2014).
MaxEnt provides an estimation of presence probability for a species in each pixel of the map (Phillips and Dudik 2008) by comparing probability densities of the background sam- ples and presence records (Elith et al. 2011). Nevertheless, as
is explained in Mateo et al. (2011), presence probability is an exorbitant interpretation of what a measure of environmental similarity really is. Thus, these authors state that this type of results should be understood, at most, as a value of suitability of a territory for the development of a certain species, ac- cording to the environmental variables considered. To make results interpretation easier, suitability values were classified into four categories, as is recommended in Chefaoui et al.
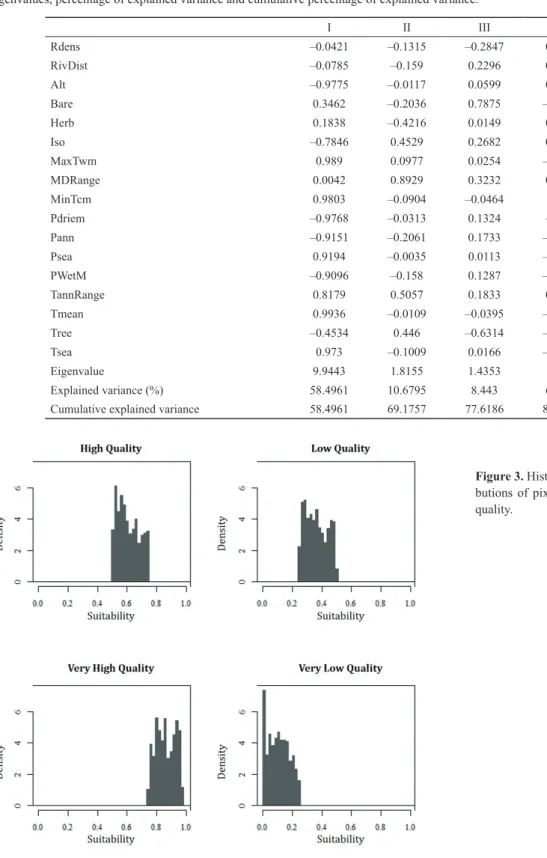
(2005): very low quality (0-0.25), low quality (0.26-0.50), high quality (0.51-0.75) and very high quality (0.76-1).
Density distributions of these categories were plotted in a his- togram. In addition, the effect that each component extracted from the PCA had on the habitat suitability was represented in a scatterplot.
Results
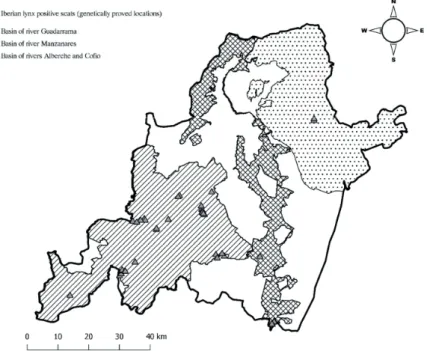
During the field study, we collected 84 scats of which 47 had positive results in the genetic analysis (Fig. 2). It should be noted that the scats were gathered outdoors and were thus exposed to erosive agents that can degrade and break down genetic material, making the appearance of false negatives relatively frequent, even when our technique has a high speci- ficity and sensitivity.
Results from the PCA (Table 2) show that component I explains 58.50% of the total variance of the data, being positively correlated with temperature-related variables and precipitation seasonality and negatively so with those related with precipitation, altitude and isothermality. Component II absorbs 10.68% of variance and is positively correlated with temperature diurnal and annual ranges, while component III is positively correlated with bare soil cover and negatively with tree cover. Finally, component IV shows a positive cor- relation with herbaceous coverage. Altogether, the four re- tained components (λ ≥ 1) explain 84% of total variance.
The adjusted model shows a significantly higher predic- tive capacity (training AUC = 0.859, test AUC = 0.884) than one whose probability distribution tends towards maximum entropy (AUC = 0.5). Obtained suitability results (average
= 0.3154, standard deviation = 0.2739, Fig. 3) demonstrate the existence of a polarised territory for the Iberian lynx. The most repeated suitability values were those that denote a low quality habitat for the species. Nevertheless, density prob- ability values in the second place are those that denote a very high quality habitat, followed by those of high quality. This shows that the territory studied, despite having a considerable surface of unsuitable habitat for the species, also presents a high number of pixels whose suitability is high or very high.
When representing this results spatially (Fig. 4), we confirm the pattern observed in Figure 3.
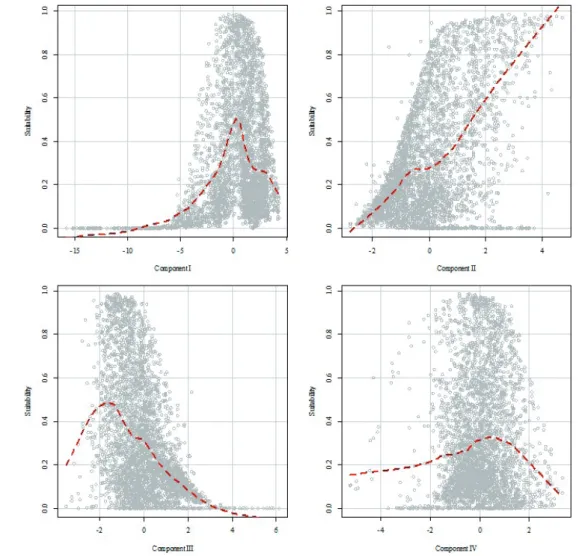
Scatterplots from Figure 5 allow us to describe main features of an Iberian lynx suitable area. On the one hand, suitability increases with values closer to zero of component I and II. This shows the suitability of areas with moderate temperatures, perceptible diurnal range and marked season- ality but low precipitation rates. On the other hand, compo- nent III shows a trend of suitability increase in areas with low tree cover , while it decreases as much as bare soil increases.
Component IV does not show any clear trend, although there is a considerable decrease of habitat suitability when it takes high values.
The study area has an approximate surface of 3,077 km2, of which 12.9% (398 km2) presents a high suitability and 11.2% (346 km2) a very high one. Altogether, they amount to 744 km2 whose environmental characteristics are suitable for the Iberian lynx, with 90% of this area falling within the Natura 2000 network of protected areas (86 km2 within the SCI/SAC of the Guadarrama river basin, 545 within the SCI/
SCZ/SPAB of the Alberche and Cofio river basin) and 40 km2 within the SCI/SAC of the Manzanares river basin.
Figure 2 – Map of proved Iberian lynx locations through genetic analyses of specific identification (positive scats) within the study area.
Figure 2. Map of proved Iberian lynx locations through genetic analyses of specific identification (positive scats) within the study area.
Discussion
In this study we demonstrate that species recorded cita- tions can provide relevant information for the identification of areas of priority interest for sampling efforts with the aim of locating an elusive species, which is extremely difficult to see and track.
There is some debate about the ecological interpretation that should be given to results obtained through this meth- od (Mateo et al. 2011). Nevertheless, here we considered that what the model really estimates is the fundamental or Grinnellian niche (James et al. 1984) of the target species.
For Hutchinson (1957) this is the ‘n-dimensional hypervol- ume’, ‘every point in which corresponds to a state of the en- Table 2. Results of principal component analysis. The table shows correlations between retained components and the original variables, eigenvalues, percentage of explained variance and cumulative percentage of explained variance.
I II III IV
Rdens –0.0421 –0.1315 –0.2847 0.2521
RivDist –0.0785 –0.159 0.2296 0.1788
Alt –0.9775 –0.0117 0.0599 0.0299
Bare 0.3462 –0.2036 0.7875 –0.3153
Herb 0.1838 –0.4216 0.0149 0.8051
Iso –0.7846 0.4529 0.2682 0.1448
MaxTwm 0.989 0.0977 0.0254 –0.0331
MDRange 0.0042 0.8929 0.3232 0.2807
MinTcm 0.9803 –0.0904 –0.0464 –0.1
Pdriem –0.9768 –0.0313 0.1324 –0.026
Pann –0.9151 –0.2061 0.1733 –0.1486
Psea 0.9194 –0.0035 0.0113 –0.0943
PWetM –0.9096 –0.158 0.1287 –0.1234
TannRange 0.8179 0.5057 0.1833 0.1251
Tmean 0.9936 –0.0109 –0.0395 –0.0555
Tree –0.4534 0.446 –0.6314 –0.2445
Tsea 0.973 –0.1009 0.0166 –0.0892
Eigenvalue 9.9443 1.8155 1.4353 1.0883
Explained variance (%) 58.4961 10.6795 8.443 6.4018
Cumulative explained variance 58.4961 69.1757 77.6186 84.0205
Figure 3. Histograms of density distri- butions of pixels according to habitat quality.
vironment which would permit a species to exist indefinitely’.
Therefore, the model provides us with an over-estimation of the potential habitat since we have not taken into considera- tion inter-specific relationships with competitors, the disper- sal capacity or the population dynamics, which would shape the realised or Eltonian niche (Guisan and Thuiller 2005).
Hence, the results obtained should be interpreted with cau- tion and considering their limitations.
The adjusted model showed the relevance that climatic features have for the Iberian lynx. Suitability is higher in areas with low precipitation and moderate temperatures, but also with marked thermal differences between day and night. These results agree with those obtained by Beltrán and Delibes (1994). According to these authors, this trend would be a consequence of prey availability and not an effect of a narrow climatic tolerance. For example, under high precipita- tion and/or low temperatures, prey activity would be reduced, forcing lynxes to spend more time and energy in forage, which would compromise their survival.
Our results show the species preference mixed vegeta- tion structures where there is no predominance of any specific habitat, although there is shown a trend to inhabit areas with scattered trees. As stated above, the Iberian lynx is known for dwelling in mosaic landscapes, where woodland and scrub-
Figure 4. Habitat suitability results obtained after maximum en- tropy model (MaxEnt) adjustment. Light grey pixels represent those with suitability values comprised between 0.5-0.75 (high quality), while dark grey pixels are those with suitability values higher than or equal to 0.76 (very high quality). Dashed lines represent the main rivers within the study area.
Figure 5. Influence of the four extracted components over MaxEnt habitat suitability results.
Hollow circles rep- resent each 1 km × 1 km cell in which the territory was divided, while the dashed line was calculated using locally estimated scatterplot smooth- ing (LOESS).
land patches are mixed with open pasture spaces (Rodríguez and Delibes 1990, Palomares 2001, San Miguel 2006, Gastón et al. 2019). This landscape structure provides both shelter and food. It allows lynxes to hide, breed and rest in scrubland or woodland patches, while stalking prey that usually graze in open areas (Rodríguez and Delibes 1992). Furthermore, it is well known that mammals follow a hierarchical habi- tat selection process (Rettie and Messier 2000, Beasly et al.
2007, Llaneza et al. 2018), which means that at each hierar- chy level the variables will have different effects over species distribution. A major influence of climate in our study might be related with the scale used. In addition, the influence of road density and the distance from rivers are likely masked by variables that have an impact at a higher scale. To untangle the real effect of these variables, specific fine-scale research is needed.
The suitability map shows the existence of a wide sur- face, located at the southwest of the study area, which gath- ers suitable environmental conditions for the Iberian lynx. As was said in the introduction section, this territory presents high naturalness values and dispersed urban areas (Arnaiz- Schmitz et al. 2018), shaping a suitable, almost continuous area for the Iberian lynx. Thus, the existence of a potential Iberian lynx population within this territory that has survived in isolation from other known groups becomes a plausible hy- pothesis. This hypothesis, together with a probable low den- sity and environmental stochasticity, would make the popu- lation density-dependent with Allee effect. Therefore, the habitat suitability map provides useful information that can focus future research on determining the degree of threat for the population. We urgently recommend the assessment of the minimum viable population (Courchamp et al. 1999) in order to make sound decisions for ensuring species persistence in the study area. Furthermore, results obtained by Fordham et al. (2013) demonstrate the relevance of this territory as a ref- uge under different climatic change scenarios. Nevertheless, these authors suggest that in order to achieve species survival, population reinforcement programmes should move towards a wider reintroduction scenario.
For extant Iberian lynx populations the mitochondrial DNA (mtDNA) control region diversity is very low (Johnson et al. 2004). From a conservation perspective, populations with low genetic variability might be at risk of having a reduced capacity to adapt to changing environments and this could reduce the long-term fitness of the population (Frankham and Kingslover 2004). Even when the low genetic diversity of the Iberian lynx over the last 50,000 years is ac- cepted (Rodríguez et al. 2011), a reduction in the adaptive capacity of the species is of concern in a climate change sce- nario. As demonstrated by Alda et al. (2008), the existence of other isolated populations in central Spain could led to the identification of new low-frequency haplotypes that would be a relevant genetic resource for the known inbred populations.
The environmental conditions of the study area, together with the possible contribution of genetic diversity from an isolated potential population, make it a likely keystone for the conservation of the species. Consequently, decision-makers
should consider this population for future research and pos- sible reintroductions.
Conclusions
The territory studied shows that, for the variables consid- ered here, its environmental conditions are suitable for poten- tial Iberian lynx settlement. The territory shows a suitable, almost uninterrupted, wide area within the Natura 2000 pro- tected network. Despite this, the potential population could be under the influence of the known Allee effect, making the assessment of the minimum viable population a priority for future research.
Fordham et al. (2013) show the relevance of the central Spanish territory for the long-term survival of the Iberian lynx. This territory will serve as a climate refuge for the spe- cies, even in the worst predicted scenario of climate change.
Furthermore the existence of a new population could mean the discovery of new genetic haplotypes. This is especially relevant in a climate change scenario, in which the long-term fitness of the species could be compromised because of its low genetic diversity and, therefore, low adaptive capacity.
This potential population would make it possible to launch initiatives to raise the genetic diversity of the species.
After these considerations, decision-makers should consider the major advance this population could mean for Iberian lynx conservation.
References
Alda, F., J., Inogés, L., Alcaraz, J., Oria, A., Aranda and I. Doadrio.
2008. Looking for the Iberian lynx in central Spain: a needle in a haystack? Anim. Conserv. 11:297–305.
Aldama, J. J. 1996. Actuaciones para la conservación del lince ibé- rico en la C.A.M. LIFE proyect, informe técnico inédito. Madrid.
Arnaiz-Schmitz, C., P. Díaz, D. Ruiz-Labourdette, C. Herrero- Jáuregui, et al. 2018. Modelling of socio-ecological connectivity.
The rural-urban network in the surrondings of Madrid (Central Spain). Urban Ecosyst. 21:1199–1212.
Barea-Azcón, J.M., E. Virgós, E. Ballesteros-Duperón, M. Moleón and M. Chirosa. 2007. Surveying carnivores at large spatial scales: a comparison of four broad-applied methods. Biodivers.
Conserv. 16:1213–1230.
Beasly, J.C., T.L. Devault, M.I. Retamosa and O.E. Rhodes Jr. 2007.
A hierarchical analysis of habitat selection by raccoons in north- ern Indiana. J. Wildl. Manag. 71:1125–1133.
Beltrán, J.F. and M. Delibes. 1994. Environmental determinants of circadian activity of free-ranging Iberian lynxes. J. Mammal.
75 (2):382–393.
Blanco, J. C., L. Barrios, J.A. González-Oreja, J.G. Fonzález- Vázquez, V. Garza, G. Crema, et al. 1997. Inventario, situación y plan de recuperación del Lince Ibérico en Extremadura.
Consejería de Medio Ambiente, Urbanismo y Turismo, Junta de Extremadura.
Boscaje S.L. 2000. Actuaciones para la conservación de las pobla- ciones de lince ibérico Lynx pardina en la C.A.M. informe téc- nico inédito. Madrid.
Boshoff, A.F. and G.I. Kerley. 2010. Historical mammal distribution data: How reliable are written records?. S. Afr. J. Sci. 106 (1–2):
26–33.
Cabezas-Díaz, S., J. Lozano and E. Virgós. 2009. The declines of the wild rabbit (Oryctolagus cuniculus) and the Iberian lynx (Lynx pardinus) in Spain: redirecting conservation efforts. In: Aranoff, J.B. (ed.), 2009. Handbook of Nature Conservation: Global, Environmental and Economic Issues. Nova Science Publishers, pp. 283–310.
Calzada, J., P. Muñoz, A. Sánchez, M.J. Palacios, C. Dávila, M. A.
Simón, et al. 2007. Estrategia para la Conservación del Lince Ibérico (Lynx pardinus). Comisión Nacional de Protección de la Naturaleza.
Cardillo, N., A. Purvis, W. Sechrest, J.L. Gittleman, J. Bielby and G.M. Mace. 2004. Human population density and extinction risk in the world´s carnivores. PLOS Biol. 2(7):909–914.
Clavero, M. and M. Delibes. 2013. Using historical accounts to set conservation baselines: the case of Lynx species in Spain.
Biodivers. Conserv. 22 (8):1691–1702.
Chávez, C., A. De la Torre, H. Bárcenas, R.A. Medellín, H. Zarza and G. Ceballos. 2013. Manual de fototrampeo para estudio de fauna silvestre. El jaguar en México como estudio de caso.
Alianza WWF-Telcel, Universidad Nacional Autónoma de México, México.
Chefaoui, R.M., J. Hortal and J.M. Lobo. 2005. Potential distribution modelling, niche characterization and conservation status assess- ment using GIS tools: a case study of Iberian Copris species.
Biol. Conserv. 122:327–338.
Courchamp, F., T. Clutton-Brock and B. Grenfell. 1999. Inverse den- sity dependence and the Allee effect. Trends Ecol. Evol. 14 (10):
405 – 410.
Creel, S., G. Spong, J.L. Sands, J. Rotella, J. Zeigle, L. Joe, K.M.
Murphy and D. Smith. 2003. Population size estimation in Yellowstone wolves with error prone noninvasive microsatellite genotypes. Mol. Ecol. 12 (7).
Cruz, A., B. Matallanas, J. Lobón-Rovira, J.G. Casanovas, G. Alonso and P. Arana. 2019. Double specific nested PCR and diagnostic SNP assay for species identification in lynx fecal critical sam- ples. Conserv. Genet. Resour. 11:173–175.
Delibes, M. 1990. La Nutria (Lutra lutra) en España. Serie Técnica, I.C.O.N.A. Madrid.
Din, J.U. and M.A. Nawaz. 2010. Status of the Himalayan lynx in dis- trict Chitral, NWFP, Pakistan. J. Anim. Plant Sci. 20(1): 17–22.
Elith, J., S.J. Phillips, T. Hastie, M. Dudík, Y. Chee and C.J. Yates.
2011. A statistical explanation of MaxEnt for ecologists. Divers.
Distrib. 17:43–57.
Ferreras, P., M. Delibes, F. Palomares, J.M. Fedriani, J. Calzada and E. Revilla. 2004. Proximate and ultimate causes of dispersal in the Iberian lynx Lynx pardinus. Behav. Ecol. 15:31–40.
Fordham, D.A., H.R. Akçakaya, B.W. Brook, A. Rodríguez, P.C.
Alves, E. Civantos, M. Triviño, M.J. Watts and M.B. Araújo.
2013. Adapted conservation measures are required to save the Iberian lynx in a changing climate. Nat. Clim. Chang. 3:899–
903.
Frankham, R. and J.G. Kingslover. 2004. Response to environmental change: adaptation or extinction. In: Ferrier, R., U. Dieckman and D. Couvet (eds.), Evolutionary Conservation Biology, Cambridge University Press, Cambridge. pp. 85–100.
Frey, J.K., J.C. Lewis, R.K. Guy and J.N. Stuart. 2013. Use of anec- dotal occurrence data in species distribution models: An example based on the white-nosed coati (Nasua narica) in the American Southwest. Animals 3(2):327–348.
Fundación CBD-Hábitat. 2006. Análisis de la presencia de otros car- nívoros en relación al lince ibérico (Lynx pardinus Temminck, 1827) en Sierra Morena oriental. Conservación del lince ibé- rico en Sierra Morena oriental. Proyecto LIFE/02/E/NAT/8609
‘Recuperación de las poblaciones de lince ibérico en Andalucía’.
Informe técnico inédito, Madrid.
Gastón, A., S. Blázquez-Cabrera, G. Garrote, M.C. Mateo-Sánchez, P. Beier, M.A. Simón and S. Saura. 2016. Response to agricul-2016. Response to agricul- ture by a Woodland species depends on cover type and behav- ioral state: insights from resident and dispersing Iberian Lynx. J.
Appl. Ecol. 53:814–824.
Gastón, A., S. Blázquez-Cabrera, C. Ciudad, M.C. Mateo-Sánches, M.A. Simón and S. Saura. 2019. The role of forest canopy cover in hábitat selection: insights from the Iberian Lynx. Eur. J. Wildl.
Res. 65:30.
García, P. and E. Pérez. 2016. Mapping of soil sealing by vegetation indexes and built-up index: A case of study in Madrid (Spain).
Geoderma 268:100–107.
Garrote, G., R.P. de Ayala, P. Pereira, F. Robles, N .Guzmán, F.J.
García, et al. 2011. Estimation of the Iberian lynx (Lynx pardi- nus) populatios in the Doñana area, SW Spain, using capture- recapture analysis of camera-trapping data. Eur. J. Wildl. Res.
57:355–362.
Garrote, G. and R.P. de Ayala. 2015. Assessing unverified observa- tion data used for estimating Iberian lynx distribution. Eur. J.
Wildl. Res. 61 (5):801–806.
Garrote, G., J. Fernández–López, G. López, G. Ruiz and M.A.
Simón. 2018. Prediction of Iberian lynx road– mortality in south-2018. Prediction of Iberian lynx road– mortality in south- ern Spain: a new approach using the MaxEnt algorithm. Anim.
Biodivers. Conserv. 41(2):217–225.
Gil-Sánchez, J.M. and E.B. McCain. 2011. Former range and decline of the Iberian lynx (Lynx pardinus) reconstructed using verified records. J. Mamm. 92(5):1081–1090.
Gompper, M.E., R.W. Kays, J.C. Ray, S.D. Lapoint, D.A. Bogan and J.R. Cryan. 2006. A comparison of noninvasive techniques to survey carnivore communities in northeastern North America.
Wildl. Soc. Bull. 34(4):1142–1151.
Graells, M.P. 1897. Fauna Mastodológica Ibérica. Real Academia de Ciencias, Madrid.
Graham, M.H. 2003. Confronting multicollinearity in ecological multiple regression. Stat. Rep. 84(11):2809–2815.
Gugolz, D., M.V. Bernasconi, C. Breitenmoser-Würsten, and P.
Wandeler. 2008. Historical DNA reveals the phylogenetic posi- tion of the extinct Alpine lynx. J. Zool. 275:201–208.
Guisan, A. and W. Thuiller. 2005. Predicting species distribution: of- fering more than simple habitat models. Ecol. Lett. 8:993–1009.
Guzmán, J.N., G. Garrote, P. García, R.P. de Ayala and M.C.
Iglesias. 2002. Censo-diagnóstico de las poblaciones de lince Ibérico (Lynx pardinus) en España. 2000-2002. In: Abstract International 22 Seminar on the Iberian lynx. Madrid.
Guzmán, J.N., F.J. García, G. Garrote, R.P. de Ayala and M.C. Iglesias 2004. El lince ibérico (Lynx pardinus) en España y Portugal.
Censo-diagnóstico de sus poblaciones. DGCN, Ministerio de Medio Ambiente, Madrid.
Guzmán, J.N., F.J. García, G. Garrote, R.P. de Ayala and C. Iglesias 2005. El lince ibérico (Lynx pardinus) en España y Portugal.
Organismo Autónomo Parques Nacionales. Ministerio de Medio Ambiente, Madrid.
Hair, J.F., R.E. Anderson, R.L. Tatham and C. Black. 1998.
Multivariate Data Analysis. (5th ed.). Prentice Hall, New Jersey.
Hijmans, R.J., S.E. Cameron and J.L. Parra. 2006. WorldClim Global Climate Layers Version 1.4. [last use 15 July 2016]. Available in:
www.worldclim.org.
Hutchinson, G.E. 1957. Concluding remarks. Cold Spring Harb.
Symp. Quant. Biol. 22:415–427.
Iglesias, A. and A.J. España 2010. Rastros y huellas de carnívoros ibéricos. Ediciones Jaguar, Madrid.
James, F.C., R.F. Johnson, N.O. Wamer, G.J. Niemi and W.J.
Boecklen. 1984. The Grinellian niche of the Wood Thrush. Am.
Nat. 124:17–47.
Johnson, W.E., J.A. Godoy, F. Palomares, M. Delibes, M. Fernandes, E. Revilla and S.J. O´Brien. 2004. Phylogenetic and phylo- geographic analysis of Iberian Lynx populations. J. Hered. 95:
19–28.
Kohn, M.H. and R.K. Wayne. 1997. Facts from feces revisited.
Trends Ecol. Evol. 12 (6):223–227.
Le, S., J. Josse and F. Husson. 2008. FactoMineR: An R Package for Multivariate Analysis. J. Stat. Soft. 25 (1):1–18.
LaRue, P., L. Bélanger and J. Huot. 1995. Riparian edge effects on boreal balsam fir bird communities. Can. J. For. Res. 25:555–
566.
Llaneza, L., V. Sazatornil and J.V. López-Bao. 2018. The importance of fine-scale breeding site selection patterns under a landscape- sharing approach for Wolf conservation. Biodivers. Conserv. 27:
1239–1256.
Long, R.A., P. MacKay, J. Ray and W. Zielinski (eds.). 2012.
Noninvasive Survey Methods for Carnivores. Island Press, Washington.
Mallinson, J. 1978. Lynxes. European lynx (Lynx lynx) and pardel lynx (Lynx pardina). In: Mallinson, J. (ed.), The Shadow of Extinction: Europe’s Threatened Wild Mammals. MacMillan, London. pp. 141–148.
Martín, J., R. Grande, A. Hernando and J. Eliseo (eds.). 2007.
Prospección del Lince Ibérico en los montes del centro de España. Fundación Abertis, Cantabria.
Mateo, R.G., A.M. Felicísimo and J. Muñoz. 2011. Species distri-2011. Species distri- butions models: A synthetic revision. Rev. Chil. Hist. Nat. 84:
217–240.
MDA Federal. 2004. Landsat GeoCover ETM+ 2000 Edition Mosaics Tile N-03-05.ETM-EarthSat-MrSID, 1.0. USGS, Sioux Falls, South Dakota, 2000. [last use 13 July 2015]. Available in:
www.landcover.org.
Ministry of Environment and Ordination of the Territory. 2017.
Regional Catalogue of Endangered Species of Wild Flora and Fauna, and Unique Trees of Madrid Province. Comunidad de Madrid. [14 Aug 2017]. Available in: http//www.madrid.org.
Molinari-Jobin, A., M. Kéry, E. Marboutin, P. Molinari, I. Koren, C.
Fuxjäger, et al. 2012. Monitoring in the presence of species mis- identification: the case of the Eurasian lynx in the Alps. Anim.
Conserv. 15(3):266–273.
Morris, D.W. 1987. Ecological scale and habitat use. Ecology 68(2):
362–369.
Morrison, M.L., B. Marcot and W. Mannan. 2012. Wildlife-habitat Relationships: Concepts and Applications. Island Press, Washington.
Northrup, J.M., M.B. Hooten, C.R. Anderson and G. Wittemyer.
2013. Selection functions under a use – availability design.
Ecology 94(7):1456–1463.
Nowell, K. and P. Jackson. 1996. Wild Cats: Status Survey and Conservation Action Plan. IUCN/SSC Cat Specialist Group, Gland, Switzerland.
Palomares, F. 2001. Vegetation structure and prey abundance require- ments of the Iberian lynx: implications for the design of reserves and corridors. J. Appl. Ecol. 38:9–18.
Palomares, F., J.A. Godoy, A. Píriz and S.J. O’Brien. 2002. Faecal genetic analysis to determine the presence and distribution of elusive carnivores: design and feasibility for the Iberian lynx.
Mol. Ecol. 11(10):2171–2182.
Palomo, L.J., J. Gisbert and J.C. Blanco. 2007. Atlas y Libro Rojo de los Mamíferos Terrestres de España. Madrid Dirección General para la Biodiversidad-SECEM-SECEMU.
Phillips, S.J., R.P. Anderson and R.E. Schapire. 2006. Maximum en- tropy modeling of species geographic distributions. Ecol. Model.
190:231–259.
Phillips, S.J. and M. Dudík. 2008. Modeling of species distributions with Maxent: new extensions and comprehensive evaluation.
Ecography 31:161–175.
Phillips, S.J., M. Dudík, R.E. Schapire. 2019. Maxent software for modeling species niches and distributions (Version 3.4.1).
Available from url: http://biodiversityinformatics.amnh.org/
open_source/maxent/. Accessed on 2019-1-24.
QGIS Development Team (2017). QGIS Geographic Information System. Open Source Geospatial Foundation Project. Available in: http://qgis.osgeo.org.
Radosavljevic, A., R.P. Anderson. 2014. Making better MAXENT models of species distributions: complexity, overfitting and eval- uation. J. Biogeogr. 41:629–643.
R Core Team (2017). R: A language and environment for statistical computing. R Foundation for Statistical Computing, Vienna, Austria. Available in: http://www.R-project.org/.
Rettie, W.J. and F. Messier. 2000. Hierarchical habitat selection by woodland caribou: its relationship to limiting factors. Ecography 23:466–478.
Rodríguez, A. and J. Calzada. 2015. Lynx pardinus. The IUCN Red List of Threatened Species 2015: e.T12520A50655794. http://dx.doi.
org/10.2305/IUCN.UK.2015-2.RLTS.T12520A50655794.
en. Downloaded on 21 January 2019.
Rodríguez, A. and M. Delibes. 1990. El lince ibérico (Lynx par- dina) en España: distribución y problemas de conservación.
Colección Técnica, ICONA (former Spanish Institute for Nature Conservation), Madrid, Spain.
Rodríguez, A. and M. Delibes. 1992. Current range and status of the Iberian lynx Felis pardina Temminck, 1824 in Spain. Biol.
Conserv. 61(3):189–196.
Rodríguez, J.L. 2003 Guía de Campo de los Mamíferos Terrestres de España. Ediciones Omega, S.A. Barcelona.
Rodríguez, R., O. Ramírez, C.E. Valdiosera, N. García, F. Alda, J.
Madurell-Malapeira, et al. 2011. 50,000 years of genetic uni-50,000 years of genetic uni- formity in the critically endangered Iberian lynx. Mol. Ecol. 20:
3785–3795.
Rodríguez-Varela, R., A. Tagliacozzo, I. Ureña, N. García, E. Crégut- Bonnoure, M.A. Mannino, J.L. Arsuaga and C. Valdiosera. 2015.
Ancient DNA evidence of Iberian lynx palaeoendemism. Quat.
Sci. Rev. 112:172–180.
Rodgers, T.W. and J.E. Janečka. 2013. Applications and techniques for non-invasive faecal genetics research in felid conservation.
Eur. J. Wildl. Res. 59(1):1–16.
San Miguel, A. (Coord). 2006. 1ª reimp. Manual para la gestión del hábitat el lince ibérico (Lynx pardinus Temminck) y de su presa principal, el conejo de monte (Oryctolagus cuniculus L.).
Fundación CBD-Habitat, Madrid.
Schmitz, M.F., I. de Aranzabal and F.D. Pineda. 2007. Spatial anal-2007. Spatial anal- ysis of visitor preferences in the outdoor recreational niche of
Mediterranean cultural landscapes. Environ. Conserv. 34(4):
300–312.
Sexton, J.O., X.P. Song, M. Feng, P. Noojipady, A. Anand, C. Huang, et al. 2013. Global, 30-m resolution continuous fields of tree cov- er: Landsat-based rescaling of MODIS Vegetation Continuous Fields with lidar-based estimates of error. [last use 15 July 2015].
Available in: www.landcover.org.
Simón, M.A. 2017. Censo de las poblaciones de lince ibérico, año 2017. Life + Iberlince website. Available in: www.iberlince.eu.
Simón, M.A., J. Gil-Sánchez, G. Ruiz, G. Garrote, E. Mccain, L.
Fernández, et al. 2011. Reverse of the decline of the endangered Iberian Lynx. Conserv. Biol. 26(4):731–736.
Tobler, M.W., S.E. Carrillo-Percastegui, R. Leite-Pitman, R. Mares and G. Powell, 2008. An evaluation of camera traps for inven- torying large- and medium-sized terrestrial rainforest mammals.
Anim. Conserv. 11:169–178.
Torre, I., A. Arrizabalaga and F. Flaquer. 2003. Estudio de la dis- tribución y abundancia de carnívoros en el parque natural del Montnegre I el corredor mediante fototrampeo fotográfico.
Galemys 15 (1):15–28.
Torres, J., R. García-Perea, J. Gisbert and C. Feliu. 1998. Helminth fauna of the Iberian Lynx, Lynx pardinus. J. Helminthol. 72:
221–226.
Valverde, J.A. 1963. Información sobre el lince ibérico en España.
Boletín técnico, serie cinegética. Ministerio de Agricultura, Dirección General de Montes, Caza y Pesca Fluvial, Servicio Nacional de Pesca Fluvial y Caza.
Virgós, E. 2001. Relative value of riparian woodlands in landscapes with different forest cover for medium-sized Iberian carnivores.
Biodivers. Conserv. 10:1039 – 1049.
Virgós, E. 1994. Consideraciones sobre la situación del tejón (Meles meles) en algunas áreas del centro de la Península Ibérica.
Aegypius 12:37 – 40.
Virgós, E. and J.G. Casanovas. 1993. Distribución, ecología y con- servación de los carnívoros en el Parque Regional de la Cuenca Alta del Manzanares. AEDENAT-CODA, Madrid.
Virgós, E. and A. Travaini. 2005. Relationship betweennsmall-game hunting and carnivore diversity in central Spain. Biodivers.
Conserv. 14(14):3475–3486.
Warton, D.I. and L.C. Shepherd. 2010. Poisson point process models solve the “pseudo-absence problem” for presence-only data in ecology. Ann. Appl. Stat. 4(3):1383–1402.
Zabía, M. and L. del Olmo. 2007. Atlas Medio Ambiente de la Comunidad de Madrid. Consejería de Medio Ambiente y Ordenación del Territorio. [14 Aug 2017]. Available in: http://
www.madrid.org.
Received February 4, 2019 Revised June 27, 2019 Accepted November 6, 2019 Appendix 1. Correlation matrix among 17 original variables initially considered. The file may be downloaded from www.
akademiai.com.