An International Journal for Engineering and Information Sciences DOI: 10.1556/606.2019.14.3.21 Vol. 14, No. 3, pp. 223–234 (2019) www.akademiai.com
IMPLEMENTING QUANTITATIVE TECHNIQUES TO IMPROVE DECISION MAKING IN
CONSTRUCTION PROJECTS: A CASE STUDY
1 Osama ABUSALEM, 2 Nikolett BERTALAN, 3 Balázs KOCSI*
1,2,3
Department of Engineering Management and Enterprise, Faculty of Engineering University of Debrecen, Ótemető u. 2-4, H-4028 Debrecen, Hungary
e-mail: 1o.abusalem@hotmail.com, 2nikibertalan@gmail.com, 3kocsi.balazs@inf.unideb.hu Received 20 December 2018; accepted 1 April 2019
Abstract: This research aims to evaluate the effectiveness of implementing quantitative techniques to improve decision making in construction projects by using time- and cost-oriented failure mode and effect analysis and Monte Carlo simulation. This research is limited to the project schedule and risk management of one phase of a construction project to build a new automated warehouse in Hungary. The results show that there are 80% and 100% chances that the duration and cost of the construction project phase will increase due to the uncertainty and individual risks associated with the construction project activities respectively.
Keywords: Scientific management, Quantitative techniques, Risk analysis, time- and cost- oriented failure mode and effect analysis, Monte Carlo simulation
1. Introduction
The construction industry is a complex and dynamic environment and heavily associated with uncertainties and risks [1], [2]. In this hostile environment, managers must take crucial decisions to carry out the fundamental managerial functions of planning, organizing, directing, and controlling to achieve the predetermined project objectives efficiently and effectively. Unfortunately, the traditional management has purely considered the decision making as art or talent that is obtained over a period through experience. Managers used to solely rely on trial and error, a rule of thumb, common sense, intuition, or snap judgment to make decisions. These methods are misleading and may have severe implications. One single wrong decision may not only
* Corresponding Author
be destructive but may also have ramifications in the national economy. Therefore, the art of decision making must be supplemented by a scientific approach to increase the probability of coming up with good decisions. In this approach, decision making must be based on a comprehensive analysis of data that reveals relationships, indicates trends, and shows rates of change in the relevant variables. The scientific management has evolved since the early 19th century to provide many quantitative techniques capable of solving complex managerial problems [3]-[6]. Despite the tremendous development of scientific management and the widespread applications of several quantitative techniques in decision making, the deterministic approach still dominating the decision making in numerous construction companies rather than the stochastic approach. This may result in severe ramifications in achieving the planned project objectives of time, cost, and quality and it may go beyond that to the bankruptcy. This research seeks to fill a gap in the body of knowledge pertaining to replacing the deterministic conception of decision making in the construction industry by the stochastic conception through evaluating the effectiveness of implementing quantitative techniques to improve decision making in construction projects by using time- and cost-oriented Failure Mode and Effect Analysis (tcFMEA) and Monte Carlo Simulation (MCS). This aim can be achieved through the following objectives:
• To identify risks within a construction project phase by using tcFMEA;
• To model the construction project phase and its associated risks by using computer software;
• To simulate the construction project phase and its associated risks by using MCS;
• To compare the stochastic model with the deterministic model.
2. Literature review
Project schedule management involves the processes needed to manage the timely completion of projects. It seeks to produce a detailed plan that represents how and when a project will deliver the products, services, and results specified in the project scope and serves as a mean for communication, managing stakeholders’ expectations, and as a base for performance reporting [7]-[10].
Project risk management involves the processes of implementing risk management planning, identification, analysis, response planning, response implementation, and risk monitoring on a project. It seeks to raise the probability and impact of favorable risks and to reduce the probability and impact of adverse risks to optimize the chances of project success [7]-[10].
The tremendous development in mathematics, statistics, and computer resulted in developing a new concept known as scientific management. This new concept of management formed a basis towards the study of managerial problems by developing quantitative techniques used by managers in making decisions scientifically. The quantitative technique is defined as a scientific approach to managerial decision making.
The quantitative techniques are those mathematical, statistical, and programming techniques, which help decision makers solving managerial problems by collecting, analyzing, interpreting, and presenting the available data meaningfully [3]-[6].
The FMEA seeks to identify the failures, effects, and risks within a process or product, and then eliminate or reduce them. The corresponding risk of a failure and its influences are determined by three factors, including occurrence, severity, and detection. All possible failure modes and effects are ordered in each of these three factors on a scale varying from 1 to 10, low to high, based on the accessible data and knowledge of the process or product. The Risk Priority Number (RPN) is determined for each potential failure mode and effect by multiplying the ranking for the three factors (occurrence × severity × detection). The FMEA worksheet is used to document the FMEA process to identify and prioritize risks and then eliminate or reduce them [11]-[13].
The MCS is a computer-based process of analysis that uses statistical sampling methods to acquire a probabilistic approach to the solution of a mathematical equation or model. Scientists employ mathematical models in natural sciences, social sciences, and engineering disciplines to describe the interactions in a system using mathematical expressions. These models typically rely on several input parameters, which when processed through the mathematical formulas in the model, ends in one or more outputs.
The input parameters for the models rely on several external factors. Consequently, the realistic models are subjected to risk from the systematic variation of the input parameters. A deterministic model, which does not examine these variations, is usually described as a base case because the values of these input parameters are the most likely values. A practical model should take into consideration the risks associated with various input parameters. The MCS can help an experimenter to methodically investigate the complete range of risk associated with each risky input variable. In MCS, experimenters identify a statistical distribution which they can use as the source for each of the input parameters. Then, they draw random samples from each distribution, which then represent the values of the input variables. For each set of input parameters, they receive a set of output parameters. The magnitude of each output parameter is one specific outcome scenario in the simulation run. They collect output values from many simulation-runs. Finally, they conduct statistical analysis on the values of the output parameters to make decisions. They can use the sampling statistics of the output parameters to characterize the output variation. The MCS process has four main steps, including static model generation, input distribution identification, random variable generation, and analysis and decision making [14]-[19].
3. Project
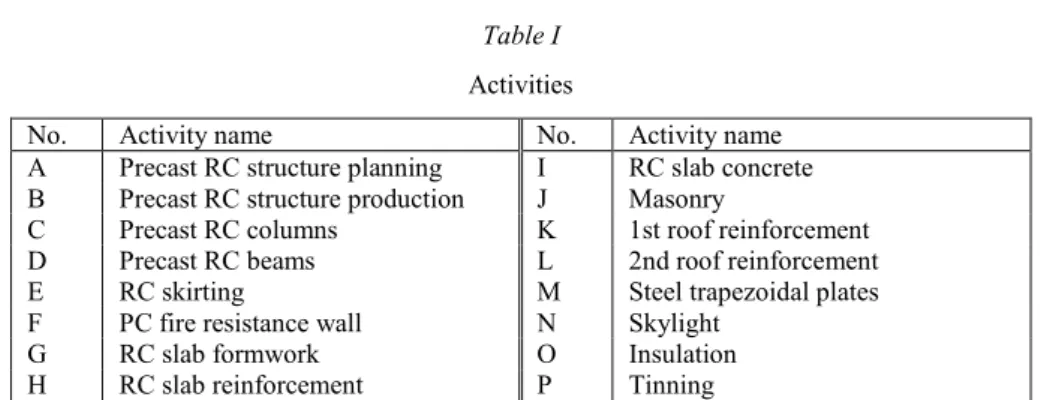
The project is a construction project to build a new automated warehouse in Hungary. It started in 02.02.2017 and will finish in 01.04.2019. It consists of more than 150 main activities, including architectural, civil, mechanical, and electrical works. The scope of this research is limited to the project schedule and risk management of one construction project phase that consists of 16 activities (see Table I). The values of the activities and the potential failures were calculated based on the experiences of previous projects.
Table I Activities
No. Activity name No. Activity name
A Precast RC structure planning I RC slab concrete B Precast RC structure production J Masonry
C Precast RC columns K 1st roof reinforcement
D Precast RC beams L 2nd roof reinforcement
E RC skirting M Steel trapezoidal plates
F PC fire resistance wall N Skylight
G RC slab formwork O Insulation
H RC slab reinforcement P Tinning
4. Time- and cost-oriented failure mode and effect analysis
The FMEA is widely used in various industrial areas, including the planning, operation, and maintenance phases of production [20]. Additionally, it is widely used in the field of environmental risk assessment [21]. However, the traditional version of the FMEA has some limitations. First, the detection concept is confusing and has several interpretations. Second, the ordinal values conserve order in a set of objects, but the range between the values cannot be measured since a length function does not exist.
Hence, the product or sum of ordinal variables wastes its rank since every parameter has diverse scale. The RPN indicates that some failure types are worse than others but it does not give a quantitative indication of their relative effects. Third, the traditional FMEA does not take into consideration the uncertainty in the structure of a process (dependency between activities) and the uncertainty in the activities themselves. To overcome these weaknesses, the probability of failures occurrence and time and cost increased due to failures occurrence were taken as a basis for the FMEA during MCS.
The tcFMEA was developed to identify the failures, effects, and risks within the construction project phase [22]. Time and cost are universal parameters, and all other parameters can be easily expressed in their terms. Table II presents the activities and their associated failures with the probabilities, relative delays, fixed cost increases, and Expected Monetary Values (EMV). The fixed cost increase includes failure and correction costs. The EMV is a statistical technique in project risk management used to quantify risks by calculating the average outcomes when the future includes scenarios that may or may not happen [7]. Failure H1 has the largest relative delay of 80%, while failures A1, C2, D2, G1, K2, and L2 have the smallest relative delay of 0%. Failure E1 has the highest cost of $5935, while failures K2 and L2 have the lowest cost of $173.
Failure E1 has the highest EMV of $1780.5, while failure P1 has the lowest EMV of
$50.1. The Pareto analysis, a statistical technique in decision making used to identify the 20% of causes that determine the 80% of results can be used to determine the top activities that significantly contribute to the duration and fixed cost increase of the entire construction project phase [23]. Nevertheless, the Pareto analysis, as the tcFMEA, does not take into consideration the uncertainty in the structure of a process (dependency between activities) and the uncertainty in activities themselves.
Consequently, the contribution of activities to the duration and fixed cost increase of the
entire construction project phase can be accurately measured by conducting a sensitivity analysis that calculates the correlation coefficients between these variables during MCS.
Table II Failure mode and effect
No. Failure name Probability
(%)
Relative delay (%)
Fixed cost increase ($)
EMV ($)
A1 Lack of skilled workers 20 0 826 165.2
A2 Inappropriate regulations 80 45 806 644.8
B1 Unavailability of materials 20 50 2348 469.6
C1 Lack of infrastructure 40 20 851 340.4
C2 Equipment breakdown 30 0 980 294
D1 Lack of infrastructure 40 20 851 340.4
D2 Equipment breakdown 30 0 980 294
E1 Unavailability of materials 30 40 5935 1780.5
F1 Lack of skilled workers 10 30 930 93
G1 Lack of infrastructure 30 0 851 255.3
H1 Physical or chemical failure of materials
25 80 1755 438.75
I1 Unavailability of materials 10 15 930 93
J1 Unavailability of materials 30 25 2736 820.8
K1 Physical or chemical failure of materials
15 45 2186 327.9
K2 Unavailability of materials 5 0 173 8.65
L1 Physical or chemical failure of materials
15 45 2186 327.9
L2 Unavailability of materials 5 0 173 8.65
O1 Equipment breakdown 60 30 893 535.8
P1 Unavailability of materials 15 10 334 50.1
5. Monte Carlo simulation
The MCS was used to simulate the consolidated effects of individual project risks and other sources of uncertainty to assess their possible influence on achieving project objectives. The MCS process has the following main steps:
5.1. Static model generation
The MCS started with developing a deterministic model that reflects the understanding that stakeholders in the construction company have about how the work is done [14]-[19]. There are many languages that can be used to diagrammatically model processes [24], [25]. However, the common modeling languages used in the
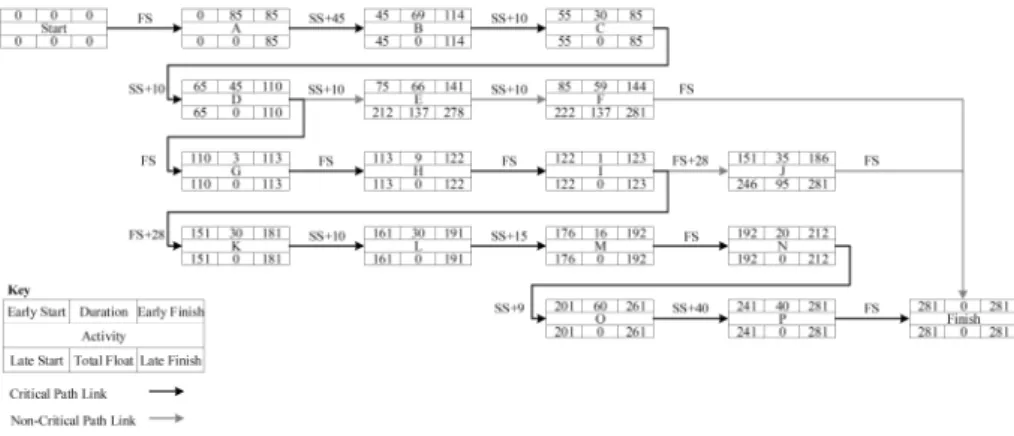
construction industry is the schedule network diagram and Gantt chart as they are the only languages that can graphically represent the logical relationships (dependency) among the construction project schedule activities. The Gantt chart is a bar chart of schedule information where activities are placed on the vertical axis, dates are presented on the horizontal axis, and activity durations are manifested as horizontal bars located based on start and finish dates [7]. The schedule network diagram and Gantt chart were developed by using two software programs, including Microsoft Visio and Project 2016, to plan, adjust, and organize the order of the activities; add the logical relationships, lag and lead values; and distinguish the diverse natures of dependencies (see Fig. 1 and Fig. 2). The base (most likely) value of duration was used in developing the deterministic model (see Table III). The duration of activities A and J were rounded to the nearest lowest number. It can be noticed that activity A has the largest durations (76, 85.5, and 95 days), while activity I has the lowest durations (1 day). Although activity A has the largest durations, activity O has the largest range (max-min) of 34 days. Every activity has uncertainty in its estimated duration except activities G and I. This means that the range of estimated durations for all activities is larger than zero, while activities G and I have deterministic durations since their range equals zero. The Critical Path Method (CPM) was used to identify the activities that lay on the critical path that estimate the minimum construction project phase duration and determine the amount of schedule flexibility on the logical network paths within the schedule model. This was done by calculating the early start, early finish, late start, and late finish dates for every activity without concern for any resource restrictions by implementing a forward and backward path analysis through the schedule network. The critical path is the assemblage of activities that depicts the longest path through a project, which defines the shortest potential project duration. The longest path has the least total float, usually zero [7]. The critical activities that lay on the critical path are A, B, C, D, G, H, I, K, L, M, N, O, and P. Activities E, F, and J are non-critical and have a total float of 137, 137, and 95 days respectively. These are the amount of time that activities E, F, and J can be delayed or extended from their early start date without delaying the phase finish date or violating a schedule constraint. Accordingly, the construction project phase starts on Monday 13-03-2017 and finishes on Monday 09-04-2018 with duration of 281 days.
Fig. 1. Schedule network diagram
Fig. 2. Gantt chart Table III
Duration and dependency of activities
No. Min (day) Most likely (day) Max (day) Predecessor Type Lag (day)
A 76 85.5 95 - - -
B 62 69 76 A SS +45
C 27 30 33 B SS +10
D 39 45 51 C SS +10
E 59 66 73 D SS +10
F 49 59 69 E SS +10
G 3 3 3 D FS 0
H 6 9 12 G FS 0
I 1 1 1 H FS 0
J 27 35.5 44 I FS +28
K 28 30 32 I FS +28
L 25 30 35 K SS +10
M 14 16 18 L SS +15
N 14 20 26 M FS 0
O 43 60 77 N SS +9
P 37 40 43 O SS +40
5.2. Input distribution identification
The accuracy of a risk analysis profoundly depends on the suitable use of probability distributions to exactly express the uncertainty, randomness, and variability of the issue.
The most appropriate distributions that can represent the time and cost of construction project activities are the Triangle, Beta, Program Evaluation and Review Technique (PERT), Four Parameters Beta (Beta4) distributions. The Triangle distribution usually overemphasizes the tails of the distribution and underemphasizes the shoulders compared with other, more natural, distributions. The Beta distribution is a continuous probability distribution defined on the interval [0, 1] and parameterized by two positive shape parameters, typically denoted by α and β, that appear as exponents of the random variable and govern the shape of the distribution. The PERT (Beta-PERT) distribution is a continuous probability distribution based on the Beta distribution. It requires the same three parameters as the Triangle distribution with an additional assumption that its expected value (mean) is the weighted average of the minimum, most likely, and
maximum values that the variable may take with four times the weight applied to the most likely value [14]. A study investigated several PERT networks and concluded that the most likely activity-time estimate (mode) is realistically useless. The place of the mode in most project tasks was approximately one-third of the distance from the minimum to the maximum value [26]. Taking the Beta4 (α, β, a, b) distribution, this equates to α = 2 and β = 3. Thus, it is sufficient to use the Beta4 (2, 3, min, max) instead of PERT (min, mode, max) with the extra benefit that one is simply asking a subject matter expert for two values only [14]. Based on the collected data, the duration of each activity has only minimum and maximum values. Therefore, the Beta4 distribution will be used to represent the duration of activities. The Beta4 (2, 3, min, max) is positively skewed (the frequent scores are clustered at the lower end and the tail points towards the higher or more positive scores). This means that it is not symmetric and instead it gives more weight for the risk towards the minimum value. Consequently, the Beta4 (2, 2, min, max) will be used rather than the Beta4 (2, 3, min, max) which is symmetrical and gives equal weights for the risk towards both the minimum and maximum values. The most appropriate distribution that can represent the risks associated with construction project activities is a special case of the binomial distribution called Bernoulli distribution. It is a discrete probability distribution of a random variable that gives only two possible outcomes, success or failure and yes or no. Typically, the terms Probability Mass Function (PMF) and Cumulative Mass Function (CMF) are used to represent the discrete distributions instead of the terms Probability Density Function (PDF) and Cumulative Density Function (CDF) [14], [19].
5.3. Random variable generation
The process of generating random numbers begins after identifying the underlying distributions for the input parameters of the simulation model. The standard method used for generating random numbers from any PDF or PMF given its CDF or CMF is called the inverse transformation method. This method inverses the CDF or CMF and converts a random number between 0 and 1 from a uniform distribution to a random value for the input distribution [14], [19].
5.4. Analysis and decision making
The result of the MCS of a model is typically subjected to statistical analysis. For every set of random numbers or trials generated for every one of the random variables, the model formula is employed to reach a trial value for the output variable. When the trials are complete, the collected values are analyzed. Averaging trial output values end in an anticipated value of the output variable. Accumulating the output values into groups by size and exhibiting the values as a frequency histogram gives the approximate shape of the PDF of the output variable. The output values can themselves be employed as an empirical distribution, thereby computing the percentiles and other statistics.
Otherwise, the output values can be fitted to a probability distribution, and the general statistics of the distribution can be calculated. These statistics can then be used for generating confidence intervals. The precision of the expected value of the variable and the distribution shape approximations improve as the number of simulation trials raises
[14], [19]. The number of samples, iterations, or trials used in MCS is 50000. The following are the final results obtained from conducting statistical analysis on MCS.
These results include the PDF, CDF, and table of duration, finish time, and fixed cost increase of the construction project phase. Moreover, they involve a sensitivity analysis represented through a tornado diagram to determine which activity has the most potential impact on project outcomes regarding time and cost. This can be achieved by measuring the correlation coefficients between the inputs and outputs of the construction project phase.
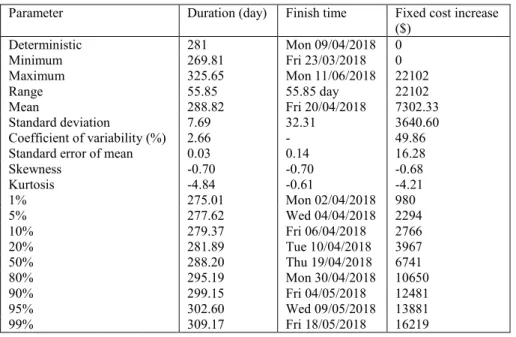
Table IV, Fig. 3, and Fig. 4 show that the minimum finish time of the construction project phase is Friday 23/03/2018 with duration of 270 days, while the maximum finish time is Monday 11/06/2018 with duration of 326 and a range of 56 days. The mean finish time is Friday 20/04/2018 with duration of 289 days and a standard deviation of 32 days. Fig. 5 shows that the activity that has the highest impact on the construction project phase duration is activity D with a high correlation coefficient of 0.695. The probability of finishing the construction project phase based on the deterministic finish time of Monday 09/04/2018 with a duration of 281 days that has been calculated by the construction company is 20%. This implies that there is an 80%
chance that the construction project phase will not finish on time. Table IV and Fig. 6 reveal that the minimum fixed cost increase due to the risks associated with the activities of construction project phase is $0, while the maximum fixed cost increase is
$22102 with a range of $22102. The mean fixed cost increase is $7302 with a standard deviation of $3641.
Table IV
Statistics of duration, finish time, and fixed cost increase
Parameter Duration (day) Finish time Fixed cost increase ($)
Deterministic 281 Mon 09/04/2018 0
Minimum 269.81 Fri 23/03/2018 0
Maximum 325.65 Mon 11/06/2018 22102
Range 55.85 55.85 day 22102
Mean 288.82 Fri 20/04/2018 7302.33
Standard deviation 7.69 32.31 3640.60
Coefficient of variability (%) 2.66 - 49.86
Standard error of mean 0.03 0.14 16.28
Skewness -0.70 -0.70 -0.68
Kurtosis -4.84 -0.61 -4.21
1% 275.01 Mon 02/04/2018 980
5% 277.62 Wed 04/04/2018 2294
10% 279.37 Fri 06/04/2018 2766
20% 281.89 Tue 10/04/2018 3967
50% 288.20 Thu 19/04/2018 6741
80% 295.19 Mon 30/04/2018 10650
90% 299.15 Fri 04/05/2018 12481
95% 302.60 Wed 09/05/2018 13881
99% 309.17 Fri 18/05/2018 16219
Fig. 3. PDF and CDF of duration Fig. 4. PDF and CDF of finish time
Fig. 5. Sensitivity analysis of duration Fig. 6. PDF and CDF of fixed cost increase
The probability of finishing the construction project phase based on the deterministic fixed cost increase of $0 that has been calculated by the construction company is 0%. This implies that there is 100% chance that the cost of the construction project phase will increase. Fig. 7 reveals that the activity that has the highest impact on the construction project phase fixed cost increase is activity E with a high correlation coefficient of 0.732. If the acceptable amount of risk to be taken is 10%, then there is 90% chance that the construction project phase will finish on Friday 04/05/2018 with duration of 299 days and a fixed cost increase of $12481. This action can be addressed during the plan risk response.
Fig. 7. Sensitivity analysis of fixed cost increase
6. Conclusion
The results of tcFMEA and MCS show that the probability of finishing the construction project phase based on the deterministic finish time of Monday 09/04/2018 with a duration of 281 days is 20%. Further, the probability of finishing the construction project phase based on the deterministic fixed cost increase of $0 is 0%. This implies that there are 80% and 100% chances that the duration and cost of the construction project phase will increase due to the uncertainty and individual risks associated with the construction project activities respectively. The worst-case scenario indicates a delay of two months with a fixed cost increase of $22,000. The sensitivity analysis reveals that a great concern should be directed towards activities D and E since they have the largest impact on the construction project phase duration and fixed cost increase with correlation coefficients of 0.695 and 0.732 respectively. Accordingly, the deterministic approach is ineffective in delivering the construction projects because it represents systems that do not contain any probabilistic (random) components, where all mathematical and logical relationships between elements (variables) are fixed in advance and not subjected to uncertainty. Consequently, it should be replaced by the stochastic approach that takes into consideration the potential impact of project risks and other sources of uncertainty on achieving project objectives. A plan risk response should be established for developing options, selecting strategies, and agreeing on actions to address overall project risk exposure as well as to treat individual project risks. The construction project management team may consider one or more of five alternative strategies for dealing with risks, including escalate, avoid, transfer, mitigate, and accept. Decision making techniques that can be used to select a risk response strategy include but are not limited to multi-criteria decision analysis. Multi-criteria decision analysis uses a decision matrix to provide a systematic approach for establishing key decision criteria, evaluating and ranking alternatives, and selecting a preferred option. Finally, the construction project management team should monitor the implementation of agreed-upon risk response plans, track identified risks, identify and analyze new risks, and evaluate risk process effectiveness throughout the project.
Open Access statement
This is an open-access article distributed under the terms of the Creative Commons Attribution 4.0 International License (https://creativecommons.org/licenses/by/4.0/), which permits unrestricted use, distribution, and reproduction in any medium, provided the original author and source are credited, a link to the CC License is provided, and changes - if any - are indicated. (SID_1)
References
[1] Smith N. J., Merna T., Jobling P. Managing risk in construction projects, Chichester, Wiley, 2014.
[2] Cretu O., Stewart R. B., Berends T. Risk management for design and construction, Hoboken, Wiley, 2011.
[3] Jaisankar S. Quantitative techniques for management: Computer based problem solving, New Delhi, Excel Books, 2005.
[4] Dubey U., Kothari D. P., Awari G. K. Quantitative techniques in business, management and finance: A case-study approach, Boca Raton, Taylor and Francis Group, 2016.
[5] Sharma J. K. Quantitative techniques in management, New Delhi, Laxmi Publications, 2017.
[6] Vohra N. D. Quantitative techniques in management, New Delhi, McGraw-Hill, 2017.
[7] A guide to the project management body of knowledge (PMBOK Guide), Project Management Institute, Newtown Square, Pennsylvania, USA, 2017.
[8] Schwalbe K. An introduction to project management, North Charleston, CreateSpace, 2017.
[9] Horine G. Project management: Absolute beginner’s guide, Indianapolis, Pearson, 2017.
[10] Kerzner H. Project management, A systems approach to planning, scheduling, and controlling, Hoboken, Wiley, 2017.
[11] McDermott R. E., Mikulak R. J., Beauregard M. R. The basics of FMEA, New York, Taylor and Francis Group, 2009.
[12] Carlson C. Effective FMEAs: Achieving safe, reliable, and economical products and processes using failure mode and effects analysis, Hoboken, Wiley, 2012.
[13] Stamatis D. Failure mode and effect analysis: FMEA from theory to execution, Milwaukee, American Society for Quality, 2003.
[14] Vose D. Risk anaysis - A quantitative guide, Chichester, Wiley, 2008.
[15] Firestone M. Guiding principles for monte carlo analysis, Washington, 1997.
[16] Law A. M., Kelton W. D. Simulation modeling and analysis, New York, McGraw-Hill, 2000.
[17] Rubinstein R. Y., Kroese D. P. Simulation and the Monte Carlo method, Hoboken, Wiley, 2008.
[18] Kalos M. H., Whitlock P. A. Monte Carlo methods, Weinheim, Wiley, 2008.
[19] Raychaudhuri S. Introduction to Monte Carlo simulation, in: Mason S. J., Hill R. R., Mönch L., Rose O., Jefferson T., Fowler J.W. (Eds) Proceedings of the 2008 Winter Simulation Conference, Global Gateway to Discovery, Miami, Florida, USA, 7-10 December 2008, pp. 91–100.
[20] Ekpiwhre E. O., Tee K. F. Reliability based maintenance methodology for sustainable transport asset management, Pollack Periodica, Vol. 13, No. 1, 2018, pp. 99−112.
[21] Singovszka E., Balintova M. Methods of environmental risk assessment in water management, Pollack Periodica, Vol. 4, No. 1, 2009, pp. 105−113.
[22] Kocsi B., Pusztai L., Budai I., Szűcs E. How to build our houses in order to consume the minimum energy, Proceedings of 12th Conference on Advanced Building Skins, Bern, Switzerland, 2-3 October 2017, pp. 399‒405.
[23] Montgomery D. C. Statistical quality control, Hoboken, Wiley, 2012.
[24] Dumas M., La Rosa M., Mendling J., Reijers H. A. Fundamentals of business process management, Heidelberg, Springer, 2013.
[25] Weske M. Business process management: Concepts, languages, architectures, Heidelberg, Springer, 2012.
[26] Golenko-Ginzburg D. On the distribution of activity time in PERT, The Journal of the Operational Research Society, vol. 39, No. 8, 1988, pp. 767–71.