ContentslistsavailableatScienceDirect
Journal of Chromatography A
journalhomepage:www.elsevier.com/locate/chroma
Enantioseparation of ß 2 -amino acids by liquid chromatography using core-shell chiral stationary phases based on teicoplanin and
teicoplanin aglycone
Dániel Tanács
a, Róbert Berkecz
a, Aleksandra Misicka
b, Dagmara Tymecka
b, Ferenc Fülöp
c, Daniel W. Armstrong
d, István Ilisz
a,∗, Antal Péter
aaInstitute of Pharmaceutical Analysis, Interdisciplinary Excellence Centre, University of Szeged, Somogyi B. u. 4, H-6720 Szeged, Hungary
bDepartment of Chemistry, University of Warsaw, Pasteura str. 1, 02-093 Warsaw, Poland
cInstitute of Pharmaceutical Chemistry, University of Szeged, Eötvös utca 6, H-6720 Szeged, Hungary
dDepartment of Chemistry and Biochemistry, University of Texas at Arlington, Arlington, TX 76019-0065, USA
a rt i c l e i nf o
Article history:
Received 30 April 2021 Revised 18 June 2021 Accepted 28 June 2021 Available online 5 July 2021 Keywords:
ß2-amino acids liquid chromatography
macrocyclic glycopeptide-based chiral stationary phases
kinetic and thermodynamic characterization, core-shell particles
a b s t r a c t
Enantioseparation of nineteenß2-amino acids has been performed byliquid chromatographyon chi- ral stationary phases based on native teicoplanin and teicoplaninaglycone covalently bonded to 2.7 μm superficiallyporous silica particles. Separations werecarried out inunbuffered (water/methanol), buffered[aqueoustriethylammoniumacetate(TEAA)/methanol]reversed-phase(RP)mode,andinpolar- ionic(TEAAcontainingacetonitrile/methanol)mobilephases.EffectsofpHintheRPmode,acidandsalt additives,aswellascounter-ionconcentrationsonchromatographic parametershavebeenstudied.The structureofselectands(ß2-aminoacidspossessingaliphaticoraromaticsidechains)andselectors(native teicoplaninorteicoplaninaglycone)wasfound tohave aconsiderableinfluenceonseparation perfor- mance.AnalysisofvanDeemterplotsanddeterminationofthermodynamicparameterswereperformed tofurtherexploredetailsoftheseparationperformance.
© 2021TheAuthor(s).PublishedbyElsevierB.V.
ThisisanopenaccessarticleundertheCCBYlicense(http://creativecommons.org/licenses/by/4.0/)
1. Introduction
Inthepastdecade,considerableinteresthasbeenpaidtopep- tides containing ß-amino acids (ß-peptides). With an additional carbon atom betweenthe amino andcarboxylic groups, theseß- amino acids can adopt various stable secondary structures with furtherfunctionalizationpossibilitiesenhancingthenumberofpo- tential applications[1].Unliketheir analogs,theseß-aminoacids arenotreadilysusceptibletohydrolysisorenzymaticdegradation.
Consequently, peptides with incorporated ß-amino acids exhibit enhanced stability [2]. Additionally, chimeric peptides (mixed
α
-andß-peptides)consistingof
α
-andß-aminoacidsareofconsid-erable interestaspeptidomimeticsinan increasingrangeofther- apeutic applications [3,4]. Depending on the position ofthe side chainonthe3-aminoalkanoicacidskeletonß2-andß3-aminoacids can be differentiated. The syntheses of ß2-amino acids in enan- tiomerically pure formaremuch morechallengingthan their ß3-
∗Corresponding author: István Ilisz, Institute of Pharmaceutical Analysis, Univer- sity of Szeged, Somogyi B. u. 4, H-6720 Szeged, Hungary
E-mail address: ilisz.istvan@szte.hu (I. Ilisz).
analogs[5].Thesynthesis ofß2-amino acidsinracemicformand their subsequent enantioseparation currently is the most practi- cal and effectiveapproach to obtain enantiopure ß2-amino acids.
Chromatographic datarelatedtothe separationandidentification of
β
3-amino acid enantiomers have been reported in the litera- ture[6-8].However,relativelylittleinformationisavailableonthe separation of ß2-amino acid enantiomers. The enantioseparation ofa fewß2-aminoacids haverecentlybeencarriedout by direct high-performanceliquid chromatography(HPLC)methods onchi- ral stationary phases(CSPs) based on (+)-(18-crown-6)-2,3,11,12- tetracarboxylic acid [9,10], macrocyclic glycopeptides [11,12], and Cinchonaalkaloids[13,14].Core-shell particles (superficially porous particles, SPPs) and sub-2 μm fully porous particles (FPPs) are expected to provide high-throughput and effective separations of a variety of chiral molecules in ultra-high-performanceliquid chromatography (UH- PLC). Teicoplanin, teicoplaninaglycone, vancomycin, or isopropyl- cyclofructancovalentlybondedtosub-2 μmor2.7μmSPPswere successfully applied for the enantioseparation of native and N- protected
α
-amino acids and small peptides under LC [15-18],andsupercriticalfluidchromatography(SFC)conditions[19,20].Te-
https://doi.org/10.1016/j.chroma.2021.462383
0021-9673/© 2021 The Author(s). Published by Elsevier B.V. This is an open access article under the CC BY license ( http://creativecommons.org/licenses/by/4.0/ )
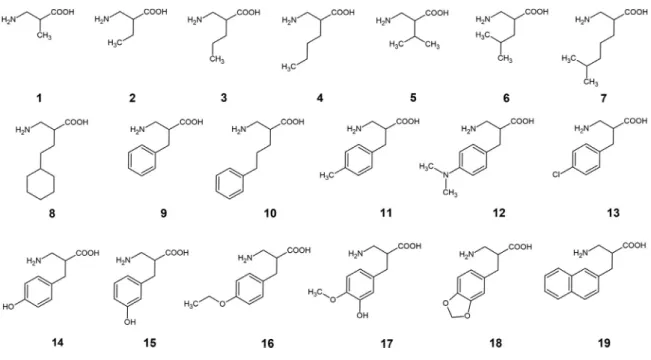
Figure 1. Structure of ß2-amino acids
icoplanin and teicoplaninaglycone covalently attachedto 1.9μm FPP silica gel with narrow size distribution exhibited excellent separation performances for native proteinogenic amino acids in both LC and SFCmodalities [21].The newsynthetic route devel- oped for bonding teicoplanin to sub-2 μm or 2.7 μm SPPs and to sub-2μm FPPsendowedtheselector withazwitterionicchar- acter [22,23]. Ion-exchange-type CSPs are also being developed for UHPLC purposes. For example, tert-butylcarbamoyl(8 S,9 R)- quinine wascovalently bondedto 1.9μm [22] or to 2.7μm [24- 30] SPPs, and to 3.0 μm and 1.7μm FPPs [28]. Lämmerhofer et al. [30] in chiral × chiral two-dimensional UHPLC applied tert- butylcarbamoyl(8 S,9R)-quinine andtert-butylcarbamoyl(8 R,9S)- quinidine selectors bondedto 2.7μm SPPs forthe separation of enantiomers of native proteinogenic
α
-amino acids after peptidehydrolysis. A survey of literature data revealedthat enantiosepa- rationsunderUHPLCconditionswereperformedforproteinogenic
α
-aminoacids withtheonlyexceptionsbeingthe enantiosepara- tionofγ
-aminobutyricacid[27]andß-Ala[28,34].The present studyprovides results for the utilization of CSPs based on macrocyclic glycopeptides covalently bondedto 2.7μm SPPs forthe enantioseparationof19unusual ß2-aminoacids.Ex- perimentswereperformedutilizingcolumnswith3.0and2.1mm internaldiameter(i.d.)basedonteicoplanin-andteicoplaninagly- cone. RP and polar-ionic mobile phases were applied in separa- tions. Effectsofthenatureandconcentrationofthemobilephase components,acidandsaltadditivesundervariousconditions,and pHinreversed-phase(RP)modewerestudied.Togaindetailedin- formationaboutthechiralrecognitionprocess,structure–retention (selectivity) relationships were evaluated by taking into account thestructuralfeaturesofboththeanalytesandselectors.Analysis of van Deemterplots served asa basis forthe kinetic investiga- tions,whilethetemperaturedependencestudyallowedthermody- namiccharacterization.Inafewcases,elutionsequencesalsowere determined.
2. Experimental
2.1. Chemicalsandmaterials
Nineteen racemic amino acids (1-19) were synthesizedasde- scribed earlier[13].(Forstructures seeFig.1). Enantiomers(R)-2,
(S)-5and(S)-6weregenerousgiftsfromProf.D.Tourwé (VrijeUni- versiteitBrussels,Brussels,Belgium).
Methanol (MeOH), acetonitrile (MeCN), and water of LC-MS grade, NH3 dissolved in MeOH, triethylamine (TEA), formic acid (FA), glacial acetic acid (AcOH), ammonium formate (HCO2NH4), andammoniumacetate(NH4OAc)ofanalyticalreagentgradewere from VWR International (Radnor, PA, USA). The pH reported for thereversed-phasemobilephase istheapparent pH(pHa),which was adjusted directly in the aqueous triethylammonium acetate (TEAA)/MeOHsolutionswiththeadditionofAcOH.
2.2. Apparatusandchromatography
LC measurements were carried out on a Waters® ACQUITY UPLC® H-Class PLUS System with Empower 3 software (Waters) and components asfollows: quaternary solvent manager, sample manager FTN-H, column manager, PDA detector, and QDa mass spectrometer detector.Theparameters forthe QDadetectorwere setasfollows:positiveionmode,probetemperature, 600°C,cap- illaryvoltage,1.5V,conevoltage,20V.
Chiral columns, based on teicoplanin (TeicoShell, T) and te- icoplaninaglycone (TagShell, TAG) attachedcovalentlyto thesur- face of 2.7 μm SPPs, were applied in this study. The core di- ameter and shell thickness of the SPPs were 1.7 μm and 0.5 μm,respectively.Allcolumns(AZYP,LLC,Arlington,TX,USA)have 100×3.0mmi.d.or100×2.1mmi.d.dimensions(abbreviations forcolumns:T-3.0andT-2.1;Tag-3.0andTag-2.1).
Stock solutions of analytes (1-10 mg ml–1) were prepared in MeOH anddiluted with themobile phase. The dead-time (t0) of thecolumnswasdeterminedby0.1%AcOHdissolvedinMeOHand detectedat210or256nm.Inallexperimentsaflowrateof0.3ml min–1providedefficiencyandfastanalysisforbothcolumndimen- sions,whilethecolumntemperaturewassetat20°C (ifnot oth- erwisestated).
3. Resultsanddiscussion
Basedon theirside chain,theinvestigatedß2-aminoacidscan be divided into two sub-groups: those that contain an aliphatic moiety or an aromatic moiety. The branch or the length of the aliphaticmoietyorthenatureandpositionofsubstituentsonthe
aromaticringinfluencesthesizeandpolarityofthemoleculeand isexpectedtohaveaconsiderableeffectonselector–analyteinter- actions.
3.1. EffectofpHonretentionandseparationperformance
ThepKvalueofcarboxylicgroupsofteicoplaninandteicoplanin aglycone (playing important role in the retention mechanism) is approximately2.5.ThepKvaluesoftheaminogroupsofß2-amino acids 1-19 are in the range 10.16–10.32. The corresponding val- ues for the carboxylic moieties of 1-12, 19 are between 4.10- 4.50, whereas for 13-18 they are between 3.20-3.60 (calculated with MarvinSketch v. 17.28 software,ChemAxon Ltd., Budapest).
Therefore, the charge of macrocyclic glycopeptide-based station- ary phasesandanalytesis sensitiveto pHandalterstheinterac- tions betweentheCSP andtheanalyte.Toreveal thepossibleef- fects of pHa on retention, selectivity, andresolution of ß2-amino acids bearing aliphatic (3) and aromatic side chain (9) were se- lected andtheirretentionbehavior wasinvestigatedon T-3.0and TAG-3.0 columns in the RP mode applying eluents consisting of aq.TEAA/MeOH (90/10 v/v and 30/70 v/v) with a constant TEAA concentration of20.0mM) andvarying pHa of themobile phase betweenpHa3.5−6.5. Underthestudiedconditions,theretention factorsofthefirstelutingenantiomer(k1)usuallychangedslightly withincreasingpHaforbothanalytes,andonlyanalyte9exhibited moderate increasesin the aq.TEAA/MeOH 30/70 (v/v) eluent (Fig.
S1). Interestingly,
α
and RS increased more significantly in both mobile phase systems, especially foranalyte 3, with the highest valuesobtainedabovepHa5.0(Fig.S1).Based ontheirpKvalues, teicoplanin, teicoplaninaglycone, andß2-aminoacids are present inionizedformunderthesemobile phaseconditions.Thatis,the observed behavior isprobablydue toincreasedionic interactions betweentheprotonatedaminogroupoftheanalyteandthedepro- tonatedcarboxylicgroupoftheselector.Theionicstructuresaffect either directly the Columbic or dipolar interactions between the analyteandselector,orinfluenceindirectlytheretentionbychang- ing theconformation ofthe macrocyclic glycopeptides. Toobtain thehighestresolutionandselectivityaneluentpHaof5.0orabove canberecommendedfortheenantioseparationofß-aminoacids.3.2. Effectsofmobilephasecompositiononthechromatographic performance
Employing analytes 3 and9, first, the effects of five different mobile phaseadditives(salts oracids,namelyHCO2NH4,NH4OAc, TEAA, FA,and AcOH) were studied on the chromatographic per- formanceofT-3.0andTAG-3.0CSPs.Experimentswereperformed withaconstantaqueoustoorganicsolventratio(H2O/MeOH90/10 v/v)andaconstantadditiveconcentration(20.0mM,calculatedfor thewholeeluentsystem).Inthecaseoforganicsalts,thepHawas adjusted to5.0by theadditionofthe correspondingacid. Mobile phasescontainingsolely20.0mMFAorAcOH(withoutpHadjust- ment) resultedinunresolvedpeakswithratherpoorpeak shapes (Fig.S2). Incontrast,whenHCO2NH4,NH4OAcorTEAAwereused asmobilephaseadditive,resolutioncouldbeobtained.Employing TEAA has ledto symmetricalpeak shapes, very goodefficiencies, andselectivities.Therefore,infurther experiments,TEAAwasthe favoredmobilephaseadditive.Itisworthmentioningthatregard- ing MS-baseddetection,NH4OAcoffershighersensitivitywithac- ceptablepeakshapesandresolution.
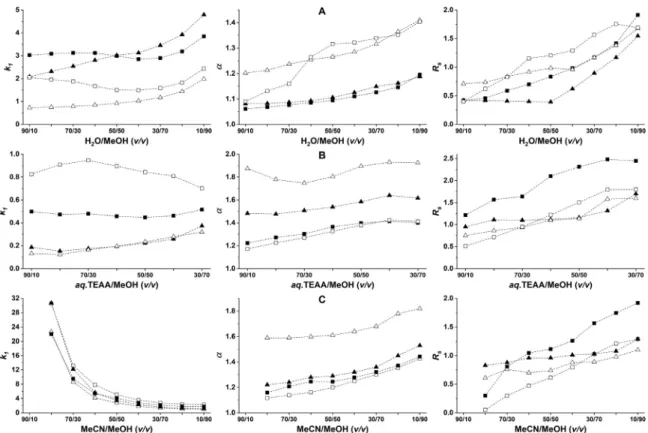
MeOH and MeCN organic modifiers are used commonly in amino acid separations [9]. The nature and concentration of the mobile phase components can exert considerable effects on re- tention and separation. Therefore, we next investigated the ef- fects oforganic modifierson the enantioseparationof analytes3
and9utilizingT-3.0 andTAG-3.0CSPs. Figure 2showsthe chro- matographic figures of merit for the separations of analytes 3 and 9 in three different eluent systems. In unbuffered RP mode (a), mobile phase compositions of H2O/MeOH 90/10–10/90 (v/v), in buffered RP mode (b), aq.TEAA/MeOH 90/10-30/70 (v/v) con- taining 20 mM TEAA and pHa 5.0, and in polar-ionic mode (c), MeCN/MeOH90/10–10/90(v/v) containing20mM TEAAwere ap- plied.
Intheunbufferedeluentsystem(Fig.2A),k1increaseswithin- creasingMeOHcontent,however,not inthewholerangestudied.
Theobservedphenomenonisatleastpartlyforthelowersolubil- ity of amino acids withpolar character in the lesspolar MeOH.
Theobservedminimuminthecurveforanalyte9indicatesanin- creasedhydrophobic interaction at higherwatercontent. Regard- ing
α
andRS values,theyincreasewithincreasingMeOHcontent.Interestingly, comparing the two CSPs, k1 values were higher on theT-3.0column,whilehigher
α
andRS valueswereregisteredon TAG-3.0.,whichmayindicate reducednonselectiveinteractions in thelattercase.Under buffered RP conditions (Fig. 2B), similar to the un- bufferedeluents,aslightincreaseink1,
α
,andRS valueswasreg- isteredwithincreasingMeOH content.Asan exception,analyte 9 on theTAG-3.0 columnfirst showeda moderateincrease, then a slightdecreasefork1.Comparingthesetwoeluentsystems, are- markable difference between chromatographic performances can benoted.InthepresenceofTEAA,higherα
andRS valuesareob- tainedwithsignificantlylowerretentions,suggestingapronounced suppressionofnonselectiveinteractions betweentheanalytesand thestationaryphasebythesaltaddition.TheresultsobtainedwiththeapplicationofmixturesofMeCN andMeOH along with acid andbase additivesin the polar-ionic mode aredepictedin Fig.2C. Withvariation inthecomposition of the eluent the acid–base equilibrium and proton activity will be changed. At high MeCNcontent, the solvation of polar amino acidsintheaproticsolventdecreasesresultinginhighretentions, whilethe increasing ratioof protic MeOHfavors thesolvation of polaramino acids, i.e.,retention decreases. The change of
α
andRS values exhibited trends similar to those discussed above. The improvedselectivity with increasing MeOHcontent suggeststhat hydrogenbondingmaynot playamajorroleintheseenantiosep- arations.
3.3. Effectsofthecounter-ionconcentration
The stoichiometric displacement model [31] is applied fre- quently to describe the retention behavior based on ion-pairing andion-exchangemechanisms,predictingalinearrelationshipbe- tween thelogarithm ofthe retentionfactor andthelogarithm of thecounter-ionconcentration,
logk= logKZ−Zlogccounter−ion (1)
whereZ isthe ratio ofthe numberof chargesof the cationand thecounter-ion, whileKz describestheion-exchangeequilibrium.
If an ion-exchange mechanism exists, plotting log k against log ccounter-ion will result in a straight line witha slope proportional totheeffectivechargeduringtheion-exchangeprocess,whilethe interceptprovidesinformationabouttheequilibriumconstant.
Toprobethepotencyofthesimpledisplacementmodelinour case,experimentswerecarriedout onT-3.0 andTAG-3.0CSPsap- plying mobilephasesb,aq.TEAA/MeOH (90/10v/v, pHa ≈5.5)and c,MeCN/MeOH(10/90v/v) both containing5.0-160 mMTEAA. In a cation exchange process in the presence of TEAA, the proto- natedtriethylammoniumionactsasacompetitor.Theresultspre- sented in Fig. 3, definitely indicate the applicability of the sto- ichiometric displacement model, i.e., they support the involve- ment ofion-interactionprocesses intheretention mechanism. In
Figure 2. Effect of bulk solvent composition on chromatographic parameters for analyte 3 and 9 applying different mobile phase systems
Chromatographic conditions: column, T-3.0 and TAG-3.0; mobile phase, a, H 2O/MeOH (90/10–10/90 v/v ), b , aq. TEAA/MeOH (90/10-30/70 v/v ), concentration of TEAA in mobile phase 20.0 mM and the actual pH of the mobile phase, pH a5.0, c , MeOH/MeCN (90/10–10/90 v/v ), concentration of TEAA in mobile phase, 20.0 mM; flow rate, 0.3 ml min –1; detection, 210-258 nm; temperature, 20 °C; symbols, on T-3.0 for analyte 3 , , for analyte 9 , █, on TAG-3.0 for analyte 3 , , for analyte 9 ,
Figure 3. Effect of ion content on retention factor of the first eluting enantiomer, k 1 for analytes 3 and 9 Chromatographic conditions: column, T-3.0 and TAG-3.0;
mobile phase, A, aq. TEAA/MeOH (90/10 v/v ), concentration of TEAA in mobile phase, 5.0-160 mM, B, MeCN/MeOH (10/90 v/v ), concentration of TEAA in mobile phase, 5.0-160 mM; flow rate, 0.3 ml min –1; detection, 210-258 nm; temperature, 20 °C;
symbols, on T-3.0 for analyte 3 , , for analyte 9 , █, on TAG-3.0 for analyte 3 , , for analyte 9 ,
thisstudy,linearrelationshipswere foundbetweenlogk1 vs. log ccounter-ion,withslopesvarying betweenabout(–0.10)and(–0.23).
Inan earlierstudy,slopes around–1.0 werefoundforstrongion- exchangers, where the selector and selectand act in almost fully ionizedform [32].In absoluteterms,thesmallerslopes observed reveal a marked difference between the strong and weak ion- exchanger-basedCSPs[33].Inthecaseofweakion-exchangerCSPs, theretention(affectedbythepHandtheionicstateoftheselector andanalyte)canbereducedwiththeenhancementofthecounter- ionconcentration,butonlytoalimitedrange.Itisworthmention- ing thatonbothCSPs,practicallyequalslopes werecalculatedfor each enantiomer, i.e., no significant difference could be observed
inthe enantioselectivitieswithvarying counter-ion concentration (datanotshown).
3.4. Effectsofstructuresofselectorandanalyteonretentionand selectivity
The structure of both the chiral selector and the analyte af- fects considerably their interactions resulting in different reten- tion and separation characteristics. To gain a set of chromato- graphic data, screening of the enantioseparation of 19 ß2-amino acidswasperformedonfourteicoplaninandteicoplaninaglycone- basedcolumnsinthreedifferentmobilephasesystems:unbuffered RP(a,H2O/MeOH30/70v/v),bufferedRP(b,aq.TEAA/MeOH30/70 v/v, containing 2.5 mM TEA and 5.0 mM AcOH, pHa 5.5), and a polar-ionicmobile phase (c,MeCN/MeOH30/70 v/v,containing 2.5mMTEAand5.0mMAcOH).Therelatedchromatographicdata aresummarizedinTablesS1−S4.Allstudiedß2-aminoacidswere baseline-separatedon atleastone CSP,andoften withbothCSPs withinthreetofiveminutesdependingonthenatureofanalytes, mobilephase,andinnerdiameterofcolumns.The overallsuccess rate ofthe enantioseparations is depicted in Fig. S3. Taking into account the time needed for the analyses, application of mobile phase a and b seemed to be more favorable (Tables S1−S4). It should benoted, that the analysistime obtainedhereisthree to tentimeslowerthan thatobserved earlieron 5μmparticlesand 4.6 mm i.d. columns [10-13]. It was also observed that, in most cases,ß2-aminoacidspossessingaliphaticsidechains(analytes1- 8)exhibitedslightlysmallerRSvaluesthananalyteswitharomatic sidechains(9-19).Thisisinspiteoftheir similarenantioselectiv- ity(1.30<
α
<2.20).Foranalytes9-19, inalmost all cases,RS >1.5wasobtainedonallfourcolumnsappliedwithanyofthethree mobilephasesystems(exceptionswerecompounds12and13).
Figure 4. Dependence of retention factors of the first eluting enantiomer ( k 1) and separation factors ( α) of analytes 1-6 on the Meyer substituent parameter ( V a) Chromato- graphic conditions, column, T-3.0, T-2.1, TAG-3.0 and TAG-2.1; mobile phase, A , aq. TEAA/MeOH (30/70 v/v ), concentration of TEA and AcOH in mobile phase 2.5 and 5.0 mM, respectively and the actual pH of the mobile phase, pH a5.5, B, MeCN/MeOH (30/70 v/v ), concentration of TEA and AcOH in mobile phase 2.5 and 5.0 mM, respectively; flow rate, 0.3 ml min –1; detection, 210-258 nm; temperature, 20 °C; symbols, for T-3.0 █, for TAG-3.0 , for T-2.1 and for TAG-2.1
Inordertodeterminethespecificstructuraleffectsofanalytes possessing alkyl side chains on chromatographic data such ask1 and
α
,theeffectofthevolumeofthealkyl substituents(Va)was investigated.Thestericeffectofasubstituentonthereactionrate can be characterized by the size descriptor of the molecule, Va [34].TheVa valuesforMe,Et,Pr,Bu,2-Pr,and2-Bumoietiesare 2.84,4.31,4.78,4.79,5.74,and6.21×10−2nm3,respectively.Note, thattherearenoVavaluesavailablefor6-methylheptanoic(7)and 5-cyclohexylpentanoic (8) moieties.Valuesofk1 andα
showedagood correlation withVa on all studiedcolumns inall threeelu- entsystems.AsthedatapresentedinFig.4confirmthevolumeof thealkylsubstituentsmarkedlyinfluencedk1:abulkiersubstituent hindered the interactions betweenthe selector andanalyte lead- ing to reducedretention. Since the difference in the interactions of thetwo enantiomeric analyteswiththe CSPdiffered consider- ably,anenhancedchiralrecognitionwithhigherVavaluescouldbe observed. Itshould benotedhere, thatnot onlythe positionand bulkiness ofthe substituent butalso the steric effect may heav- ilyinfluenceretentionbehaviorandchiralrecognitionofß2-amino acids.
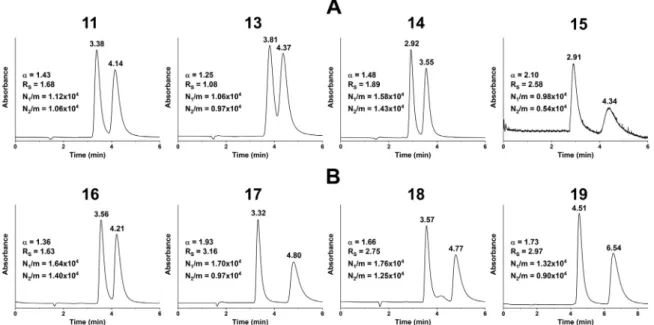
Comparingtheseparationofanalytes9-19possessingaromatic orsubstituted aromaticside chainsto analytes1-8.showshigher RS values for analytes 9 – 19. In most cases, the RS was above 1.5andonlyanalytes12and13exhibitedpoorerresolution(Table S1−S4). The mostrelevantandoptimized dataofseparations are depictedinTable1.Thepresenceofanaromaticmoietyinsteadof analiphaticsidechainin9-19probablyimproves
π
–π
-interactions between theenantiomers andthe chiralselector and contributes to betterchiral recognition.Enantiomersofanalyte 12possessing an additional 4-dimethylamino moiety (pKa 5.0, calculated with Marvin Sketch v. 17.28 software, ChemAxon Ltd., Budapest) were baseline-separatedonlyinmobilephasesbandc,wheretheionic strengthcouldbekeptataconstantlevel.Analytes 11,13,and14possessamethyl,chlorine,orhydroxyl substituent at position 4 of the aromatic ring, giving
π
-basic orπ
-acidic character to the molecules. Figures 5 and S4 are chro-matogramsthat illustratetheseparationperformance obtainedon TAG-3.0andT-3.0CSPsintwodifferenteluentsystems.Themethyl andchlorine moietiesshow slighteffectsonretention,selectivity, andresolution,whilethehydroxylmoietiesandtheirpositions in analytes14vs.15 affectconsiderablytheseparationperformance.
The3-positionofthehydroxylmoietyprobablyfavorsstericinter- actions betweenselector andanalyte resultingin higherselectiv- ity andresolution,in particular,on the TAG-3CSP in H2O/MeOH (30/70v/v)mobilephase(Fig.5A).Thesedifferences,especiallyin resolution,canbeobservedinFig.S4AandS4B.
Analytes16-18possessanadditionaletherO-atom,whichisca- pable of H-bond interactions, while 19 bears a naphthyl moiety,
whichmayfacilitatestronger
π
–π
-interactions.Allthesestructural features ledtohigherα
andRS valuesasdepictedinFig.5Band Fig.S4B.Inaddition to thechromatograms foranalytes11-19,Figure 6 depictsselected chromatogramsforanalytes1-10 and12 aswell representingtheseparationsobtainedwithinthreeminutes.Using enantiopure analytes, elution sequences for analytes 2, 5, and 6 were determined and found to be the same forall columnsand mobilephases,theywere,R<S.
According to the data in Tables S1–S4, the separation fac- tors, despite similar retention times and retention factors of the first eluting enantiomers, sometimes differ considerably on the teicoplanin-andteicoplaninaglycone-basedCSPs,indicatingapos- sibledifferenceintheseparationmechanism.Inmostcases,higher selectivities and resolutions were obtained with the aglycone- based CSP underall the studied conditions,while no cleartrend could be observed for the variation in the retention times. As described earlier [35] the sugar units of the native teicoplanin may affectthe chiral recognition process in differentways; they block the possible interaction sites on the aglycone, occupy the space inside the “basket”, and offer additional interaction sites since the three sugar units are themselves chiral. To quanti- tatively determine the effects of the sugar units, the equation (G°) = −RT ln
α
was applied for the calculation of the dif- ferences in enantioselective free energies between the two CSPs [(G°)TAG−(G°)T].AsillustratedinFig.7,theenergydiffer- ences[(G°)TAG−(G°)T]withveryfew exceptions,areneg- ative,i.e., theinteractionbetweenthe freeaglyconebasket(with- out the sugar moieties) and analyte improves chiral recognition.Bycomparing the[(G°)TAG − (G°)T] valuesforanalytes1- 6, it is interesting to note that in the case of molecules with a largersize, interactionsbetweenselector andanalyteare favored.
It should be noted that [(G°)TAG − (G°)T] valuescan vary withtheamountofmobilephaseadditives.
3.5. vanDeemteranalysis
Organiccomponentsofeluents(MeOHandMeCN)usedinthis studyincombinationwithwateryieldmobilephaseswithconsid- erableviscosity, while combinationofMeOH andMeCN resultin low-viscosityeluentallowinghigherflowrateswithouthighback- pressures.AccordingtoDarcy’slaw,backpressurerelatestomobile phase viscosity and linear velocity [21,36]. For the investigation of vanDeemter plots,mobile phasespossessing low andmoder- ate viscosity [mobile phase b, aq.TEAA/MeOH (30/70 v/v) and c, MeCN/MeOH(30/70v/v,respectively)bothcontaining2.5mMTEA and5.0mMAcOH] wereselected, andplots wereconstructed on allfourstudiedcolumnsforanalytescontaininganaliphatic(6)or
Table 1
Selected chromatographic data for the separation of ß2-amino acids
Analyte Column Mobile phase k 1 α R S
aliphaticß2-amino acids
1 T-3.0 H 2O/MeOH (30/70 v/v ) 0.40 1.30 1.01
T-3.0 H 2O/MeOH (10/90 v/v ) 0.20 1.46 0.90
TAG-3 H 2O/MeOH (30/70 v/v ) 0.70 1.30 1.05
TAG-3 H 2O/MeOH (10/90 v/v ) 1.82 1.22 0.72
TAG-3.0 aq. TEAA/MeOH (10/90 v/v ) 1.75 1.24 0.74
2 T-3.0 aq. TEAA/MeOH (30/70 v/v ) 0.53 1.35 1.32
TAG-3.0 H 2O/MeOH (30/70 v/v ) 0.50 1.54 1.35
3 T-3.0 H 2O/MeOH (30/70 v/v ) 0.34 1.75 2.48
T-2.1 H 2O/MeOH (30/70 v/v ) 0.86 1.30 1.58
T-3.0 H 2O/MeOH (30/70 v/v ) 0.47 1.80 2.66
TAG-3.0 MeCN/MeOH (30/70 v/v ) 1.49 1.63 1.71
TAG-2.1 MeCN/MeOH (30/70 v/v ) 1.04 1.72 1.53
4 T-3.0 H 2O/MeOH (30/70 v/v ) 0.33 1.76 2.07
TAG-3.0 MeCN/MeOH (30/70 v/v ) 1.37 1.60 1.70
TAG-2.1 MeCN/MeOH (30/70 v/v ) 0.97 1.66 1.40
5 T-3.0 H 2O/MeOH (30/70 v/v ) 0.30 1.85 1.71
TAG-3.0 H 2O/MeOH (30/70 v/v ) 0.45 1.90 1.35
TAG-3.0 MeCN/MeOH (30/70 v/v ) 1.02 1.73 1.37
TAG-3.0 MeCN/MeOH (10/90 v/v ) 1.09 1.51 1.58
6 T-3.0 H 2O/MeOH (30/70 v/v ) 0.28 2.03 2.50
T-3.0 MeCN/MeOH (10/90 v/v ) 1.45 1.45 0.83
T-2.1 H 2O/MeOH (30/70 v/v ) 0.85 1.46 1.64
TAG-3.0 H 2O/MeOH (30/70 v/v ) 0.95 2.06 2.39
TAG-3.0 aq. TEAA/MeOH (30/70 v/v ) 0.22 1.74 1.30
TAG-3.0 aq. TEAA/MeOH (10/90 v/v ) 0.73 2.24 2.88
TAG-3.0 MeCN/MeOH (30/70 v/v ) 1.15 1.82 2.02
TAG-2.1 H 2O/MeOH (30/70 v/v ) 0.77 1.48 1.72
TAG-2.1 MeCN/MeOH (30/70 v/v ) 0.69 1.90 1.89
7 T-3.0 H 2O/MeOH (30/70 v/v ) 0.27 1.81 1.97
TAG-3.0 H 2O/MeOH (30/70 v/v ) 0.66 1.64 1.80
TAG-3.0 aq. TEAA/MeOH (20/80 v/v ) 0.28 1.62 1.14
TAG-3.0 aq. TEAA/MeOH (10/90 v/v ) 0.79 1.80 2.08
TAG-3.0 MeCN/MeOH (30/70 v/v ) 1.08 1.60 1.77
( continued on next page )
Table 1 ( continued )
Analyte Column Mobile phase k 1 α R S
8 T-3.0 H 2O/MeOH (30/70 v/v ) 1.10 1.59 2.05
T-3.0 aq. TEAA/MeOH (10/90 v/v ) 0.79 1.61 1.67
TAG-3.0 MeCN/MeOH (30/70 v/v ) 1.55 1.56 1.75
aromatic ß2-amino acids
9 T-3.0 H 2O/MeOH (30/70 v/v ) 0.82 1.36 1.75
T-3.0 aq. TEAA/MeOH (30/70 v/v ) 0.62 1.48 1.99
T-2.1 H 2O/MeOH (30/70 v/v ) 1.73 1.23 1.94
T-2.1 aq. TEAA/MeOH (30/70 v/v ) 0.69 1.53 1.73
T-2.1 MeCN/MeOH (30/70 v/v ) 2.43 1.39 1.68
TAG-3.0 H 2O/MeOH (30/70 v/v ) 1.00 1.49 1.82
TAG-3.0 aq. TEAA/MeOH (30/70 v/v ) 0.91 1.49 1.94
TAG-2.1 H 2O/MeOH (30/70 v/v ) 1.09 1.34 1.59
TAG-2.1 aq. TEAA/MeOH (30/70 v/v ) 0.72 1.60 1.72
TAG-2.1 MeCN/MeOH (30/70 v/v ) 1.67 1.48 1.68
10 T-3.0 H 2O/MeOH (30/70 v/v ) 0.97 1.50 1.74
T-3.0 aq. TEAA/MeOH (30/70 v/v ) 0.62 1.70 2.77
T-3.0 MeCN/MeOH (30/70 v/v ) 1.88 1.43 1.76
T-2.1 H 2O/MeOH (30/70 v/v ) 1.74 1.21 1.87
T-2.1 aq. TEAA/MeOH (30/70 v/v ) 0.72 1.72 2.40
T-2.1 MeCN/MeOH (30/70 v/v ) 2.07 1.52 2.08
TAG-3.0 H 2O/MeOH (30/70 v/v ) 1.19 1.73 2.83
TAG-3.0 aq. TEAA/MeOH (30/70 v/v ) 1.10 1.74 3.02
TAG-3.0 MeCN/MeOH (30/70 v/v ) 2.05 1.71 2.06
TAG-2.1 H 2O/MeOH (30/70 v/v ) 1.24 1.46 2.31
TAG-2.1 aq. TEAA/MeOH (30/70 v/v ) 0.89 1.75 2.50
TAG-2.1 MeCN/MeOH (30/70 v/v ) 1.45 1.80 2.54
11 T-3.0 aq. TEAA/MeOH (30/70 v/v ) 0.64 1.39 1.70
T-2.1 H 2O/MeOH (30/70 v/v ) 1.87 1.17 1.58
T-2.1 aq. TEAA/MeOH (30/70 v/v ) 0.72 1.46 1.59
T-2.1 MeCN/MeOH (30/70 v/v ) 2.30 1.33 1.46
TAG-3.0 aq. TEAA/MeOH (30/70 v/v ) 1.12 1.43 1.68
TAG-3.0 MeCN/MeOH (30/70 v/v ) 1.02 1.41 1.78
TAG-2.1 H 2O/MeOH (30/70 v/v ) 1.39 1.39 2.02
TAG-2.1 aq. TEAA/MeOH (30/70 v/v ) 0.81 1.51 1.64
TAG-2.1 MeCN/MeOH (30/70 v/v ) 1.58 1.45 1.64
12 T-3.0 aq. TEAA/MeOH (30/70 v/v ) 1.57 1.17 1.27
T-3.0 aq. TEAA/MeOH (10/90 v/v ) 1.88 1.44 1.97
T-2.1 MeCN/MeOH (30/70 v/v ) 2.95 1.32 1.37
T-2.1 MeCN/MeOH (10/90 v/v ) 2.35 1.27 1.19
TAG-3.0 MeCN/MeOH (30/70 v/v ) 2.62 1.33 1.06
TAG-3.0 MeCN/MeOH (10/90 v/v ) 3.08 1.39 1.15
TAG-2.1 MeCN/MeOH (20/80 v/v ) 1.81 1.43 1.53
( continued on next page )
Table 1 ( continued )
Analyte Column Mobile phase k 1 α R S
13 T-3.0 aq. TEAA/MeOH (30/70 v/v ) 0.73 1.18 1.32
T-3.0 aq. TEAA/MeOH (10/90 v/v ) 1.30 1.32 1.56
T-2.1 aq. TEAA/MeOH (30/70 v/v ) 0.78 1.30 1.32
T-2.1 aq. TEAA/MeOH (10/90 v/v ) 1.62 1.40 1.91
TAG-3.0 aq. TEAA/MeOH (30/70 v/v ) 1.33 1.26 1.22
TAG-3.0 aq. TEAA/MeOH (10/90 v/v ) 2.08 1.28 1.07
TAG-2.1 H 2O/MeOH (30/70 v/v ) 1.60 1.28 1.47
TAG-2.1 aq. TEAA/MeOH (30/70 v/v ) 1.04 1.35 1.21
TAG-2.1 aq. TEAA/MeOH (10/90 v/v ) 1.49 1.38 1.46
14 T-3.0 aq. TEAA/MeOH (30/70 v/v ) 0.67 1.46 1.84
T-2.1 H 2O/MeOH (30/70 v/v ) 1.71 1.16 1.49
T-2.1 aq. TEAA/MeOH (30/70 v/v ) 0.73 1.51 1.74
T-2.1 MeCN/MeOH (30/70 v/v ) 2.47 1.37 1.59
TAG-3.0 H 2O/MeOH (30/70 v/v ) 0.83 1.48 1.89
TAG-3.0 aq. TEAA/MeOH (30/70 v/v ) 0.95 1.96 3.32
TAG-3.0 MeCN/MeOH (30/70 v/v ) 2.63 1.43 1.38
TAG-2.1 H 2O/MeOH (30/70 v/v ) 1.11 1.39 2.09
TAG-2.1 aq. TEAA/MeOH (30/70 v/v ) 0.74 2.13 2.78
TAG-2.1 MeCN/MeOH (30/70 v/v ) 1.88 1.53 1.91
15 T-3.0 H 2O/MeOH (30/70 v/v ) 0.86 1.40 1.57
T-3.0 aq. TEAA/MeOH (30/70 v/v ) 0.59 1.50 3.10
T-3.0 MeCN/MeOH (30/70 v/v ) 2.31 1.36 1.38
TAG-3.0 H 2O/MeOH (30/70 v/v ) 0.82 2.10 2.58
16 T-3.0 aq. TEAA/MeOH (30/70 v/v ) 0.68 1.34 1.51
T-2.1 H 2O/MeOH (30/70 v/v ) 1.92 1.16 1.50
T-2.1 aq. TEAA/MeOH (30/70 v/v ) 0.76 1.41 1.48
TAG-3.0 H 2O/MeOH (30/70 v/v ) 1.12 1.37 1.48
TAG-3.0 aq. TEAA/MeOH (30/70 v/v ) 1.07 1.36 1.63
TAG-2.1 H 2O/MeOH (30/70 v/v ) 1.47 1.34 1.90
TAG-2.1 aq. TEAA/MeOH (30/70 v/v ) 0.85 1.44 1.53
TAG-2.1 MeCN/MeOH (30/70 v/v ) 1.63 1.41 1.51
17 T-3.0 aq. TEAA/MeOH (30/70 v/v ) 0.67 1.45 1.82
T-2.1 H 2O/MeOH (30/70 v/v ) 1.86 1.18 1.57
T-2.1 aq. TEAA/MeOH (30/70 v/v ) 0.73 1.50 1.74
TAG-3.0 H 2O/MeOH (30/70 v/v ) 0.92 2.00 2.91
TAG-3.0 aq. TEAA/MeOH (30/70 v/v ) 0.93 1.93 3.16
TAG-3.0 MeCN/MeOH (30/70 v/v ) 2.91 1.70 2.14
TAG-2.1 H 2O/MeOH (30/70 v/v ) 1.26 1.74 3.00
TAG-2.1 aq. TEAA/MeOH (30/70 v/v ) 0.74 2.12 2.78
TAG-2.1 MeCN/MeOH (30/70 v/v ) 2.13 1.83 2.64
( continued on next page )
Table 1 ( continued )
Analyte Column Mobile phase k 1 α R S
18 T-3.0 H 2O/MeOH (30/70 v/v ) 1.19 1.35 1.58
T-3.0 aq. TEAA/MeOH (30/70 v/v ) 0.74 1.47 2.09
T-3.0 MeCN/MeOH (30/70 v/v ) 2.37 1.32 1.48
T-2.1 H 2O/MeOH (30/70 v/v ) 2.02 1.22 1.91
T-2.1 aq. TEAA/MeOH (30/70 v/v ) 0.84 1.52 1.94
T-2.1 MeCN/MeOH (30/70 v/v ) 2.71 1.40 1.74
TAG-3.0 H 2O/MeOH (30/70 v/v ) 1.05 1.73 2.72
TAG-3.0 aq. TEAA/MeOH (30/70 v/v ) 1.07 1.66 2.75
TAG-3.0 MeCN/MeOH (30/70 v/v ) 2.50 1.55 1.68
TAG-2.1 H 2O/MeOH (30/70 v/v ) 1.44 1.56 2.88
TAG-2.1 aq. TEAA/MeOH (30/70 v/v ) 0.84 1.77 2.46
TAG-2.1 MeCN/MeOH (30/70 v/v ) 1.76 1.66 2.27
19 T-3.0 H 2O/MeOH (30/70 v/v ) 1.17 1.45 1.98
T-3.0 aq. TEAA/MeOH (30/70 v/v ) 0.75 1.64 2.71
T-3.0 MeCN/MeOH (30/70 v/v ) 2.27 1.36 1.55
T-2.1 H 2O/MeOH (30/70 v/v ) 1.97 1.31 2.37
T-2.1 aq. TEAA/MeOH (30/70 v/v ) 0.88 1.70 2.57
T-2.1 MeCN/MeOH (30/70 v/v ) 2.96 1.45 1.94
19 TAG-3.0 H 2O/MeOH (30/70 v/v ) 1.53 1.75 2.77
TAG-3.0 aq. TEAA/MeOH (30/70 v/v ) 1.62 1.73 2.97
TAG-3.0 MeCN/MeOH (30/70 v/v ) 2.95 1.53 1.50
TAG-2.1 H 2O/MeOH (30/70 v/v ) 1.60 1.67 3.22
TAG-2.1 aq. TEAA/MeOH (30/70 v/v ) 1.04 1.86 2.83
TAG-2.1 MeCN/MeOH (30/70 v/v ) 2.12 1.69 2.30
Chromatographic conditions: column, T-3.0, T-2.1, TAG-3.0 and TAG-2.1 ; mobile phase, H 2O/MeOH (30/70 v/v ), aq. TEAA/MeOH (30/70 v/v ) and MeCN/MeOH (30/70 v/v ), the latter two contain 2.5 mM TEA and 5.0 mM AcOH; flow rate, 0.3 ml min −1; detection, 210-258 nm; temperature, 20
°C
aromatic(9)sidechain.vanDeemterplotsareshowninFigure8A (foranalyte6)andFig.S5A(foranalyte9)inpolar-ionicmode.In the polar-ionic mode, the curvesfor the first elutingenantiomer showcharacteristicminimaforanalyte6onT-3.0,T-2.1,andTAG- 3.0 columns, and a slight minima on TAG-2.1 at ~1.5 mm sec–1 (Fig. 8A). It should be notedthat 2.1 mm i.d. columns are usu- allylessefficientthan3.0mmonesduetowall effects(Fig.8A).
The Hminima onT-3.0 andTAG-3.0 were registeredat0.24 mm sec–1,whileonT-2.1at0.48mmsec–1linearvelocity,whichcorre- spondstoaflowrateof0.1mlmin–1.ThevanDeemtercurvesfor teicoplanin-basedcolumns runbelowthe plotsofthe teicoplanin aglycone. Fig. S5 A depicts van Deemter plots for analyte 9 un- derthesameconditions.Theshapeofthecurveforcolumnswith 3.0 mm i.d. are similar to plots obtained for analyte 6 (minima areintherange0.24–0.48mmsec–1,i.e.,0.1–0.2mlmin–1),while plots obtainedoncolumns with2.1mmi.d. exhibitedslightmin- imaatlowerflowrates(0.05–0.1mlmin–1).Interestingly,theH-u plot for theteicoplanin aglycone column with2.1 mm i.d. (TAG- 2.1)runsbelowthesametype ofcolumnwithalarger i.d.(TAG- 3.0). Figures8B andS5B depict vanDeemter plotsforanalytes 6 and 9 applying mobile phase b, aq.TEAA/MeOH (30/70 v/v) con- taining 2.5 mM TEA and 5.0 mM AcOH on teicoplanin- and te-
icoplaninaglycone-basedcolumnspossessingdifferentinternaldi- ameters.ThevanDeemtercurvesathighflowrates(wheretheC- termdominates) on T-3.0 columns exhibited a slight increase in plate height, while on T-2.1 columns a decrease in plate height (slightly negativeslope) wasregistered for both analytes athigh flowrates.Itisdescribedseveraltimesthatathighbackpressures, two typesoftemperature gradients – axialandradial – exist to- getherastheresultofsignificantfrictionalheating[16,37-39].Ax- ialtemperaturedifferencesrangingfrom11to16°Ccanreadilybe generatedwhenpressureabove300barisapplied[16,37].Insome cases,longitudinalfrictionalheatingwasfoundtoincreasethechi- ral resolution when small particles andhigh flow rates are used [16,21].InFig.8C,vanDeemterplotsforthefirstandsecondelut- ingenantiomer ofanalyte6on TAG-3andanalyte9on theT-2.1 columnaredepicted.Itisinteresting tonote thatidenticalkinetic plotshapeswererecordedforbothenantiomerswiththecurvefor the second enantiomershifted upwards.The similar shapesindi- catethat bothenantiomershavesimilar adsorption/desorptionki- netics(thesameresultswereobtainedunderotherconditionstoo;
datanotshown).Insummary,comparingresultsobtainedforvan Deemteranalysesandscreeningexperimentsof19ß2-aminoacids (registeredata flow rateof0.3 mlmin–1), thefollowing conclu-
Figure 5. Effect of nature of substituents and chemical structure of analytes on chromatographic performance for analytes 11 and 13-19 Chromatographic condition, column, TAG-3.0; mobile phase, A , H 2O/MeOH (30/70 v/v ), B, aq. TEAA/MeOH (30/70 v/v ), concentration of TEA and AcOH in mobile phase 2.5 and 5.0 mM, respectively and the actual pH of the mobile phase, pH a5.5; flow rate, 0.3 ml min –1; detection, 258 nm; temperature, 20 °C
Figure 6. Selected chromatograms for analytes 1-10 and 12 Chromatographic conditions, columns, for analytes 1, 4, 6, 7 , and 8 T-3.0, for 2, 3 and 5 TAG-3.0, for 9 and 10 T-2.1 and for 11 and 12 TAG-2.1; mobile phase, for analytes 1-7 and 11 , H 2O/MeOH (30/70 v/v ), for 8-10 and 12 aq. TEAA/MeOH (30/70 v/v ), concentration of TEA and AcOH in mobile phase 2.5 and 5.0 mM, respectively and the actual pH of the mobile phase, pH a5.5; flow rate, 0.3 ml min –1; detection, 258 nm; temperature, 20 °C;
sions can be drawn: (i) higher plate numbers were obtainedon teicoplanin-based than on teicoplanin aglycone-based CSP (T-3.0 vs. TAG-3.0 andT-2.1 vs.TAG-2.1), (ii) in general, forSPPs of 2.7 μm, thenarrow borecolumns (2.1 mm i.d.)show decreased effi- ciencycomparedtotheircounterpartswith3.0mmi.d.Note,that the lattercolumns were expected to outperform the columns of 2.1 mm i.d, and this expectation was met underall the studied conditions. It mustbe emphasized, however, that columnperfor- mance,inthepractice,dependsonboththenatureofanalytesand themobilephasecomposition.Hvaluesforanalytespossessingan alkyl sidechain(1-8) werealwayssmalleroncolumnsof3.0mm i.d., while for analytespossessing an aromatic side chain (9-19), columns of 2.1mm i.d. showed better performance (Table S1–S4 andFig.S5A).However,intheRPmodeforanalytes9-19,columns of 3.0 mm i.d. always outperformed the columns of 2.1 mm i.d.
columns(TableS1–S4).
3.6. Temperaturedependenceandthermodynamicparameters
Studyingtheeffectsoftemperatureonretentionandenantios- electivity in chiral separations is an often applied methodology to gather information on enantiomer recognition [40-43]. Theo- retically,retention observed on chiral CSPsconsists ofchiral and nonchiral components [44-48],however, in thisstudy, these two components are not differentiated. Keeping in mind the limita- tionsoftheapproach,usedherein thedifferenceinthechangein standardenthalpy(H°)andentropy(S°)fortheenantiomer pairswere calculatedusingtherelationshipbetweenln
α
(naturallogarithmoftheapparentselectivityfactor)andT−1(reciprocalof absolutetemperature)asdescribedbythevan’tHoff equation:
ln
α
= −(
RTH◦
)
+(
RS◦)
(2)Figure 7. Enantioselectivity free energy differences ( G °) TAG −( G °) Tbetween aglycone and native teicoplanin selector Chromatographic condition, column, A , TAG-3.0 vs. T-3.0 and B, TAG-2.1 vs. T-2.1; mobile phase, a , H 2O/MeOH 30/70 v/v ), b , aq. TEAA/MeOH (30/70 v/v ), concentration of TEA and AcOH in the mobile phase 2.5 and 5.0 mM, respectively, and the actual pH of the mobile phase, pH a5.5, c , MeCN/MeOH (30/70 v/v ), concentration of TEA and AcOH in the mobile phase 2.5 and 5.0 mM, respectively;
flow rate, 0.3 ml min –1; detection, 210-258 nm; temperature, 20 °C; symbols, mobile phase, a , mobile phase, b and mobile phase, c
Figure 8. Plots of plate heights versus superficial velocities for analytes 6 and 9 on macrocyclic glycopeptide-based columns Chromatographic conditions: columns, A , T-3.0, T-2.1, TAG-3.0 and TAG-2.1, B , T-3.0, T-2.1 and C , TAG-3.0 and T-2.1 ; mobile phase, A , MeCN/MeOH (30/70 v/v ), concentration of TEA and AcOH in the mobile phase 2.5 and 5.0 mM, respectively, B and C , aq. TEAA/MeOH (30/70 v/v ), concentration of TEA and AcOH in the mobile phase 2.5 and 5.0 mM, respectively, and the actual pH aof the mobile phase, pH a5.5; detection, 210-258 nm; temperature, 20 °C; symbols, A , analyte 6 , T-3.0, T-2.1, TAG-3.0, TAG-2.1; B , analyte 6 , T-3.0, T-2.1, analyte 9 , T-3.0, T-2.1; C , analyte 6 , TAG-3.0 (first enantiomer), TAG-3.0 (second enantiomer), analyte 9 , █T-2.1 (first enantiomer), T-2.1 (second enantiomer)
where Ristheuniversal gasconstant. Asdiscussed earlier,under UHPLC conditionsoperating withinlet pressures above 300 bars, the generatedaxialtemperaturedifferencescanlead toamarked difference betweenreal operationaland setconditions [16,21,37].
Toavoidthetemperaturedifferencescausedbyhighbackpressure, thenatureofappliedmobilephasesandflowrateswere carefully selected forthis study.For example,CSPswith 2.1mm i.d. were appliedonlyinpolar-ionicmode.
Dependence of the chromatographic parameters on tempera- ture was studied on the four columns for analyte 8 possessing an aliphatic side chain, and for analyte 9 bearing an aromatic
side chain in the temperature range 5-50 °C. Experimental data withmobilephasesofaq.TEAA/MeOH(30/70v/v)andMeCN/MeOH (30/70v/v)bothcontaining20mMTEAAarepresentedinTableS5.
Asmostfrequentlyobserved,bothkand
α
decreasedwithincreas-ingtemperatureinallcases.Resolution usuallydecreaseswithin- creasingtemperature, whilein a few cases, RS,exhibited a max- imumcurve withthe changeoftemperature(Table S5). LowerRS valuesatlowandhightemperaturescanbeattributedtothelower kineticandhigherthermodynamiceffect(decreased
α
values),re-spectively.