MTA Közgazdaság- és Regionális Tudományi Kutatóközpont Világgazdasági Intézet
Working paper 243.
August 2018
Csaba Weiner
SECURITY OF ENERGY SUPPLY AND
GAS DIVERSIFICATION IN POLAND
Working Paper Nr. 243 (2018) 1–75. August 2018
Security of energy supply and gas diversification in Poland
Author:
Csaba Weiner
senior research fellow Institute of World Economics
Centre for Economic and Regional Studies Hungarian Academy of Sciences Email: weiner.csaba [at] krtk.mta.hu
The contents of this paper are the sole responsibility of the author and do not necessarily reflect the views of other members of the research staff of the Institute of World Economics, Centre for Economic and Regional Studies HAS
ISSN 1215-5241 ISBN 978-963-301-671-8
Working Paper 243 (2018) 1–75. August 2018
Security of energy supply and gas diversification in Poland
*Csaba Weiner
aAbstract
Poland entered the twenty-first century with an unsustainable energy/electricity mix, strongly over- dependent on coal. This situation seems to be changing very slowly, while there are multiple factors that make it imperative for the issue to be urgently addressed. On the one hand, this paper aims to assess the security of the stationary fuel supply by applying the conventional three-dimensional approach, encompassing availability, affordability and sustainability. On the other, we plan to use our own scheme to analyse gas diversification (Weiner, 2017: 6), i.e. a fuel which, alongside coal, is a very sensitive issue linked to the security of the Polish electric power fuel supply. We demonstrate that the three-dimensional approach is also appropriate for addressing the issue of supply security in the case of a country with a securitized energy agenda based on fears of problems with the availability and affordability of Russian gas supplies. It also highlights Poland’s concern over foreign technological reliance regarding renewables production. We show how the energy perspective, the institutional context, as well as perceptions regarding threat, dependence and Russia influence choices made from among different security of supply dimensions. We find that though the role of coal will surely decrease, there is great uncertainty about Poland’s energy policy and security of supply because of deficiencies in infrastructure and the unknown future role of the particular fuels in the energy/electricity mix, also expected to include nuclear. We can observe that every energy policy step possible is being taken to maintain the role of coal, and Poland moves toward sustainability only as much and as soon as it is required by its EU membership. Not only does the coal industry capture Poland’s energy policy, but also geopolitical considerations cement reliance on coal, providing low energy import dependence. Regarding gas, we find that since the January 2009 Russian–Ukrainian gas crisis, Poland has taken action to diversify its gas supplies, and it has finally achieved results, but there is still a lot of uncertainty surrounding Russian gas imports.
JEL: L71, L95, O13, P28, Q4
Keywords: Poland, Russia, Central and Eastern Europe, energy security, security of supply, gas diversification, coal, gas, nuclear energy, renewables
DISCLAIMER: The purpose of the Working Paper Series is to circulate research findings and stimulate discussion prior to publication in an academic journal. The copyright is retained by the author.
* This paper was supported by the János Bolyai Research Scholarship of the Hungarian Academy of Sciences.
a Ph.D., Senior Research Fellow, Institute of World Economics, Centre for Economic and Regional Studies, Hungarian Academy of Sciences, Tóth Kálmán u. 4, H-1097 Budapest, Hungary. Email: weiner.csaba [at]
krtk.mta.hu.
1. Introduction
This paper is the second in a series assessing gas1 diversification and the security of the supply of stationary fuels in selected Central and East European (CEE) EU member states (Hungary, Poland, Lithuania and Bulgaria). With in-depth case studies, this series underlines these countries’ different conditions, various priorities, and thus differing energy policies, despite their common concerns, primarily linked to being dependent on Russia for energy supplies (Weiner, 2016). These differences have broad policy-oriented implications. For instance, due to the cross-border implications of energy policy decisions, one cannot ignore the energy policies of other countries. Conflicting energy policies can lead to conflicts and become barriers to regional cooperation, while such is essential to enhance supply security and has been strongly encouraged by the EU. Since the 2009 Russian–Ukrainian gas crisis, not only the EU member states but also the EU itself have been focusing strongly on supply security and establishing such cooperation networks. With events in Ukraine in 2014, Russia came to represent a real threat for many Europeans, and thus the EU found an external enemy against whom to unite (Overland, 2017: 126). The EU’s February 2015 Energy Union Framework Strategy called for moving away from fossil fuels and a centralized, supply-side approach relying on old technologies and outdated business models, as well as away from a fragmented system of uncoordinated national policies and energy-isolated areas (Vinois, 2017: 43).
The Energy Union Framework Strategy stated that it would consider reframing the energy relations with Russia (Yafimava, 2015: 15). Since then, the European Commission has published several packages of measures to ensure the Energy Union is achieved, and has also published regular reports on the progress of the Energy Union (European Commission, n.d.-b). However, without a complex assessment of the particular CEE countries, one will not understand the reasons behind energy policy decisions and security of supply and diversification achievements or be able to influence these processes.
The first country assessment referred to Hungary (Weiner, 2017). In the first part of our research, we defined several energy policy-related concepts, and then focused on security of supply and diversification in order to find the appropriate methodology for
1 If otherwise not indicated, gas refers to natural gas.
assessing the selected CEE countries. As a result, on the one hand, we took a conventional approach to assessing the security of stationary fuel supply, and, on the other, we used our own scheme in order to understand gas diversification. The presented methodology allows cross-country comparisons, and makes it possible to arrive at some generalizations. Thus, using the same methodology, this paper looks at our second country, Poland.
This paper is structured as follows. Section 2 discusses the methodology. It deals with two notions, security of supply and diversification. Regarding security of supply, it questions whether the chosen methodology can be applied without modifications to a country which has a securitized energy agenda. Here, geopolitical considerations and the notion of the “energy/gas weapon” are addressed in detail. Section 3 presents and discusses the empirical results through the lens of two case studies. After providing a snapshot of Polish electricity market trends, Section 3.1 assesses the security of supply of coal, renewables and nuclear power in Poland. Section 3.2 starts with a look at the role of gas and Russian gas in Europe (Section 3.2.1), while Section 3.2.2 centres on Poland’s gas diversification options and achievements. Finally, conclusions are drawn in Section 4.
2. Theoretical framework
In order to assess energy policy decisions and achievements, comprehensive definitions of several energy policy-related concepts should be provided. For a net energy importer, the most important among these are security of supply and diversification. Security of supply is one aspect of energy security, while the other is security of demand, which net energy exporters aim to increase.
Security of supply has no uniform definition. There are different ways of approaching the term (Table 1). One can limit one’s understanding of the issue purely to traditional survival-based definitions, but special care should be shown when attempting to move the term security from a military context and apply it to non-military issues, particularly
to energy (Buzan et al., 1998).2 Another approach is applicable if security of supply is considered as a concept that has different dimensions. The simplest and oldest definitions are two-dimensional, referring to availability and price. These two dimensions can also be called the physical and the economic dimensions (Cherp et al., 2012: 330) or physical and price security (Wicks, 2009: 8). However, over time, many multidimensional definitions have emerged, reflecting the different interests and energy-related challenges in various time periods, but many dimensions can overlap in one way or another. Aside from the aforementioned, other possible definitions have also been proposed. For example, according to Cherp and Jewell (2011), security of supply has three perspectives – sovereignty, robustness and resilience.
Table 1. A compilation of different definitions of security of supply 1. Traditionalists’ survival-based definitions
– Buzan et al. (1998)
2. Dimensional classifications
– two-dimensional definitions: availability and price (cost)
– Manners (1964), IEA (1985), UNDP (2000), Yergin (2006, 2011) – three- and multidimensional definitions
– Elkind (2010): availability, reliability, affordability and environmental sustainability – APERC (2007): four ‘A’s: availability, accessibility, affordability and acceptability
– Sovacool and Mukherjee (2011): availability, affordability, technology development, sustainability and regulation
– Alhajji (2007): economic, environmental, social, foreign policy, technical and security dimensions – Wicks (2009): physical, price and geopolitical security
– Hippel et al. (2011): environment, technology, demand-side management, social-cultural factors and international relations or military risks
3. Other definitions
– Cherp and Jewell (2011): three perspectives: sovereignty, robustness and resilience
– Stirling (2007): system properties consisting of stability, durability, resilience and robustness Source: Weiner (2017: 4).
In our paper (Weiner, 2017), we argued that the conventional three-dimensional approach, encompassing availability, affordability and sustainability, was appropriate to consider security of supply. Here, the main focus is on primary energy fuels – coal, natural gas, renewables and nuclear fuel3 – in relation to electricity as a secondary energy source,4 but the three-dimensional approach is also applied, in part, to electricity
2 Cited by Yafimava (2012: 12).
3 Oil is not discussed here as it is principally a transportation fuel.
4 Heat is only partially covered here. However, regarding gas diversification, the whole domestic gas consumption is taken into consideration.
(i.e. in relation to specific primary energy).5 As mentioned, the great advantage of this simple method is that it allows cross-country comparison. However, Poland’s approach to energy policy is securitized. For one who looks at energy as a private good with strong public goods characteristics, energy is a matter of low politics. Nevertheless, for many states, such as Poland, energy policy is also a matter of high politics. Hence, some of its public goods characteristics are of a strategic nature (a strategic good) (Anderson et al., 2017b: 4). Poland’s attitude is no novelty. What is new is how the EU’s approach has changed. Due to the return of geopolitics in the 2000s and the 2010s, the EU has begun to implement policy answers aimed at making its regulatory state approach fit the current situation, in which other players are more mercantilist and consider energy both as a strategic good and a potential foreign policy tool. The European Commission responded to the Russian geopolitical challenge by treating Russia’s state-controlled gas giant Gazprom as a dominant market player and deploying its full regulatory toolbox, as well as by applying a more direct and interventionist use of the EU’s economic power (Anderson et al., 2017a: 14).
Geopolitical considerations are also related to the notion of the “energy/gas weapon/diplomacy”,6 which has been widely debated in literature. There are two main questions linked to the energy weapon. One aspect to consider is the precise meaning of the term, and the other is whether Russia really uses such methods. According to Smith Stegen (2011: 6506–6506), “energy weapon” refers to a situation in which resources are converted into real political power through the manipulation of supply and prices and then used to yield foreign policy gains (to influence policies, coerce political concessions or punish customers). Smith Stegen (2011: 6506) claims that four stages or conditions are necessary for the successful implementation of an energy weapon: (1) the state must consolidate the country’s energy resources; (2) the state must acquire control over transit routes; (3) the state must use the energy resources in an attempt to further its own political objectives; and (4) the dependent government must acquiesce to the
5 Thus, exports, imports, electricity transmission infrastructure, and so on, are not in the forefront of the issues we consider.
6 This is related to one of Cherp and Jewell’s (2011) three perspectives, i.e. sovereignty, even though this is a different approach. Cherp and Jewell suggest the following three perspectives on security of supply: the robustness of energy systems (sufficiency of resources, reliability of infrastructure and stable and affordable prices), their sovereignty (protection from potential threats from external agents, such as unfriendly political powers and overly powerful market agents) and their resilience (the ability to withstand diverse disruptions) (see Table 1).
threats, price hikes or cut-offs. Smith Stegen (2011: 6506) finds that Russia was more often unsuccessful than successful in implementing its energy weapon. Yafimava (2015:
3) defines the “gas weapon” as a reduction or cut-off of supplies in order to force compliance with political and strategic aims, and finds no evidence of Russia having used it in European countries, but acknowledges its application in Ukraine in the 1990s.
Grigas (2012: 33) clarifies this by stating that except for the 1993 incident with Estonia, an unsuccessful one-day gas cut aimed at changing Estonia’s citizenship policies, Russia has never engaged in a direct gas war in non-CIS Europe.7 Smith Stegen (2011: 6509) also mentions the Baltic States as examples in non-CIS Europe – Estonia is again cited.
Nonetheless, the supporters of the political argument can point to Putin’s February 2003 speech at the tenth anniversary of the founding of Gazprom, during which he stated that Gazprom was a powerful political and economic lever of influence over the rest of the world (Kupchinsky, 2004).
Researchers with the Oxford Institute for Energy Studies have consistently and convincingly argued that Gazprom’s commercial interests prevail over political considerations. Pirani (2012: 14) states that Russia’s activities on export markets were directed mainly at strengthening Gazprom’s commercial position, and this was very rarely trumped by political considerations. Stern (2015: 11) uses the concept of political pricing for Gazprom’s decisions, supported or ordered by the Russian government, to tie gas prices to decisions on gas infrastructure or investments, or to other non-gas bilateral issues between Russia and the given country. Stern (2015: 11) argues that the European Commission’s Directorate-General for Competition (DG COMP) confirmed the first allegation in relation to Bulgaria and Poland (see in Section 3.2.2 below). As to the second allegation, we find that the practice of package deals can also be maintained by the consumer nation. For example, the Hungarian government (2010–) has tended to combine very different issues (the long-term gas supply contract, the Paks II project, the Budapest subway, and so on) into a single deal (Menedzsment Fórum, 2010; 24.hu, 2010;
Grib and Lukyanov, 2010). Even so, Stern (2015: 11) questions allegations over Gazprom’s political gas pricing in non-CIS Europe, claiming that Russia aims at extracting maximum revenues (referring to the practice of discriminating monopoly
7 The 12 non-Baltic former Soviet Republics still tend to be referred to as the CIS (Commonwealth of Independent States) countries, though, currently, it is a regional organisation consisting of only ten post- Soviet republics (Georgia and Ukraine are not members of the CIS).
pricing) rather than political concessions. However, Stern (2015: 11) mentions a recent exception, which occurred between the summer of 2014 and March 2015, when Gazprom intentionally failed to meet daily gas volumes as requested by many European buyers. This was supposedly at the request of the Russian president with the commercial intentions of curtailing reverse flow gas to Ukraine from Europe and thus forcing Ukraine to buy more Russian gas. It might also have been a means of providing support for falling European hub prices. Yafimava (2015: 3) also advocates the commercial argument, since “much of Gazprom’s behaviour towards all European countries could be explained by its desire to extract maximum revenues rather than political concessions”.
The problem is that once a sector is securitized, this legitimizes extraordinary steps to solve a policy problem and prevents that sector from becoming subject to regular political or academic debates (Boersma and Goldthau, 2017: 111). The Polish energy landscape is determined by two main factors. The first is Poland’s need to reduce external dependence, while the second is to preserve the role of coal. The latter is also partly related to the first factor, in addition to other domestic economic, social and political aspects. Besides coal, the most sensitive issue regarding the Polish supply security is that of gas.8 In contrast to coal, Poland is heavily dependent on gas imports.
Poland’s focus on self-sufficiency and independence from foreign influence is not a reaction limited to Russia alone, but also includes Germany (Heinrich et al., 2017: 6).
Dependence on Russia is linked mainly to gas and oil imports,9 while in the case of Germany this dependence is seen as related to the country’s renewable technologies.
Heinrich et al. (2016: 2) argue that renewables are viewed by many as not only potentially risky for security of supply because they are considered expensive, unreliable and volatile, but they can also perpetuate Poland’s energy dependence on foreign countries. There is concern that Germany is interested in spreading its transition by promoting its own industries and in further enhancing its technological dominance.
Naturally, Poland considers Russia and its gas as the main threat to Poland’s security of supply. Nonetheless, the trans-Baltic Sea Nord Stream gas pipeline brought together Germany and Russia within the framework of a project that poses a threat to Poland. It
8 The importance of the gas sector is also underlined by the Polish Policy for the Natural Gas Industry, adopted in March 2007, though this is a short and quite unsophisticated document (Ministry of Economy, 2007).
9 Russian coal imports are not regarded as a threat (see below in section dealing with coal).
should be emphasized that Poland has palpable historical grievances towards both countries. For this reason, Poland is particularly sensitive to any such arrangements between its two neighbours. Historical relations with Russia have a decisive role in Polish energy policies. In the EU, Poland is considered to be part of the group of Russian sceptics, wishing to see the EU use mercantilist tools within the Energy Union to strengthen its position vis-á-vis Russia (Nosko and Mišík, 2017).
Politicians and industry players in Europe approach gas security differently. Stern highlights that “when politicians and media commentators speak about gas security problems, they only talk about Russia and nothing else”, while gas industry people speak about “the decline of production in the Netherlands, the UK and, further in the future, Norway” (Simon, 2018). Poland is sticking to the “dependence on Russian imports equals gas insecurity” formula, which would be in line with the 1970s definition of supply security. The Baltic states approach gas security similarly, while other CEE countries are less politically motivated (Jonathan Stern, email communication, 7, 9 February 2018).
Energy independence can basically be interpreted in two ways. According to the hard definition, energy or gas independence refers to independence from energy or gas imports (i.e. self-sufficiency) (Weiner, 2016), while the soft definition suggests that the aim is to have import source diversity, in order to reduce reliance on unstable and unfriendly nations (Branko, 2012; Stelzer, 2009). Seemingly, Poland understands independence in a very strict sense, but, as Bazilian et al. (2013) conclude, this aim can promote suboptimal policy choices. However, full independence is extremely difficult to achieve.
Since the aim to reduce external dependence as much as possible is related to the fact that the energy policy agenda is securitized in Poland, a politically-motivated approach should also be included in the dimensional assessment of security of supply. Existing literature provides three options of coping with this problem: (1) these political considerations should represent another distinct (fourth) dimension of security of supply – in addition to availability, affordability and sustainability; or (2) these aspects could be included under the dimension of availability; or (3) an attempt should be made not to mix security of supply with geopolitical arguments, thus to treat geopolitical threats as outside the scope of security of supply. As presented in Table 1, there are
several examples of the treatment of a politically-motivated approach as a distinct dimension of security of supply, such as Alhajii’s (2007) six dimensions (economic, environmental, social, foreign policy, technical and security), Wicks’ (2009: 8) three- dimensional approach (physical, price and geopolitical security), Hippel et al.’s (2011) comprehensive concept of supply security (environment, technology, demand-side management, social-cultural factors and international relations or military risks) and, for instance, the US President’s All-of-the-Above Energy Strategy (energy supply availability, reliability, affordability and geopolitical considerations) (EOP, 2014: 20).
Conversely, APERC’s (2007) four ‘A’s of security of supply include geopolitical aspects under the dimension of accessibility. However, Hughes (2012: 229) claims that the omission of accessibility could be justified, since accessibility can be considered as part of availability: if access to an energy flow is problematic, this is reflected in its availability. In contrast, regarding gas, Dickel et al. (2014) distinguish gas security from among the various geopolitical threats to national security when discussing European dependence on Russian gas, and suggest that countries with strong geopolitical fears need to either terminate or not renew their long-term contracts with Gazprom.
However, they warn this would require taking many additional measures, including investments in liquefied natural gas (LNG) import terminals, pipeline connections, alternative energy sources, energy conservation and efficiency. Yafimava (2015) also differentiates between commercial and geopolitical points of view when analysing European dependence on Russian gas.
In opposition to the above-discussed three options of coping with the analysed issues, we claim that the politically-motivated approach is not a separate dimension, or part of a dimension, or outside of the three dimensions, but rather an influencing factor. We argue that decisions on security of supply and diversification are the consequences of choices made from among different security of supply dimensions. These choices should be made on the basis of such influencing factors as the following: (1) the energy perspective (the energy market supply/demand and price conditions); (2) the institutional context (the role of the EU); (3) the government’s approach towards dependence and its perceptions and expectations of threat, as well as its relations with Russia. Naturally, all these factors are dynamic and change over time. The politically- motivated approach equals our third category. As Palonkorpi (n.d.) claims, perceptions
are important when evaluating dependence. In the case of Poland, these perceptions have a major influence on choices made from among different security of supply dimensions.
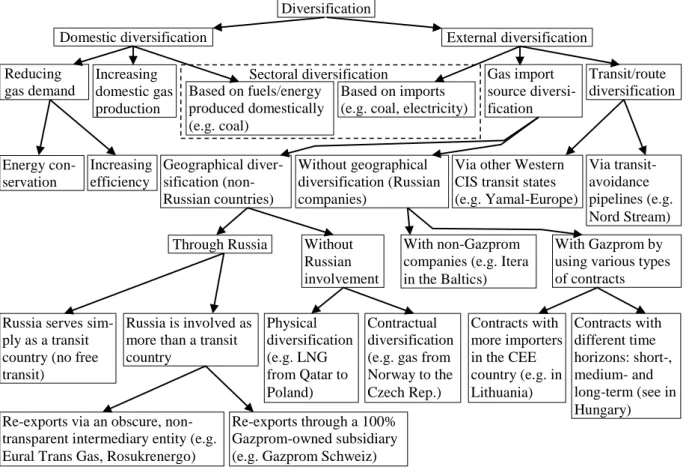
Finally, besides security of supply, another important concept is diversification, which is a means of enhancing security of supply. We have developed a scheme of different CEE diversification options for Russian gas imports (Figure 1). Basically, diversification can be domestic or external. Possible domestic diversification options include reduced gas consumption, increased internal gas production and sectoral diversification on the basis of fuels or energy produced domestically. External diversification comprises gas import source diversification, transit or route diversification, and sectoral diversification based on imported fuels or energy. The aforementioned diversification options can be further broken down.
Figure 1. Central and East European gas diversification scheme
Source: Weiner (2017: 6), partly based on Balmaceda (2008, 2013) and Stern (2002).
Diversification
Domestic diversification External diversification
Increasing domestic gas production
Based on fuels/energy produced domestically (e.g. coal)
Sectoral diversification
Based on imports (e.g. coal, electricity)
Energy con- servation
Increasing efficiency
Gas import source diversi- fication
Transit/route diversification
Geographical diver- sification (non- Russian countries)
Without geographical diversification (Russian companies)
With non-Gazprom companies (e.g. Itera in the Baltics)
With Gazprom by using various types of contracts Through Russia Without
Russian involvement
Contractual diversification (e.g. gas from Norway to the Czech Rep.) Physical
diversification (e.g. LNG from Qatar to Poland) Russia serves sim-
ply as a transit country (no free transit)
Russia is involved as more than a transit country
Re-exports via an obscure, non- transparent intermediary entity (e.g.
Eural Trans Gas, Rosukrenergo)
Re-exports through a 100%
Gazprom-owned subsidiary (e.g. Gazprom Schweiz)
Contracts with more importers in the CEE country (e.g. in Lithuania)
Contracts with different time horizons: short-, medium- and long-term (see in Hungary)
Via transit- avoidance pipelines (e.g.
Nord Stream) Via other Western
CIS transit states (e.g. Yamal-Europe) Reducing
gas demand
When evaluating stationary fuel supply and gas diversification, we review energy policies and related national and EU documents, as well as statements made by governments and other stakeholders on security of supply (threats). We also analyse stated aspirations and progress made towards enhancing stationary fuel supply and gas diversification over the past ten years, and investigate the reasons behind the results.
3. Case studies
3.1. Case study 1: security of supply in Poland
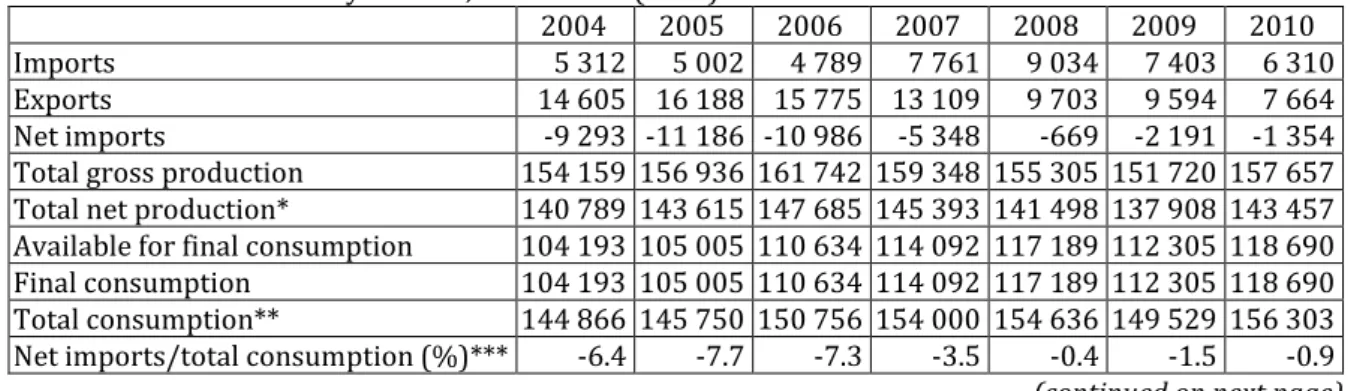
Since 1990, final electricity consumption and total gross electricity production in Poland has followed an upward trend with some slumps, while net heat production has shown a declining trajectory also with some fluctuation (Eurostat, 2018c, 2018d). In 2016, electricity production reached 166.6 TWh, while domestic consumption totalled 168.6 TWh. Poland used to be a net electricity exporter, but, for the first time in 2014, and then in 2016 (but not in 2015), it imported more electricity than it exported.10 Net imports were 2 TWh (Table 2) (Eurostat, 2018c).11
Table 2. Poland’s electricity balance, 2004–2016 (GWh)
2004 2005 2006 2007 2008 2009 2010
Imports 5 312 5 002 4 789 7 761 9 034 7 403 6 310
Exports 14 605 16 188 15 775 13 109 9 703 9 594 7 664
Net imports -9 293 -11 186 -10 986 -5 348 -669 -2 191 -1 354 Total gross production 154 159 156 936 161 742 159 348 155 305 151 720 157 657 Total net production* 140 789 143 615 147 685 145 393 141 498 137 908 143 457 Available for final consumption 104 193 105 005 110 634 114 092 117 189 112 305 118 690 Final consumption 104 193 105 005 110 634 114 092 117 189 112 305 118 690 Total consumption** 144 866 145 750 150 756 154 000 154 636 149 529 156 303 Net imports/total consumption (%)*** -6.4 -7.7 -7.3 -3.5 -0.4 -1.5 -0.9 (continued on next page)
10 In 2016, Poland’s electricity import partners were as follows: Germany – 8 754 GWh, Sweden – 2 764 GWh, Lithuania – 1 034 GWh, Ukraine – 957 GWh, the Czech Republic – 505 GWh, and Slovakia – 3 GWh.
On the other hand, exports came from the following countries: the Czech Republic – 7 193 GWh, Slovakia – 4 187 GWh, Lithuania – 440 GWh, Sweden – 176 GWh, and Germany – 15 GWh (Ministry of Energy, 2017b:
37).
11 We use our own calculations based on Eurostat data. The Polish Energy Regulatory Office (URE) claims 162.6 TWh for electricity production and 164.6 TWh for domestic consumption (URE, 2017: 11).
Table (continued)
2011 2012 2013 2014 2015 2016
Imports 6 780 9 803 7 801 13 508 14 459 14 017
Exports 12 022 12 643 12 322 11 342 14 793 12 018
Net imports -5 242 -2 840 -4 521 2 166 -334 1 999
Total gross production 163 548 162 139 164 580 159 059 164 944 166 635 Total net production* 148 913 147 649 150 079 145 214 150 695 152 003 Available for final consumption 121 492 122 169 123 557 125 347 127 819 132 839 Final consumption 121 492 122 169 123 557 125 347 127 819 132 839 Total consumption** 158 306 159 299 160 059 161 225 164 610 168 634 Net imports/total consumption (%)*** -3.3 -1.8 -2.8 1.3 -0.2 1.2
* Total net production = total gross production – own consumption of power plants.
** Total consumption = net imports + total gross production.
*** Negative numbers indicate that Poland was a net exporter during the indicated years.
Source: Eurostat (2018c).
Box 1. The list of Poland’s energy policies since 1990
Since the change of regime, Poland has had five energy policies. The first one was accepted in 1990 (for the period up to 2010), followed by the second one in 1995 (also to 2010). The third energy policy was approved in 2000 (to 2020). This was evaluated and amended in 2002. In 2005, the fourth energy policy (to 2025) was approved. The final, fifth one (to 2030) was approved in 2009. Currently, a new energy policy, the sixth one (to 2050) is being prepared.
The first version of the draft energy policy was published in August 2014, while the last version dates to August 2015.12 However, in October 2015, the opposition Law and Justice (PiS) party won the parliamentary elections in Poland, removing the ruling Civic Platform (PO) from power. The document was subsequently withdrawn and is being revised by the Ministry of Energy (IEA, 2017a: 24). There will probably be significant changes in the new energy policy that would otherwise have already been published (Ernest Wyciszkiewicz, email communication, 6 June 2018). As long as the new energy policy for the period up to 2050 is an ongoing project, the 2009 Polish Energy Policy until 2030 and the 2014 Strategy for Energy Security and Environment remain the two key strategic documents outlining Poland’s policy for the energy sector.13
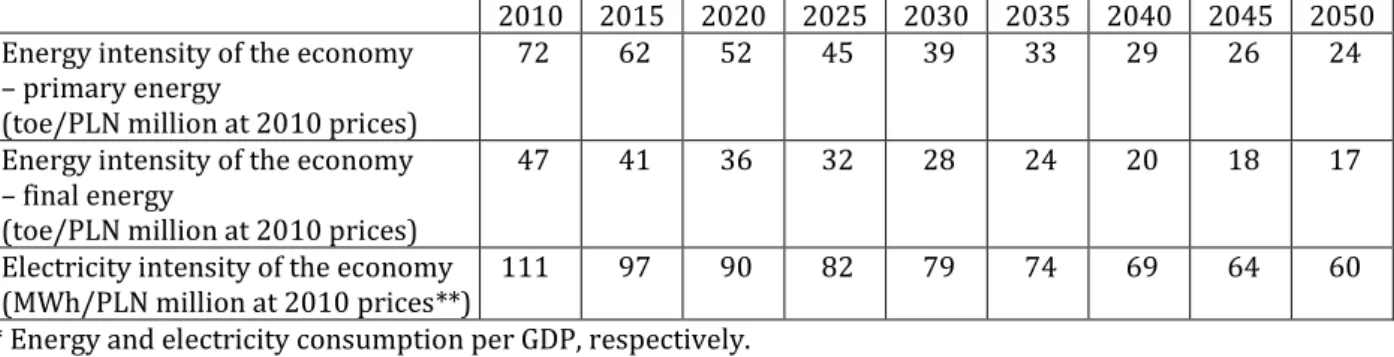
Electricity consumption continues to rise in Poland. The Polish Energy Policy until 203014 predicted net electricity production (Table A5 in the Appendix), final electricity demand (Tables A1 and A4 in the Appendix), and final demand for network heat (Table A1 in the Appendix) to grow by 37, 55 and 50 per cent from 2006 to 2030, respectively (Ministry of Economy, 2009b: 11, 15). The draft Energy Policy until 2050 consists of several documents. One of them includes a variety of forecasts prepared by the Polish
12 The main forecasts for the Energy Policy until 2030 (Tables A1–A6) and the draft Energy Policy until 2050 (Tables A7–A16) are presented in the Appendix.
13 The 2014 Strategy for Energy Security and Environment identifies key reforms and necessary steps for cleaner energy and for safeguarding security of supply up to 2020 (Ministry of Economy/Ministry of Environment, 2014; IEA, 2017a: 24). In this paper, we focus on the Energy Policy until 2030 and the draft Energy Policy until 2050.
14 A list of Polish energy policies is presented in Box 1.
National Energy Conservation Agency S.A. (Krajowa Agencja Poszanowania Energii S.A., KAPE), the Polish Energy Market Agency S.A. (Agencja Rynku Energii S.A., ARE) and the European Commission (Ministry of Economy, 2015c). Although the new draft Energy Policy is based on or follows none of these documents, the Ministry of Energy considers the forecasts made by the Polish National Energy Conservation Agency to be the most reliable (the Polish Ministry of Energy, email communication, 22 June 2018).15
At end-2016, the installed electricity capacity in Poland amounted to 41.4 GW. The power sector has seen a substantial lack of investment (Berkenkamp et al., 2016: 1).
Almost 59 per cent of the turbines are over 30 years old. Another ca. 16 per cent are more than 20 but less than 30 years old, while only the remaining 25 per cent are younger. The situation of the boilers in Poland is even more alarming (Wierzbowski et al., 2017: 51; Ministry of Economy, 2015b: 16). Therefore, since the estimated lifespan of such coal blocks is between 40 and 45 years, 6.4 GW of capacity will be lost by 2020, and the construction of new conventional generation with a capacity of at least 10-12 GW will be required by 2030 for the renewal of existing assets (Ministry of Economy, 2015b:
16). Wierzbowski et al. (2017: 51) claim that by 2050, almost half of Poland’s installed capacity must be replaced. About 5 GW of power capacity must be commissioned by 2020, a further 5 GW by 2030 and 9 GW by 2040.
In this situation, it is predicted that issues with power shortages will begin to occur.
In August 2015, the heat wave, lack of wind (needed for wind farms) and lack of rain (needed to cool coal-fired power plants) forced Poland to cut the electricity supply to industries, while electricity exports were also limited (Reuters, 2015). It was impossible to start up the cold reserve (Wierzbowski et al., 2017: 54).
Another problem is related to the weak domestic electricity grid and interconnections, as well as the phenomenon of uncontrolled/unscheduled loop flows from Germany to Poland. The transmission network is old and the grid’s density is not even (Wierzbowski et al., 2017: 55). During the August 2015 crisis, the Polish state- owned grid operator PSE claimed that the loop flow phenomenon had blocked imports from neighbouring countries (Schlandt, 2015).
15 The above forecasts are presented in the Appendix – for electricity production in Tables A9, A13 and A16, for heat production in Table A10, for electricity demand in Tables A11 and A14, and for heat demand in Table A12.
The Polish state maintains major shares in the four biggest energy companies, three of them – PGE Polska Grupa Energetyczna S.A., Enea S.A. and Energa S.A. – are majority state-owned, while Tauron Polska Energia S.A. has minority state ownership. These four dominate the electricity market (Jankowska and Ancygier, 2017: 187). In Poland, energy policy has been used to strengthen the dominance of state-owned energy groups to the detriment of individuals and local communities (Szulecki et al., 2015: 16).
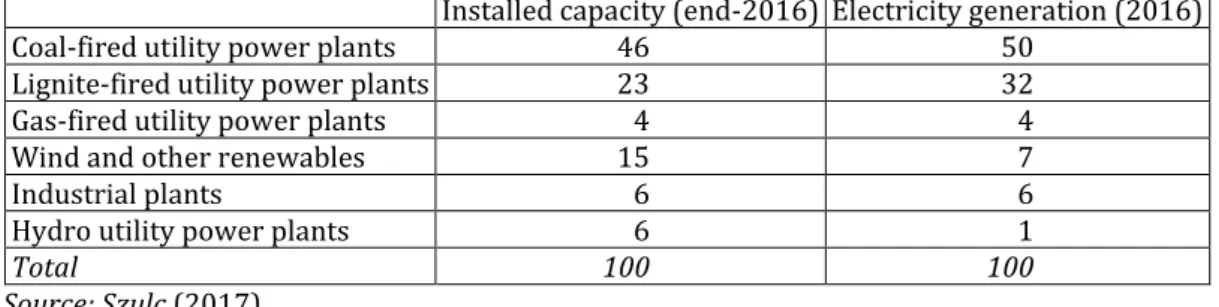
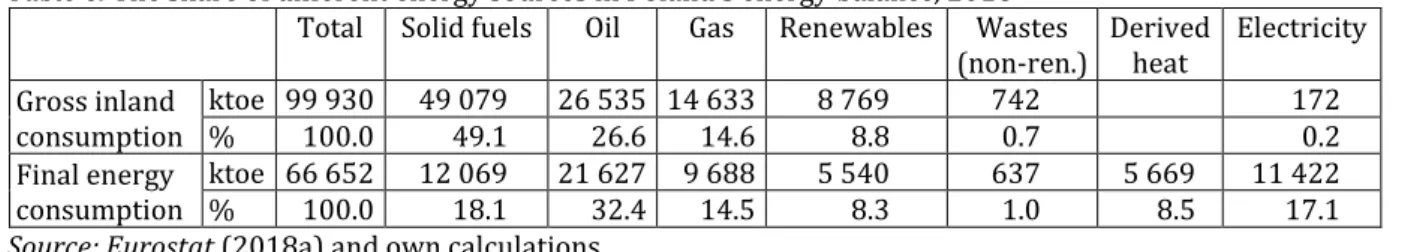
At the time of the change of regime, Poland was almost completely a coal land (Szulecki, 2017: 7). More than two and a half decades later, at end-2016, hard coal still accounted for 46 per cent of installed electricity generation capacity, while lignite provided a further 23 per cent (Table 3) (Szulc, 2017). In 2016, solid fuels were responsible for 78.2 per cent of electricity generation, while 14.0 per cent of electricity generation was from renewables. The share of natural gas stood at only 4.7 per cent in 2016, compared to 0.9 per cent in 2001 and 0.1 per cent in the early 1990s (Table 4) (Eurostat, 2018c). Similarly, in 2016, solid fuels provided more than 80 per cent of derived heat production.16 Natural gas had only about 7 per cent, while less than 5 per cent of the generation of heat was from renewables (Table 5) (Eurostat, 2018d). To place this data in a wider context, in 2016, solid fuels had a 49.1 per cent share in gross inland consumption, and an 18.1 per cent share in final energy consumption (Table 6) (Eurostat, 2018a). However, this heavy reliance on domestic coal is reflected in low energy (import) dependence. In 2015, with a 29.3 per cent energy dependency ratio, Poland was the fourth least dependent on energy imports behind Estonia (7.4%), Denmark (13.1%) and Romania (17.1%), while the EU stood at 54.1 per cent (Eurostat, 2017).
16 The structure of space heating in residential buildings is as follows (2015 data): district heating – 41 per cent, solid fuel dual-purpose boilers – 23 per cent, solid fuel single-purpose boilers – 14 per cent, solid fuel stoves in rooms – 6 per cent, solid fuel fireplaces – 4 per cent, natural gas dual-purpose boilers – 7 per cent, natural gas single-purpose boilers – 2 per cent, fixed and portable electric radiators and electric underfloor heating – 2 per cent, other techniques – 1 per cent. The different types of warm water production in residential buildings include the following: district heating – 30 per cent, electric boiler or heater – 22 per cent, bathroom gas heater – 18 per cent, natural gas dual-purpose boiler – 8 per cent, solid fuel dual-purpose boiler or water heater – 18 per cent, other techniques – 1 per cent, no running warm water – 3 per cent (Ministry of Energy, 2017a).
Table 3. The share of different power plants in installed electricity generation capacity and electricity generation in Poland, 2016 (%)
Installed capacity (end-2016) Electricity generation (2016)
Coal-fired utility power plants 46 50
Lignite-fired utility power plants 23 32
Gas-fired utility power plants 4 4
Wind and other renewables 15 7
Industrial plants 6 6
Hydro utility power plants 6 1
Total 100 100
Source: Szulc (2017).
Table 4. Gross electricity production in Poland, by fuel, 2004–2016 (%)
2004 2005 2006 2007 2008 2009 2010 2011 2012 2013 2014 2015 2016 Solid fuels 91.5 90.4 90.9 90.4 89.4 87.9 86.6 85.5 83.0 83.7 81.4 79.1 78.2 Gases 3.2 4.2 3.8 3.9 4.1 4.1 4.2 4.7 5.0 4.4 4.6 5.4 6.3 Natural gas 2.1 3.3 2.8 2.8 3.0 3.2 3.0 3.6 3.9 3.2 3.3 3.9 4.7 Derived gases 1.2 0.9 1.0 1.1 1.1 1.0 1.2 1.1 1.1 1.2 1.3 1.5 1.6 Petroleum products 1.9 1.8 1.8 1.8 1.8 1.8 1.8 1.5 1.3 1.1 1.0 1.3 1.4 Renewables 3.1 3.5 3.3 3.8 4.6 6.1 7.3 8.3 10.7 10.7 12.8 14.1 14.0 Biomass and
renewable waste 3.1 3.5 3.3 3.8 4.6 6.1 7.3 8.3 10.7 10.7 12.8 14.1 14.0 Hydro 2.4 2.4 1.9 1.8 1.8 2.0 2.2 1.7 1.5 1.8 1.7 1.5 1.6 Wind 0.1 0.1 0.2 0.3 0.5 0.7 1.1 2.0 2.9 3.6 4.8 6.6 7.6
Solar PV 0.0 0.0 0.0 0.0 0.1
Renewable
municipal waste 0.0
Solid biofuels
excluding charcoal 0.6 0.9 1.1 1.5 2.2 3.2 3.7 4.4 5.9 4.8 5.8 5.5 4.1 Biogas 0.1 0.1 0.1 0.1 0.2 0.2 0.3 0.3 0.3 0.4 0.5 0.5 0.6 Other liquid
biofuels 0.0 0.0 0.0 0.0 0.0 0.0
Others 0.2 0.2 0.2 0.2 0.1 0.0 0.1 0.1 0.1 0.1 0.1 0.1 0.2 Non-renewable
waste 0.0 0.0 0.0 0.0 0.0 0.0 0.0 0.0 0.0 0.0 0.0 0.0 0.1 Heat from chemical
sources 0.0 0.0 0.0 0.0 0.0 0.0 0.0 0.1 0.0 0.1 0.1 0.1 0.0 Other sources 0.1 0.2 0.2 0.1 0.0 0.0 0.0 0.0 0.0 0.0 0.0 0.0 0.0 Total 100.0 100.0 100.0 100.0 100.0 100.0 100.0 100.0 100.0 100.0 100.0 100.0 100.0 Solid fuels: hard coal, lignite and derivatives.
Derived gases: coke oven gas, blast furnace gas and other recovered gases.
Non-renewable waste: industrial and municipal waste.
Note: Empty cells show zero values.
Source: Own calculations based on Eurostat (2018c).
Table 5. Derived heat production in Poland, by fuel, 2004–2016 (%)
2004 2005 2006 2007 2008 2009 2010 2011 2012 2013 2014 2015 2016 Solid fuels 89.3 89.1 88.7 89.0 87.0 86.2 85.4 83.8 82.2 84.3 84.0 81.3 82.4 Gases 7.7 7.8 8.3 7.5 9.0 8.5 9.2 10.0 9.9 8.8 9.0 12.2 10.9 Natural gas 6.2 6.2 5.7 5.6 6.1 6.2 6.2 6.5 6.7 6.0 6.0 7.2 7.2 Derived gases 1.5 1.6 2.6 1.9 2.9 2.3 3.0 3.5 3.1 2.8 3.1 5.0 3.7 Petroleum products 2.0 2.0 2.0 1.9 2.0 1.9 2.0 1.3 1.4 1.1 1.2 1.2 1.2 Renewables 0.7 0.8 0.8 1.2 1.6 3.2 3.2 4.5 6.2 5.3 5.2 4.6 4.8 Biomass and
renewable waste 0.7 0.8 0.8 1.2 1.6 3.2 3.2 4.5 6.2 5.3 5.2 4.6 4.8 Solid biofuels 0.6 0.7 0.8 1.2 1.6 3.2 3.1 4.5 6.1 5.2 5.0 4.4 4.6 Biogas 0.0 0.0 0.0 0.0 0.0 0.0 0.0 0.0 0.1 0.1 0.1 0.2 0.2 Renewable
municipal waste 0.0 0.0 0.0
Liquid biofuels 0.0 0.0 0.0 0.0
Heat pumps 0.0 0.0 0.0 0.0 0.0 0.0 0.0 0.0
Others 0.3 0.3 0.3 0.4 0.4 0.2 0.3 0.5 0.4 0.5 0.6 0.7 0.7 Non-renewable
waste 0.0 0.1 0.0 0.0 0.1 0.1 0.1 0.1 0.1 0.1 0.1 0.3 0.5 Heat from chemical
sources 0.2 0.2 0.2 0.2 0.2 0.1 0.2 0.3 0.2 0.3 0.4 0.4 0.2 Other sources 0.1 0.1 0.1 0.1 0.1 0.0 0.0 0.0 0.1 0.0 0.0 0.0 0.0 Total 100.0 100.0 100.0 100.0 100.0 100.0 100.0 100.0 100.0 100.0 100.0 100.0 100.0 Solid fuels: hard coal, lignite and derivatives.
Derived gases: coke oven gas, blast furnace gas and gas works gas.
Non-renewable waste: industrial and municipal waste.
Note: Empty cells show zero values.
Source: Own calculations based on Eurostat (2018d).
Table 6. The share of different energy sources in Poland’s energy balance, 2016 Total Solid fuels Oil Gas Renewables Wastes
(non-ren.) Derived
heat Electricity Gross inland
consumption ktoe 99 930 49 079 26 535 14 633 8 769 742 172
% 100.0 49.1 26.6 14.6 8.8 0.7 0.2
Final energy
consumption ktoe 66 652 12 069 21 627 9 688 5 540 637 5 669 11 422
% 100.0 18.1 32.4 14.5 8.3 1.0 8.5 17.1
Source: Eurostat (2018a) and own calculations.
Table A5 in the Appendix presents forecasts from the Polish Energy Policy until 2030 for net electricity production in Poland by fuel as follows:
– The role of hard coal will fall from 58.3 per cent in 2006 to 32.4 per cent in 2025, but will again increase to 35.6 per cent by 2030.
– The share of lignite will decline from 33.8 per cent in 2006 to 21.0 per cent in 2030.
– In contrast, the share of natural gas will rise from 3.1 per cent in 2006 to a still very low 6.6 per cent in 2030.
– Also, the role of renewables will grow from 2.6 per cent in 2006 to 20.2 per cent by 2025, but is expected to decrease to 18.8 per cent by 2030.
– Finally, nuclear will enter the electricity generation mix and reach 15.7 per cent by 2030.
The August 2015 Energy Policy presented three scenarios for Poland’s energy mix:
the sustainable or balanced scenario and two alternative scenarios (a nuclear scenario and a gas + renewables scenario). According to the sustainable scenario, coal will continue to be dominant in the energy balance, but with a decreasing share, while the share of other individual fuels/energy will be even and amount to around 15-20 per cent per fuel type, including an approximately 12 per cent share of nuclear energy through the construction of two nuclear power plants with a total capacity of 6 GW.
In contrast, the nuclear scenario is characterized by a 45-60 per cent share of nuclear energy in the energy balance, while other fuels/energy will provide roughly equal shares: hard coal and lignite – 10-15 per cent, crude oil – 10-15 per cent, natural gas – 10-15 per cent, and renewables – approximately 15 per cent.
The gas + renewables scenario is based on the assumption of large-scale domestic gas production from unconventional reservoirs, as well as the development of technologies for renewable energy production and energy storage. This scenario results from the fact that when the draft energy policy was written in 2014, there were still significant hopes for shale gas (Ernest Wyciszkiewicz, email communication, 6 June 2018). The scenario assumes that the share of natural gas and renewables in the energy balance will reach about 50-55 per cent, with hard coal and lignite – approximately 30 per cent, and crude oil – 15-20 per cent. The Energy Policy states that the “gas scenario”17 anticipates the share of renewables to be at a minimum of 20 per cent and of nuclear at approximately 12 per cent.18 Under the gas + renewables scenario, the use of natural gas in the power industry would increase from around 3.5 per cent in 2013 to 20-30 per cent in 2050.
The draft energy policy argues that gas and renewables complement each other nicely
17 This sentence in the Policy is confusing, because it uses the wording “gas scenario” and not
“gas + renewables scenario”.
18 In the first version of the draft Energy Policy, the gas + renewables scenario assumed the use of renewables to amount to at least 20 per cent and nuclear sources to reach a level of approximately 10 per cent (Ministry of Economy, 2014c: 39).
and gas would allow for flexible balancing.19 A significant increase in the use of gas in road transport is also expected (Ministry of Economy, 2015b: 40–46). This scenario, however, would require the further development of gas transportation infrastructure and storage. According to the draft Energy Policy, this would also signify searching for new gas suppliers as gas consumption would drastically increase (Wierzbowski et al., 2017: 67–68).
Coal. The coal industry has long established itself as a strategic element of the Polish industry and economy, leading to a path-dependency in energy policy that continuously reinforces the status quo aiming to maintain a conventional system based on fossil fuels, centralized production facilities and non-flexible consumption patterns (Jankowska and Ancygier, 2017: 186–187).
It is necessary to make a differentiation between hard coal and lignite.20 Poland is the tenth largest hard coal producer in the world and the largest in Europe. The restructuring of hard coal mining in Poland started in 1990, but it has not been completed so far (Kamola-Cieślik, 2017). Meanwhile, hard coal production decreased from 151.3 million tonnes (mt) in 1990 to 66.5 mt in 2016. In the same period, the number of employees dropped from 416 thousand to about 85 thousand (PSG, 2017e), though hard coal mining is still indirectly responsible for an additional 300 thousand jobs (Adamczewski, 2015). In 2016, hard coal consumption amounted to 74.2 mt (PSG, 2017f), while 8.3 mt of hard coal was imported, and exports stood at 9.1 mt. Importing hard coal to Poland is a relatively new phenomenon. For many years, Poland imported only those types of coal that it was not possible to obtain in the country (especially low phosphorus coking coal). It was only at the beginning of the 2000s that Poland started to import thermal (steam) coal. In 2008, for the first time, Poland imported more hard coal than it exported. Between 2008 and 2016, exports were higher than imports only in 2013, 2015 and 2016 (PSG, 2017b). The largest import partner is Russia (Energetyka24, 2017; Herold et al., 2017: 1). Thus, increasing coal imports could lead to higher Russian coal dependence, but this could be perceived differently than gas, since Russian coal imports can be replaced in their entirety in the event of a conflict (Baca-Pogorzelska,
19 As Stern (2017) notes, new coal stations are also able to provide backup electricity for renewables.
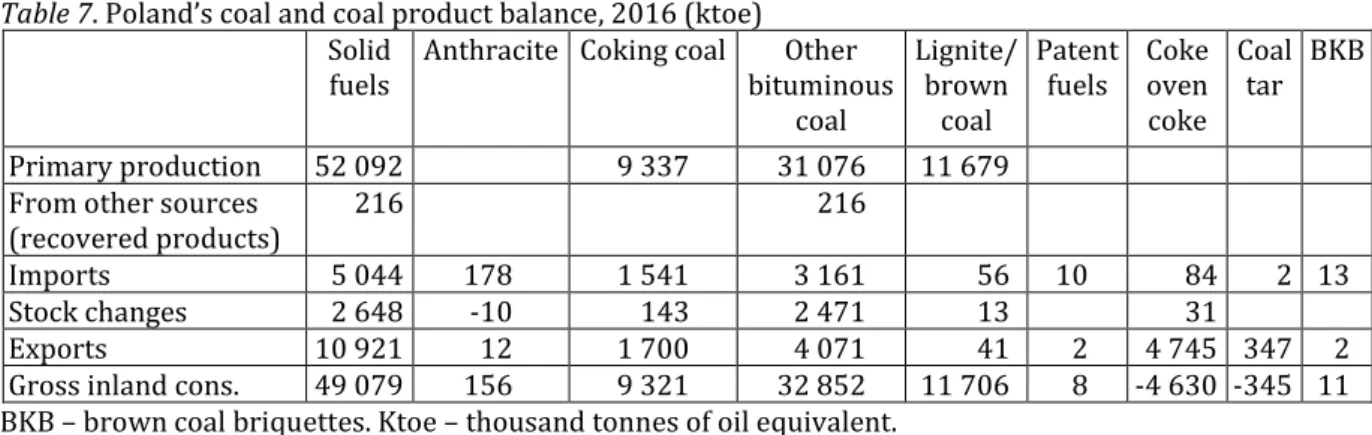
20 For a detailed coal and coal product balance, see Table 7.
2018). Nonetheless, recently concern has been voiced over Poland’s increasing amount of (Russian) coal imports, and the Polish government plans to introduce import limits, despite the lack of sufficient domestic production. The aim of limiting imports is also included in the Programme for the hard coal mining sector in Poland, adopted in January 2018. In addition, illegal anthracite coal imports coming indirectly from Donbas have become an issue of concern (TVN24 BiS, 2018; Łazarczyk, 2018; Miłosława Stępień, email communication, 14 August 2018).
Table 7. Poland’s coal and coal product balance, 2016 (ktoe) Solid
fuels Anthracite Coking coal Other bituminous
coal
Lignite/
brown coal
Patent fuels Coke
oven coke
Coal tar BKB
Primary production 52 092 9 337 31 076 11 679
From other sources
(recovered products) 216 216
Imports 5 044 178 1 541 3 161 56 10 84 2 13
Stock changes 2 648 -10 143 2 471 13 31
Exports 10 921 12 1 700 4 071 41 2 4 745 347 2
Gross inland cons. 49 079 156 9 321 32 852 11 706 8 -4 630 -345 11 BKB – brown coal briquettes. Ktoe – thousand tonnes of oil equivalent.
Source: Eurostat (2018a).
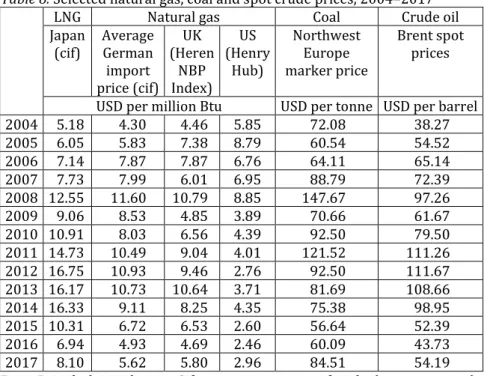
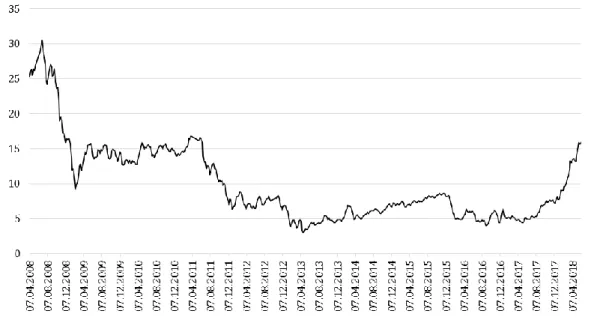
Some domestic economic, social and political aspects of hard coal mining influencing the situation include the 85 thousand jobs, the strong unions and high state ownership level (Schwartzkopff and Schulz, 2017: 2, 5; Wierzbowski et al., 2017: 5–7). Among this sector’s major problems, we should count the high costs of mining, high social costs, low labour productivity, geological factors and issues with the quality of the product as compared to imported hard coal (Kamola-Cieślik, 2017: 254). Hard coal industry relies heavily on subsidies. Low international coal prices compared to domestic production costs have resulted in financial problems for hard coal mining. However, since mid- 2016, coal prices have been growing, though with high fluctuations. These increases follow a significant decline between 2011 and 2015 (Trading Economics, 2018). Also, as compared to gas, coal was cheap until 2016, but this is no longer true if it is bought in the international market (Jonathan Stern, email communication, 7 February 2018) (Table 8) (also, see Section 3.2.1). Under these circumstances, Poland’s Law and Justice government pledged to save and defend the coal industry, as well as modernising existing coal power plants and building new plants that would increase coal lock-in
(Wood et al., 2017: 3; Wierzbowski et al., 2017: 6.). In contrast, in 2017, a fundamental change was seen in the government’s rhetoric when the Minister of Energy at the time said that a particular project would be the last coal investment (Ciepiela, 2017; Reuters, 2017a). Nonetheless, presented as part of the draft Energy Policy until 2050, the 2013 forecasts of the Polish National Energy Conservation Agency suggest that despite some decrease in the share of hard coal in heat production (Table A10 in the Appendix), its role will remain extremely high, while its declining share in electricity generation will also continue to be untenably high (Table A9 in the Appendix).
Table 8. Selected natural gas, coal and spot crude prices, 2004–2017
LNG Natural gas Coal Crude oil
Japan
(cif) Average German import price (cif)
(Heren UK Index) NBP
(Henry US Hub)
Northwest Europe marker price
Brent spot prices
USD per million Btu USD per tonne USD per barrel
2004 5.18 4.30 4.46 5.85 72.08 38.27
2005 6.05 5.83 7.38 8.79 60.54 54.52
2006 7.14 7.87 7.87 6.76 64.11 65.14
2007 7.73 7.99 6.01 6.95 88.79 72.39
2008 12.55 11.60 10.79 8.85 147.67 97.26
2009 9.06 8.53 4.85 3.89 70.66 61.67
2010 10.91 8.03 6.56 4.39 92.50 79.50
2011 14.73 10.49 9.04 4.01 121.52 111.26 2012 16.75 10.93 9.46 2.76 92.50 111.67 2013 16.17 10.73 10.64 3.71 81.69 108.66
2014 16.33 9.11 8.25 4.35 75.38 98.95
2015 10.31 6.72 6.53 2.60 56.64 52.39
2016 6.94 4.93 4.69 2.46 60.09 43.73
2017 8.10 5.62 5.80 2.96 84.51 54.19
Btu – British thermal units. Cif – cost + insurance + freight (average prices).
Source: BP (2019).
As for lignite, Poland is the fourth producer worldwide and the second in the EU.
Compared to hard coal, lignite production has remained relatively stable with certain fluctuations. Notwithstanding, it decreased from 69.2 mt in 1991 to 60.2 mt in 2016 (Szczepiński, 2016; Kasztelewicz, 2018).21 Compared to 27 thousand in 1991, only ca. 10 thousand people are now employed in lignite mining (Schwartzkopff and Schulz, 2017:
5). Yet, reportedly, the sector indirectly employs 100 thousand people (Adamczewski, 2015). Regarding the availability dimension, one should also highlight that in contrast to
21 Lignite has a much lower heating value than hard coal.