Energy Strategy Reviews 40 (2022) 100817
2211-467X/© 2022 The Authors. Published by Elsevier Ltd. This is an open access article under the CC BY-NC-ND license
(http://creativecommons.org/licenses/by-nc-nd/4.0/).
The Hungarian utility cost reduction programme: An impact assessment
Csaba Weiner
a, Tekla Sz ´ ep
b,*aInstitute of World Economics, Centre for Economic and Regional Studies, E¨otv¨os Lor´and Research Network, T´oth K´alm´an utca 4, Budapest, H-1097, Hungary
bInstitute of World and Regional Economics, Faculty of Economics, University of Miskolc, Miskolc-Egyetemvaros, H-3515, Hungary ´
A R T I C L E I N F O JEL classification:
P22 P28 Q41 Q48 Keywords:
Utility cost reduction LMDI decomposition Residential energy consumption Energy policy
Consumer spending Hungary
A B S T R A C T
In Hungary, regulated energy prices fell by a quarter in 2013–2014 due to a state intervention. The objective of this article is to measure the effects of this change on the Hungarian residential energy consumption and assess the rationale, the policy context and other consequences of such an intervention. We decompose residential energy-use change in 2010–2018. We calculate 13.2 PJ of excess consumption relating to the programme, and find that the higher income deciles benefited the most from the lower prices compared to low-income households using market-priced lower-quality fuels and living in inefficient homes. The intervention lacked a strong policy background. The energy policy documents were later adjusted to the situation and finally the programme was linked to energy poverty. We point to price-setting failures and discrepancies between energy-efficiency goals and measures as well as negative effects of these and the programme itself. In the future, the policy emphasis should be on energy efficiency and supporting those really in need.
1. Introduction
The current energy transition cannot take place without the active involvement of the household sector, which accounts for a significant share of final energy consumption. In addition to the growth of renew- ables, energy efficiency is a key tool in reducing carbon dioxide emissions and thus mitigating climate change. In the mid-2010s, the European Union shifted its focus to environmental sustainability from other di- mensions of security of supply, such as availability and affordability.
Although favourable international energy prices between 2015 and 2020 may have diverted attention from the latter two dimensions, the sharp surge in energy prices in 2021 – on top of the Covid-19 pandemic – has again refocused decision makers on the issue of residential energy prices.
High energy costs, inadequate household income and obsolete housing stock often pave the way for energy poverty, generally referring to both the too-high share of energy costs relative to total household expenditure1 and the inability to heat the home adequately. The concept of energy poverty first appeared in EU documents in 2009 due to the Third Energy Package, and is currently affecting tens of millions of
people in the EU, with a wide variation of situations across the member states. In 2018, 6.1% of EU population (more than 31 million people) were unable to keep their homes adequately warm [2,3], 13.9% lived in a dwelling with a leaking roof, damp walls, floors or foundation, or rot in window frames or the floor, and 6.6% of households had arrears on utility bills [4,5]. Around 100,000 deaths each year are believed to be caused by living in cold homes [6]. On the other extreme, 19.1% of EU population could not properly cool their homes in the summer [7]. Also in 2018, 20.0% of household consumption expenditure was devoted to housing and water and 3.9% to electricity, gas and other fuels [8].
Different indicators point to the prevalence and complexity of energy poverty. There is a need for simultaneous management of social prob- lems, energy efficiency and other issues. Energy poverty also has country-specific characteristics that require differentiated interventions [9]. Nonetheless, there are three key points of intervention to reduce the ratio of energy expenditure to overall household income: to reduce high energy prices, to increase the relatively low disposable income and to enhance the energy efficiency of residential buildings. At these three points, available government tools and the timeline of expected impacts
* Corresponding author.
E-mail addresses: weiner.csaba@krtk.hu (C. Weiner), szep.tekla@uni-miskolc.hu (T. Sz´ep).
1 ‘Household expenditure’ corresponds to ‘household final consumption expenditure’ that consists of the total outlay on individual goods and services by resident households. Classified according to the Classification of individual consumption by purpose (COICOP), in this article, utility costs refer to the sum of the groups ‘04.4 Water supply and miscellaneous services relating to the dwelling’ and ‘04.5 Electricity, gas and other fuels’ (the latter hereinafter referred to as energy expenditure).
These are expenditure subcategories of the expenditure division ‘04 Housing, water, electricity, gas and other fuels’ (hereinafter, housing expenditure) [1].
Contents lists available at ScienceDirect
Energy Strategy Reviews
journal homepage: www.elsevier.com/locate/esr
https://doi.org/10.1016/j.esr.2022.100817
Received 25 June 2021; Received in revised form 19 January 2022; Accepted 26 January 2022
are, naturally, very different. Decreasing energy prices is a very quick and dramatic way to change the situation.
Since the adoption of the Third Energy Package, significant steps have been taken to liberalise electricity and gas prices in the EU in order to achieve well-functioning retail energy markets. However, several EU nations have maintained some sort of price intervention in the house- hold segment [10]. In 2016, the European Commission proposed that regulated (fixed) electricity prices should be phased out within five years, with certain derogations, but a number of member states – with Hungary having perhaps the loudest voice among them – insisted on preserving such price intervention. Finally, a compromise was reached in the Council at the end of 2017, allowing regulated prices to be kept in place for a limited time under certain circumstances, but this is to be followed up by the Commission in 2022 and 2025.
With fewer than 10 million people, Hungary is a relatively small Central and East European EU member state which came to international attention in the 2010s through its illiberal/authoritarian turn, Eastern opening towards Russia and China and quarrels with EU institutions.
Prime Minister Viktor Orb´an, who served first from 1998 to 2002, returned to power in 2010 after eight years of leftist/liberal governments.
Since 2010, Viktor Orb´an and his party Fidesz have dominated the Hungarian political landscape, winning three parliamentary elections in a row with a constitutional majority. An insistence on sovereignty is a particular attribute of the current Hungarian government.
In the 2010s, Hungary achieved positive social and economic results backed by EU funding and a favourable international financial market environment. After experiencing a contraction in 2009, Hungary’s GDP per capita, expressed in purchasing power standard (PPS), stood at around only 67–68% of the EU average in the early 2010s [11]. Between 2010 and 2018, the economy delivered an average GDP growth rate of 2.6%, including both a 1.4% decrease in 2012 and a 5.4% increase in 2018 [12], which has helped reach a GDP per capita figure equivalent to 71% of the EU average, though only 11% points higher than in 2007.
While improvements have been reflected in wage increases, poverty reduction and the growth in actual individual consumption per capita (a
measure of material welfare of households), such indicators place Hungary in a poor position in an EU or even a Visegr´ad comparison, with the latter comprised of Czechia, Hungary, Poland and Slovakia.2
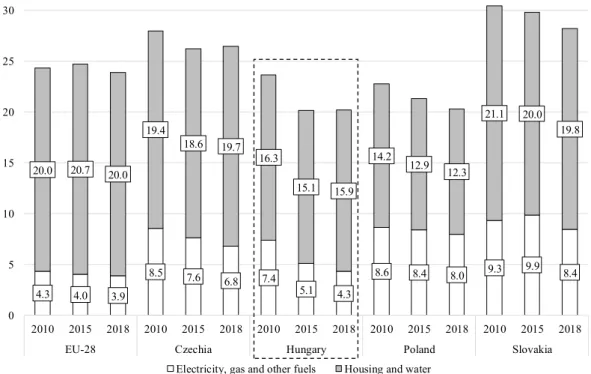
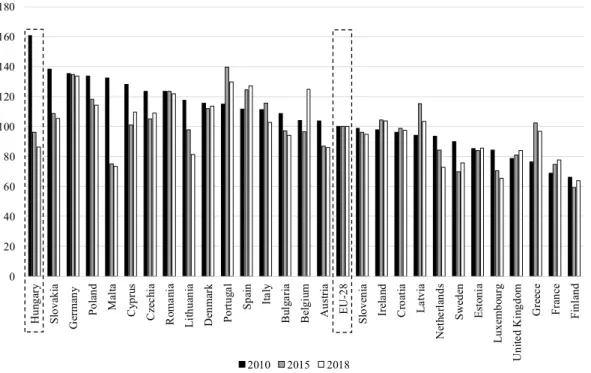
In terms of gas and electricity prices for households measured in current prices, Hungary belonged to the middle range of EU countries and also of the OECD in 2010. But the picture changes dramatically if figures are expressed in PPS. In this case, in 2010, the highest gas and electricity prices were reported in Hungary but the other three Visegr´ad countries also ranked in the first half of the list (Figs. 2 and 3) [13,14]. In 2010, the share of utility payments in the total annual household expenditure in Hungary amounted to 23.7% and that of energy expenditure 7.4%.
However, a high share of energy expenditure is not unique in the Euro- pean Union. In 2010, it was much higher in the Visegr´ad countries than in Western Europe or compared to the EU average (Fig. 1) [8]. In the early 2010s, the unemployment rate was high in Hungary and many house- holds were burdened by foreign-currency mortgage loans, which had been very popular before the global economic crisis of 2007–2009, but whose payments had become difficult to meet after the exchange rates depreciated markedly. For large segments of society, the payment of utility bills had become an everyday challenge. In the worst year, 2013, 25.0% of households had arrears on utility bills. The share of population at risk of poverty (below 60% of national median equivalised disposable income) having arrears on utility bills reached 60.7% that year [5].
In Hungary, the residential sector has the largest final energy demand [15] and the greatest potential for energy savings lies here, with a need to make both energy efficiency and energy conservation a very high prior- ity. Both despite and due to its poor socio-economic indicators in an EU or even a Visegrad comparison, Hungary has one of the highest levels of ´ household energy consumption per dwelling after climate correction in the EU, and it reported some of the worst progress in energy efficiency in the periods of 2000–2014 and 2014–2019. Energy efficiency barely improved in the latter period [16]. With a hydrocarbon-dominated en- ergy mix [17], Hungary has a high energy import dependency rate [18].
Therefore, domestic energy prices are to a large extent reliant on factors determined outside the Hungarian borders.
Fig. 1. Share of utility expenditure in total household expenditure in the Visegr´ad countries, 2010, 2015 and 2018 (%).
Source: Own compilation based on Eurostat [8].
2 These sources are cited where they occur in the text.
Nevertheless, the fragile economic situation of Hungarian house- holds and the large share of utility costs in household budgets in conjunction with agenda-setting purposes prompted the Hungarian government to launch a comprehensive and significant utility cost reduction campaign in 2013, also involving non-energy utility costs,3
which fall outside of the focus of this article. Natural gas, electricity and district heating prices were reduced permanently in the household sector in three consecutive steps between 2013 and 2014:
– In the first phase, between January and October 2013, the price decline was 10% for the three energy sources;
– In the second phase, starting from November 2013, a further 11.1%
price cut was made for the three energy sources;
Fig. 2. Electricity prices (including all taxes and levies) for medium-sized household consumers (with an annual consumption of between 2500 and 5000 kWh) in the EU member states, 2010, 2015 and 2018 (EU-28 =100; EUR, PPS per kWh).
Source: Own compilation based on Eurostat [13].
Fig. 3. Gas prices (including all taxes and levies) for medium-sized household consumers (with an annual consumption of between 20 GJ and 200 GJ) in the EU member states, 2010, 2015 and 2018 (EU-28 =100; EUR, PPS per GJ).
Source: Own compilation based on Eurostat [14].
3 The programme has affected water supply and sanitation as well as waste collection and chimney sweep costs.
– As part of the third phase, residential consumer prices for natural gas were decreased by 6.5% from April 2014, for electricity by 5.7%
from September 2014 and for district heating by 3.3% from October 2014.
Consequently, prices paid by households fell by a total of 25.2% for natural gas, 24.6% for electricity and 22.6% for district heating, while liquefied petroleum gas (LPG) prices were also reduced by 10% in this period. Residential prices for natural gas, electricity and district heating have been fixed and remained unchanged for everyone since then. The price reduction is unified; it is not differentiated according to the income levels of households. On top of these points, one can argue that a ‘hidden utility cost reduction’ has also taken place because since the start of the utility cost reduction programme, these energy prices have not been adjusted for inflation, which means that they have been decreasing in real terms.4
The programme started less than a year and a half before the April 2014 parliamentary elections, and utility prices ended up being one of the major campaign points for the ruling party. Prior to the parliamentary elections in April 2018, the government decided on a further but small one-off subsidy of HUF 12,000 (some EUR 40), called the winter utility cost reduction. This focused on heating, and ultimately households using piped gas, district heating, firewood, coal and LPG became part of the campaign. The subsidy was provided as a price compensation payment credited into the customers’ accounts, an in-kind transfer or cash support depending on the availability of piped gas and district heating services and on the household fuel usage profile. Those who were eligible to receive an in-kind subsidy had to apply for the fuel. In this case, the deadline was longer; thus, these consumers gained access to the fuel later.
The programme has been occupying a high-profile place on Hun- gary’s political agenda for almost a decade. It has received great attention abroad not only because of the programme itself, but also because of its impacts on both the national and European Parliament elections in 2014 as well as Hungary’s relations with the European Union. In contrast to the 2014 elections, the programme was no longer the main campaign point in 2018, as the issue of migration took its place as the exclusive agenda setter. However, in 2020, the government made the programme the main official tool in the fight against energy poverty, and high energy prices of 2021 have led to the resurgence of the issue of utility cost reduction. The government even capped motor fuel prices for three months from November 2021, and in December 2021 it allowed small and medium- sized enterprises to opt for regulated electricity and gas tariffs for half a year. The residential energy cost reduction programme has, therefore, not lost its relevance and has remained one of the defining regulatory features of the domestic energy market, buffeted by political emotions.
This article is a continuation of our previous work [19], which pro- vided a first attempt to analyse the effects of the utility cost reduction.
Despite the importance and consequences of the programme, no other study has yet been conducted that thoroughly examines this Hungarian issue, although when the measures were introduced, calculations were made as to who would ultimately fund the programme [20,21].
This article is more than a kind of a monitoring or follow-up. It has two main goals. The first is the same as before: using the logarithmic mean Divisia index (LMDI) to determine the effects of suddenly falling resi- dential energy prices in Hungary on household energy consumption and to quantify what factors (intensive structural effect, extensive structural effect, expenditure effect and population effect) offset or reinforced this price effect. However, we are now relying on an adjusted methodology for evaluating a longer period, 2010–2018, also including the low-impact 2018 one-time subsidy, instead of 2010–2015. There are five methodo- logical changes which prompt us to reconsider previous results and conclusions. The first is a significant change in official statistics for measuring Hungarian renewable energy consumption. In Hungary,
50–60% of the firewood consumed is of unknown origin and potentially sourced from illegal logging. This is highlighted by the sum of domestic firewood, energy crops production and firewood imports, which does not match the total for firewood used. Therefore, in order to capture the real size of biomass consumption, statistical data were significantly modified in 2017. The national energy regulator moved from using supply-side statistics to statistics referring to household energy consumption, resulting in drastically increased residential biomass (firewood) con- sumption and thus total final energy consumption, consequently re- flected in the share of energy from renewables. For example, the final consumption of renewables for energy use in 2013 – the year when the utility cost reduction programme was introduced – increased from 49 PJ to 102 PJ, and the total final consumption for energy use from 641 PJ to 681 PJ. This suggests that the results of the 2017 article can only be accepted with reservations (Fig. A1 in the Appendix) [22–26].
The other four methodological changes include those we introduce to improve the methodology. The first three of the four are related to climate corrections. First, we calculate individual heating shares for each energy source.5 Earlier a reference value was applied to the heating share for normal year in the decomposition analysis. However, Hungary is in a special situation regarding heating. Compared to the EU average, gas is overrepresented, electricity is underrated, and the dispersion of the heating share by energy sources is relatively high. Thus, the calcu- lation of individual heating shares for each energy source helps capture these Hungarian peculiarities. Second, we involve the so-called ‘share of heating dependant on degree days’ for more accurate climate correc- tions. We take into account the technical characteristic that energy use for heating depends not only on the weather. Most devices, such as boilers, also consume energy when operating in summer mode. To handle this, the above new factor is introduced, and applied in the climate correction. Third, this time, we use climate-corrected data not only for residential energy consumption but also for energy expenditure in order to ensure the balance between the two sides of the decompo- sition formula.6 Fourth, we set up an adjusted price effect component for those energy sources included in the utility cost reduction so as to separate the price effect of the energy sources falling outside the scope of the programme. We call this effect the intervention price effect. Previ- ously, we used the total price effect to determine the effect of the utility cost reduction, but due to methodological changes in renewable data collection, firewood constitutes a notable part of residential energy consumption, the separation of which significantly improves the reli- ability of the results. For example, in 2013–2014, prices for electricity, gas and district heating fell, but those for firewood went up. Price effects with opposite signs partly cancel each other out, i.e. offset each other, but the new methodology makes these processes visible (Table 4). Fifth, in addition to these, on this occasion, a more sophisticated interpreta- tion is provided due to analysing the price, intensive structure, extensive structure and expenditure effects in Hungary also by income deciles and energy sources for the first time.7 While the first four points make our calculations more accurate, the fifth point, and in part also the fourth point, makes them more detailed. As for the fifth point, the original methodology was adequate to perform an impact analysis on the society as a whole, while the new methodology allows us to measure changing energy consumption of the lower, middle and upper classes, and to put a focus on energy poverty, a topic that became a key government argu- ment in favour of the utility cost reduction programme years after the original paper. Table A1 in the Appendix shows the differences between calculations based on (1) the old methodology, (2) the old methodology
4 Oliv´er Hortay brought this point to our attention (26 October 2020).
5 This is based on a suggestion by one of our anonymous reviewers.
6 This was proposed by L´aszl´o Szab´o from Hungary’s Regional Centre for Energy Policy Research (2 December 2020).
7 The price and intensive structure effects can be examined both at the levels of income deciles and energy sources, but, by implication, the extensive structure and expenditure effects only by income deciles.
with adjusted renewable energy consumption statistics and the inclusion of the 2018 winter utility cost reduction programme and (3) the new methodology with adjusted renewable energy consumption statistics and the inclusion of the 2018 winter utility cost reduction programme.
The second goal of this article, which was not addressed in the original paper, is to provide a complex understanding of Hungarian residential energy consumption patterns and price regulation and the policy perspective in which the research results and thus the antecedents and the consequences of the programme can be interpreted. Without this, real conclusions and policy implications cannot be ascertained. The overview of the residential energy consumption is given through the lens of the intervention points available to reduce the ratio of energy expenditure to overall household income. The discussion of the policy perspective is divided into three parts. First, we assess Hungarian energy policy documents released since the formation of the new government in 2010 in order to understand the Fidesz-led government approach to- wards regulated prices and, in relation to these, the issues of energy efficiency, energy poverty and security of supply. The key documents reflecting current trends in government thinking are Hungary’s National Energy and Climate Plan (NECP), the National Energy Strategy (NES) 2030 with an Outlook to 2040 and Hungary’s Long-Term Renovation Strategy (LTRS). The NECP and the NES were released in January 2020 and the LTRS in July 2021. Second, we assess how regulated prices relate to market fundamentals and the consequences of the prevailing situation. Third, goals, measures and achievements are evaluated in residential energy consumption and energy efficiency. Therefore, in this article, a quantitative method is combined with qualitative analytical tools to obtain a broad analysis.
We can find examples for applying the LMDI method to EU countries in examining energy efficiency, but the literature lacks analyses similar to our work. However, we can identify such LMDI studies for emerging markets and developing economies, such as China, Kazakhstan, Hong Kong or Iran. These papers tend to reveal the effects of the elimination of regulated prices, but examples also exist for the effects of cuts in regu- lated prices. They find that price changes affect income groups differ- ently, and many households respond by switching to other forms of energy. A common and obvious conclusion is that energy prices have an impact on household energy consumption [27–32]. Our paper also makes an empirical contribution by documenting a textbook example of how the theory applies to practice in an EU member state. Considering both the positive and negative consequences, Hungary can set an example for other countries in the future.
The rest of the article is organised as follows. Section 2 explains the residential energy consumption patterns and price regulation in Hungary. Section 3 describes the methodology and data. It introduces the LMDI method and considers international experiences related to the topic. Section 4 presents the index decomposition results and the pro- cesses which lie behind these figures. Section 5 discusses the policy perspective. Finally, conclusions and policy implications are offered at the end of the article (Section 6).
2. The Hungarian residential energy consumption patterns and price regulation
In 2018, Hungary’s gross inland and final energy consumption reached 1118 PJ and 747 PJ, respectively, whereas residential final energy consumption was 244 PJ, or 271 PJ if corrected by climate (Table 1) [23]. The climate-corrected final energy consumption of the Hungarian household sector declined between 2012 and 2014, but growth was seen in the period of 2015–2017.
Most household energy consumption (71.7% in 2018) goes on heating homes. The remaining share of energy is almost exclusively for water heating (12.8%) and the use of lighting and electrical appliances (excluding the use of electricity for powering the main heating, cooling or cooking systems) (10.4%). Space cooling accounts for a negligible proportion of residential final energy consumption (0.2% in 2018), but
the share for cooling continues to increase [33,34].
The largest part of the residential final energy consumption is covered by natural gas (48.6% in 2018), followed by renewables (23.5%), elec- tricity (16.8%), district heating (8%), solid fossil fuels (1.6%) and oil and petroleum products (1.3%) (Table 2). Gas (56.3% in 2018) and renew- ables (32.0%) cover the bulk of the energy needs for space heating. Dis- trict heating accounted for 8.3% of space heating in 2018, but gas provides close to 70% of total derived heat production (such as district heating), which put additional emphasis on the importance of gas [33].
The residential sector takes the largest share of Hungary’s gas con- sumption [35]. Piped gas is available almost all over the country and is frequently used. More than 90% of the Hungarian settlements are sup- plied with piped gas, and around three-quarters of the households use it [36]. Subsidised domestic gas prices significantly contributed to the massive penetration of gas in households. In contrast, solid fossil fuels, electricity and oil and petroleum products (including LPG) represented only 2.3%, 0.8% and 0.2% in space heating, respectively [33].
As mentioned, the ratio of energy expenditure to overall household income is mainly determined by the energy prices, the amount of disposable income and the level of energy efficiency of residential buildings, but other factors, such as energy conservation, also come into play.8 In 2000, Hungarian households spent only 17.7% of their total expenditure on housing, compared to over 25% in 2010, as reported by the Hungarian Central Statistical Office (KSH) [37].9 The shift between the two items can be explained by decreasing food-related expenses of households. Generally, stagnating or declining incomes force consumers to change their buying habits in favour of cheaper products. However, since housing expenditure is inelastic in the short term (and only rela- tively elastic in the long term), households face a great burden to adapt to such challenges [38]. Since 2013, the two ratios seem to have been moving in opposite directions. Consequently, between 2014 and 2018, the expenditure on food and non-alcoholic beverages accounted for the biggest item, with 24.6% share of the total in 2018, while the share of housing expenditure declined to 19.3% (the share of utility costs was 15.8% in 2018 and that of energy expenditure 11.4%) [37]. The share of energy expenditure in the total annual expenditure had decreased in the Visegr´ad region by 2018 (Fig. 1), but while such expenditure in current prices increased by more than 17% in Slovakia and Poland and remained almost unchanged in Czechia, it decreased by 26.4% in Hungary be- tween 2010 and 2018 [8].
Due to the high share of gas in residential energy consumption, the rise and fall of gas prices is the most critical for the Hungarian popula- tion, but prices of firewood, electricity and district heating are also important issues. In contrast to firewood, regulated prices provide an opportunity to reduce utility costs in the cases of natural gas, electricity and district heating. Currently, only households and other selected consumers, such as small businesses, have the right to purchase gas and electricity at regulated prices in the so-called ‘universal service’, intro- duced for electricity in January 2008 and for gas in July 2009. Resi- dential gas and electricity customers served with market-priced supply are a rare phenomenon in Hungary, but they have the option to buy gas and electricity in the unregulated segment. The change in the universal service pricing came after Fidesz won the parliamentary elections in spring 2010, ending a system in place between January 2008/July 2009 and June 2010, when prices were calculated by service providers, and their proposals were submitted to the energy regulator, who then
8 However, residential energy consumption is affected by many other factors, such as energy structure (mix); urbanisation; type, size and conditions of buildings; type, number and energy efficiency of household devices; household size and type; employment status and medical conditions of household mem- bers; other consumer habits. In this article, we cannot address all these points.
9 In total terms, there is only a slight difference between housing expenditure data from Eurostat [8] and KSH [37]. However, on the level of subcategories, significant differences can be found due to varying data collection methods.
approved them. In 2010, more intense governmental control started in Hungary. With effect from July 2010, the energy regulator was demoted to carry out only preparatory tasks for ministerial decrees on regulated electricity and gas prices, and Hungary’s National Development Minis- try became the price-setting authority. Presently, the Ministry for Innovation and Technology performs this task.
In the 2010s, the government introduced certain taxes burdening the energy sector, while the energy regulator started to undertake a special role, characterised by strong government control and in some cases unquestionable decisions.10 The latter is related to the centralised decision-making that can be observed at policy level.
Under the new government, regulated gas prices remained un- changed in the second half of 2010, while electricity prices decreased in July 2010, with the latter still being approved by the energy regulator.
However, in 2011 and 2012, the two years before the utility rate cuts,
regulated gas and electricity prices both increased, though in 2011 there was no price increase for consumers using under a certain amount of gas, and discounts on gas prices for large families (those with at least three children) were introduced that year. Regulated gas and electricity prices in the universal service are not uniform across the country, but differ across distribution companies.
In contrast to electricity and gas, there had not previously been central price regulation for district heating; this was a municipal competence, though between 2009 and 2011, district heating prices were subject to price control by the energy regulator. Accordingly, district heating providers submitted their requests for price changes to the energy regulator before municipalities made their decisions on pri- ces capped by the energy regulator. In the new situation, as a first step, prices were frozen in March 2011, and with effect from April 2011 district heating also brought under central price regulation. However, in the end, in 2012, district heating prices rose. Therefore, the utility cost reduction programme was preceded by price increases for gas, elec- tricity and district heating, made by the same government.
The LPG market is a special case because steps have been taken in a Table 1
Energy consumption in Hungary, 2010–2018 (PJ).
2010 2011 2012 2013 2014 2015 2016 2017 2018
Gross available energy 1113.4 1091.2 1037.1 1001.5 997.4 1055.2 1068.5 1116.0 1118.0
Gross inland consumption 1113.4 1091.2 1037.1 1001.5 997.4 1055.2 1068.5 1116.0 1118.0
Gross inland consumption (Europe 2020–2030) 1113.4 1091.2 1037.1 1001.5 997.4 1055.2 1068.5 1115.7 1117.6
Primary energy consumption (Europe 2020–2030) 1030.7 1021.2 968.6 938.1 920.9 975.4 990.4 1024.2 1024.9
Final energy consumption (Europe 2020–2030) 730.6 732.4 689.7 694.4 679.1 728.5 744.3 773.8 775.1
Available for final consumption 789.7 778.8 744.6 734.9 723.4 776.1 791.0 829.9 832.3
Final consumption for energy use 706.7 708.3 670.0 680.6 660.5 704.6 724.6 747.7 746.7
Households 278.4 275.1 266.9 260.0 229.7 249.9 258.4 263.5 243.6
Households (climate corrected) 277.2 281.6 276.1 274.3 268.0 269.5 271.4 274.5 270.9
Note: In the article, we use the term ‘final consumption for energy use’ and not ‘final energy consumption (Europe 2020–2030)’ when referring to final consumption.
‘Gross available energy’ is equal to ‘gross inland consumption’ because of the lack of international maritime bunkers in Hungary.
Source: Eurostat [23] and own calculations.
Table 2
The structure of residential energy consumption and expenditure by energy sources in Hungary, 2010–2018 (PJ, %).
Year Unit Energy source
Gas Total petroleum products District heating Solid fossil fuels Primary solid biofuels Other renewables Electricity Total
2010 PJ 136.5 5.6 23.9 6.2 65.6 0.2 40.3 278.4
% (PJ) 49.0 2.0 8.6 2.2 23.6 0.1 14.5 100.0
% (HUF) 37.0 2.8 10.7 12.2a –b 37.3 100.0
2011 PJ 124.2 4.4 22.1 7.2 76.2 0.3 40.7 275.1
% (PJ) 45.2 1.6 8.0 2.6 27.7 0.1 14.8 100.0
% (HUF) 36.6 3.2 11.2 13.3a –b 35.8 100.0
2012 PJ 113.2 3.3 22.5 6.4 83.0 0.3 38.2 266.9
% (PJ) 42.4 1.2 8.4 2.4 31.1 0.1 14.3 100.0
% (HUF) 35.1 3.2 11.3 15.4a –b 35.0 100.0
2013 PJ 105.2 3.6 21.9 5.6 85.3 0.4 38.1 260.0
% (PJ) 40.5 1.4 8.4 2.1 32.8 0.1 14.6 100.0
% (HUF) 34.0 3.1 11.4 16.1a –b 35.4 100.0
2014 PJ 97.2 3.1 18.1 4.3 69.1 0.4 37.5 229.8
% (PJ) 42.3 1.3 7.9 1.9 30.1 0.2 16.3 100.0
% (HUF) 33.6 3.1 10.7 18.4a –b 34.1 100.0
2015 PJ 109.9 3.1 19.6 4.0 73.9 0.4 39.0 249.9
% (PJ) 44.0 1.2 7.8 1.6 29.6 0.2 15.6 100.0
% (HUF) 33.6 3.2 10.0 19.2a –b 34.0 100.0
2016 PJ 117.8 2.5 20.6 5.0 72.0 0.5 39.4 257.8
% (PJ) 45.7 1.0 8.0 2.0 27.9 0.2 15.3 100.0
% (HUF) 35.1 3.0 9.5 19.0a –b 33.5 100.0
2017 PJ 124.4 3.1 20.9 5.9 68.0 0.9 40.5 263.7
% (PJ) 47.2 1.2 7.9 2.2 25.8 0.3 15.4 100.0
% (HUF) 36.5 2.8 9.2 18.4a –b 33.2 100.0
2018 PJ 118.5 3.2 19.6 4.0 56.6 0.8 40.9 243.6
% (PJ) 48.6 1.3 8.0 1.6 23.2 0.3 16.8 100.0
% (HUF) 35.5 2.6 9.0 19.7a –b 33.2 100.0
aThe Eurostat [8] and KSH [16] databases are compatible with each other, and only a small difference can be seen. KSH [16] merges expenditure data of solid fossil fuels and primary solid biofuels into one category called solid fuels. Therefore, these data show the share of residential energy expenditure on solid fuels.
b The ratio of residential energy expenditure on other renewables is 0% because these renewables, such as solar, have zero or negligible marginal costs of production.
Source: Own calculations based on Eurostat [8] (for data in PJ) and KSH [16] (for data in HUF).
10 Andr´as De´ak provided some background information on these issues (16 December 2019).
free market to achieve price reductions via the utility cost reduction programme. In the case of the concerned products, price regulation as part of the utility cost reduction programme refers to price decreases as of July 2013 compared to market prices on 1 December 2012. Prices charged by suppliers entering the market after 1 December 2012 are set by the energy regulator.
In parallel to the utility cost reduction programme, the Hungarian energy landscape went through a major renationalisation campaign, expanding both state assets and ‘special domestic private property’, the latter having close and intensive coordination with the government and typically referring to assets owned by L˝orinc M´esz´aros, a former gas-pipe fitter and later a mayor in Viktor Orb´an’s quasi-home village, who is perceived by the public as having become a billionaire due to his friendship with Viktor Orb´an and winning contracts from the government.
In the mid-2010s, multinational companies dominated gas and electricity distribution and retail, while state-owned companies led the gas and electricity wholesale market after the government acquired the dominant gas wholesaler from one of the multinationals. Recent new dynamics refer to exiting multinationals and entering state-owned and domestic private companies in gas and electricity distribution and retail, with a single state-owned player in the regulated prices segment of the gas retail market because other players withdrew from the universal service in gas.11 Meanwhile, district heating systems are owned by the municipalities.
In Hungary, between 1995 and 2012, prices of food and other commodities, including fuel for vehicles, have generally moved with the inflation index, but prices of services, especially those of residential energy, increased at a rate higher than the inflation rate. The utility cost reduction programme largely contributed to lower inflation that went negative in 2014 (− 0.2%) and 2015 (− 0.1%) from the high of 5.7% in 2012 [39], though it has been rising again since 2016. By 2018, Hungary had drastically improved its position in the EU ranking of residential gas and electricity prices in PPS, moving into the middle third range of countries both in terms of electricity prices (18th highest) and gas prices (19th) (Figs. 2 and 3) [13,14]. Gas and electricity prices had become more favourable in Hungary than in the other three Visegr´ad countries.
While there is no price regulation for gas and electricity in Czechia, in 2019 almost all or all households in the other three Visegr´ad countries were supplied with gas and electricity under a price intervention mechanism [10].
Since in Hungary most household energy is used for heating, also the largest utility cost item, a particular issue for households is whether their heating is among the beneficiaries of the utility cost reduction. Just under two-thirds of the energy used has been subsidised under the permanent price cut, i.e. those customers who heat their homes with natural gas, district heating, LPG and electricity. However, the cost of the remaining roughly one-third of energy, i.e. firewood- and coal- heating households, has only been supported by the winter utility cost reduction programme. At the same time, firewood and coal prices increased 1.5 times between 2010 and 2018 [40]. Naturally, a house- hold can combine multiple energy sources for heating, but in practice this is often unfeasible for the poorest households. These customers have only benefitted from the permanent programme by other types of end use, as subsidised electricity is used for lighting and other electrical appliances, or these households may consume subsidised energy sources for cooking and water heating. However, firewood and coal use is overrepresented among low-income households and is most prevalent in districts having a worse social situation [41]. As early as September 2013, it was announced that there were plans to reduce the burden on families using wood and coal for heating, but the 2018 winter utility cost reduction was all that was achieved [42]. The 2018 winter utility cost
reduction programme should not be confused with the issue of the ‘so- cial fuel’ programme introduced in 2011 for receiving firewood or brown coal. The financial support is claimed by the municipalities from the Ministry of the Interior and then the purchased fuel is distributed by local governments on the basis of social criteria. Although increasing in the 2010s, the programme has a low budget, despite the fact that heating subsidies are important because of the effects of poverty on health and environment. Ambient (outdoor) and household (indoor) air pollution is a palpable problem during the heating season in Hungary due to the combustion of low-quality fuels and waste in old, inefficient and unmaintained heating appliances, ignoring guidelines for proper use [41]. However, special attention is paid to the ‘social fuel’ programme in the Hungarian Long-Term Renovation Strategy. Together with the regulated prices, it serves as a background to managing the problem of energy poverty and related health issues [43].
In the early 2010s, the low level of gas consumption, the declining share of gas and, conversely, the increase in the role of firewood were mainly explained by affordability reasons, while only a minor role was played by other aspects (including energy conservation and efficiency or foreign employment and emigration) [44]. Household gas consumption peaked at 164.5 PJ in 2005 and was at 118.5 PJ as of 2018 [23,45]. This is a much lower level, but since 2015 an upward trend has been observed, with 21.9% higher demand in 2018 than in 2014. These good years for gas have strongly been linked to the utility cost reduction programme, and are partly due to consumers switching back from firewood to gas. The consumption fluctuations of renewables signal that households consider biomass an alternative source for heating. Its share in residential energy consumption was still over 30% in each year between 2012 and 2014, compared to just above 23% in 2018. Between 2014 and 2018, the share of firewood decreased and that of gas increased [23]. It cannot be excluded that the importance of natural gas would have declined further without the utility cost reduction programme. The volume of electricity consumption decreased slightly during the period of 2012–2014, but it has been growing again since 2015 (Table 2).
According to the calculations of Hungary’s Ministry for Innovation and Technology, the utility cost reduction programme resulted in a total of HUF 1700 billion savings to Hungarian households during the period of 2013–2019 [46]. We estimate a much lower figure of HUF 632.5 billion for that period. This represents an average of 0.3% of annual GDP between 2013 and 2018. Between 2010 and 2018, per capita adjusted gross disposable income of households and actual individual consump- tion per capita, both measured in PPS, grew in real terms at average annual rates of 3.1% and 2.6%, respectively, though in absolute terms, the other three Visegrad countries are better off than Hungary [47,48]. ´ Gross debt-to-income ratio of households fell from 67.9% in 2010 to 33.4% in 2018 in Hungary [49]. In 2018, only 11.1% of households had arrears on utility bills, compared to 22.1% in 2010 [5]. In parallel, the share of the total population at risk of poverty or social exclusion dropped from 31.5% or 2.9 million in 2010 (34.8% or 3.3 million in 2012) to 19.6% or 1.9 million in 2018. In 2018, this ranked Hungary in the middle range of poverty across EU member states, while Czechia (12.2%) and Slovakia (16.3%) had among the lowest poverty rates, and Poland was also better placed (18.9%) than Hungary. Nevertheless, this rate has improved the most in Hungary since 2010 [50]. In contrast, the drastic decline in extreme poverty in Hungary from 3.4% or 331,000 in 2010 (and 4.9% or 481,000 in 2013) to 1.2% or 119,000 in 2018 is in significant part attributable to statistical measurement in relation to those employed in the Public Works Scheme [51,52].
Since households have the largest potential for final energy savings, they are critical in reaching final energy consumption and savings goals.
Buildings are at the heart of energy savings. The largest potential lies in the renovation of existing residential homes. The 2015 National Build- ing Energy Performance Strategy set the target for primary energy savings from renovation of residential buildings to be achieved at 38.4 PJ per year by 2020: 17.6 PJ from single-family detached homes, 12.8 PJ from prefabricated apartment blocks and 8.0 PJ from traditional multi-
11 Bal´azs Felsmann provided valuable comments on this part of the paper (2 December 2020).
family residential buildings [53]. Nearly 80% of Hungarian homes fail to meet modern functional technical and thermal engineering re- quirements. The energy efficiency of buildings built between 1946 and 1980 is particularly poor, among which single-family detached houses are the least efficient [54].
According to Eurostat [2], the share of the Hungarian population having difficulty obtaining the necessary energy in their home to meet basic needs decreased from 10.7% in 2010 to 6.1% in 2018, compared to the EU average of 7.3% in 2018. The other three Visegr´ad countries registered better figures, with Czechia having 2.7%, Slovakia 4.8% and Poland 5.1% in 2018. However, a composite indicator has been formed by OpenExp [55], whose European Energy Poverty Index (EEPI) for scoring and ranking the member states’ progress in alleviating energy poverty shows that despite the positive tendency, the effectiveness of the utility cost reduction programme is only relative in Hungary. Irre- spective of the Hungarian government’s efforts, Hungary ranked last among EU members in 2018, while Czechia came in at 11th place, Poland at 12th and Slovakia at 24th.
Wasted energy is also a relevant factor that exists in parallel to en- ergy poverty. In Hungary, there is a bad habit of overheating residential, public and commercial buildings in the winter. Therefore, in many cases, there is a possibility for energy conservation by reducing the in- ternal temperature. One survey, involving France, Germany, Hungary, Spain and Ukraine, asked about the average temperature of a home during the winter when residents are at home. Although the answer to the question is likely to be largely a subjective estimation, the difference between Hungary and the other countries is quite striking. Nearly 65%
of Hungarian households heat their homes to 22 ◦C or above and 24% to 24 ◦C or more, and there is no clear relationship between the control- lability of the temperature and the declared temperature levels [56].
3. Methodology and data
The main goal of decomposition analysis is to quantify the effects of various factors on a dependent variable. A dependant variable can be a unit cost indicator or an aggregate indicator (e.g. a quantity or an in- tensity indicator) and can be connected to an energy-related variable or an environmental impact (e.g. emission) [57–59]. In energy research, two broad categories of the decomposition techniques can be distin- guished: structural decomposition analysis (SDA) and index decompo- sition analysis (IDA). Both of these techniques have many types.
Typically, the SDA approach is used when data are at a lower dis- aggregated level (such as data based on input-output tables), while the IDA utilises data mainly at higher level of aggregation [60,61]. With IDA, both absolute (additive approach) and relative (multiplicative approach) change can be decomposed, and the effects can be quantified on different levels (e.g. income groups, geographical areas or sectors).
Ang and Choi [62], Liu and Ang [63] and Ang [64,65] provide a comprehensive overview of IDA models.
Since the pioneering work of Haas [66] in 1997, there have been a number of studies on the decomposition of residential energy con- sumption [27–32,61,67–70]. Generally, the following factors are calculated: population, income, prices, energy intensity and energy mix (structural change). In most cases, energy consumption is climate cor- rected, though sometimes weather is an independent factor in the index decomposition analysis [68]. In this article, four effects are identified and measured: price, (intensive and extensive) structure, expenditure and population effects. We use the same methodology, i.e. the additive approach of IDA and the LMDI12 method, as we did for earlier data [19].
Here, only the main steps of the analysis are presented.
Let V be an energy-related aggregate. We assume that it is affected by n variables, so x1, x2, …, xn. The aggregate can be divided into i sub- sectors (here income deciles) where the changes take place. The
connection among the subsectors can be described by:
V=
∑
i
Vi=x1,ix2,i…xn,i. (1)
By the additive method, we decompose the absolute changes:
ΔVtot=VT− V0=ΔVx1+ΔVx2+…+ΔVxn, (2) where
V0=∑
i
x01,ix02,i…x0n,i, (3)
VT=∑
i
xT1,ixT2,i…xTn,i, (4)
and 0 is the base year, T is the actual year.
The LMDI method [63] is employed:
ΔVx1=∑
i
L( Vi0,ViT)
*ln( xT1i/
x01i)
, (5)
L(a,b) = (a− b)/(ln(a) − ln(b) ),for a∕=b and=a,for a=b. (6) This method has several major advantages, such as the ability to handle zero values, path independency, consistency in aggregation and perfectness in decomposition (the calculation does not result in residual terms) [31,61,64,70]. In a similar way to Zhao et al. [29], the identity of the decomposition analysis in this article is as follows:
E=
∑
i
∑
j
(Eij
/Yij
)*( Yij
/Yi
)*(Yi/Li)*(Li/Pi)*Pi, (7)
where
E is the climate-corrected final energy consumption of the household sector (PJ),
Y is annual per capita household expenditure on electricity, gas and other fuels (HUF),
L is the annual total household expenditure (HUF), P is the population (capita),
i is the income decile, and
j is the type of energy consumed by residents, such as solid fuels, total petroleum products, gas, electricity and district heating.13
Zhao et al. [29] examine the urban residential energy consumption and apply data with regard to energy-using activities and energy-using products as subcategories. However, in our case, income deciles and the type of energy sources are the levels of aggregation. These choices are justified by both the available data and our preliminary assumption that changes in the residential energy consumption between 2010 and 2018 were influenced mainly by the prices and disposable income. Here, regional differences between Hungarian counties or urban and rural areas are not taken into consideration, which is primarily justified by the objective of the research. This level of aggregation would go beyond the scope of this study.
For a clearer presentation, we introduce five new intermediate terms to present the five previous terms in Eq. (8), respectively, so:
E=∑
i
∑
j
PR*S1*S2*EP*PO. (8)
Applying the additive form of LMDI, changes in residential energy consumption between any two years (t and t-1) are:
ΔEtot=Et− Et−1=ΔEPR+ΔES1+ΔES2+ΔEEP+ΔEPO, (9)
12 It is called the LMDI-I method in Kaltenegger [59].
13 To be precise, derived heat is listed here, but this refers to district heating in this case.
where
ΔEPR is the price effect,
ΔES1 is the intensive structure effect, ΔES2 is the extensive structure effect, ΔEEP is the expenditure effect, and ΔEPO is the population effect.
Each of these five effects shows the impact of a specific factor on the residential energy consumption by income deciles. They quantify how much the specific component would have contributed to changes in the dependent variable (assuming other factors were fixed). However, it is important to highlight that the methodology is suitable only for measuring these impacts on the final energy consumption of the selected sector, and does not provide detailed information on the energy use by different energy sources. The price effect represents the impact of energy price change; the intensive structure effect refers to the change in the composition of energy expenditure; the extensive structure effect is the change in the share of energy expenditure in total household expendi- ture; the expenditure effect means the change in per capita total house- hold expenditure; and, finally, the population effect is the change in population size.
To determine the direct effect of the utility cost reduction programme, the price effect is divided into two main parts: price effect for energy sources that are covered by the programme (natural gas, electricity and district heating) and for those that are not (solid fuels and petroleum products14). We call the former effect the intervention price effect.
The sample period is from 2010 to 2018, which is justified by the limitation in data availability. Annual data collected from Eurostat and KSH as listed below are applied in the calculations:
– final energy consumption of the households by energy sources, such as solid fossil fuels, total petroleum products, gas, electricity, district heating, primary solid biofuels and other renewables15 (unit: PJ;
source [23]),
– heating degree days by NUTS 2 region, which include actual heating degree days and mean heating degree days over the period of 1980–2004 (unit: day; source [71,72]),
– annual per capita expenditure by COICOP and income deciles (unit:
HUF; source [37]), and16
– number of persons by income deciles (unit: capita; source [73]).
Nevertheless, the annual per capita expenditure data by COICOP classification do not contain separate information on renewables. The available subcategories are electricity, gas, liquid fuels, solid fuels and district heating, but the category of solid fuels also includes household expenditure on solid fossil fuels and primary solid biofuels (the latter referring essentially to firewood) [37]. In contrast, in energy statistics provided by Eurostat, solid fossil fuels are not merged with ‘solid biomass’ (primary solid biofuels) [74]. Because of this limitation, energy use data should be harmonised with household expenditure data cate- gories. In doing so, energy sources are grouped as follows: electricity, gas, total petroleum products, solid fuels (including both solid fossil fuels and primary solid biofuels) and district heating. Consumption data on primary solid biofuels contains illegally collected and/or traded firewood, but in this article, only legally harvested and traded firewood is considered, because expenditure data could cover only that.
The final energy consumption of the household sector is climate corrected, so the heating degree days are used to normalise the energy consumption. In making these calculations, the following formula was applied (similarly to Enerdata and Eurostat):
E=Ewc*1/(1− K*(1− DD/DDn)) (10) and
K=k*a, (11)
where
E is the climate-corrected energy consumption, Ewc is the energy consumption,
K is the corrected heating share for normal year, k is the heating share for normal year,
a is the share of heating dependant on degree days (i.e. 90%), DD is the heating degree days, and
DDn is the average number of heating degree days for the 25-year period of 1980–2004.
DDn is calculated as a long-term average of the number of heating degree days over a period of time in the past. The number of years taken into account depends on the data source; Eurostat takes into consider- ation 25 years (i.e. 1980–2004) [75].
Introduction of a is necessary. The climate correction is applied only to 90% of the space heating energy consumption due to the fact that
‘some losses are not dependent on the number of degree days’ [76]. The k reference value is determined on the basis of the 2020 NECP and NES.
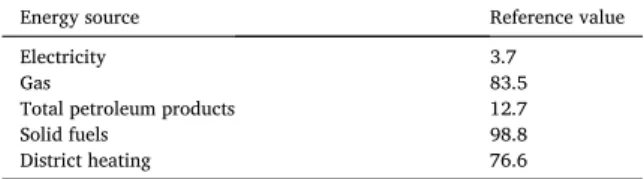
They consider 2017 as the base year for the heating share in the final energy consumption of the household sector [34,77].17 Following this methodology, the k reference value is calculated by energy sources (Table 3).
The annual per capita expenditure by COICOP and income deciles, especially the energy expenditure, is also affected by milder winters, so these data also require corrections. The climate-corrected household expenditure indicator is calculated in a similar way to energy con- sumption. Thus, data bias is avoided.
4. Results
The climate-corrected final energy consumption of the Hungarian household sector, excluding illegal firewood operations, declined be- tween 2011 and 2013, but growth was seen in the period of 2014–2017.
Fig. 4 illustrates the main drivers of these changes, i.e. the impact of the five different types of effects. In the following, possible explanations of the effects are discussed in a broader context.
The price effect shows that the higher price environment had a negative impact on the residential energy consumption between 2011 and 2012, but the situation was significantly changed from 2013 on- wards as a result of the utility cost reduction programme and thus decreasing energy expenditure. These changes are in line with the
Table 3
The k reference value by energy sources, 2017 (%).
Energy source Reference value
Electricity 3.7
Gas 83.5
Total petroleum products 12.7
Solid fuels 98.8
District heating 76.6
Source: Own calculation based on Eurostat [33].
14 Although LPG prices have been affected by the utility rate cuts, we could not include this energy source into the calculation of the intervention price effect due to lack of detailed data.
15 The category ‘other renewables’ is given if ‘primary solid biofuels’ are subtracted from ‘renewables and biofuels’ [23].
16 Note that coherent time series for such data are available only for the period
of 2010–2018. 17 This point was brought to our attention by an anonymous reviewer.
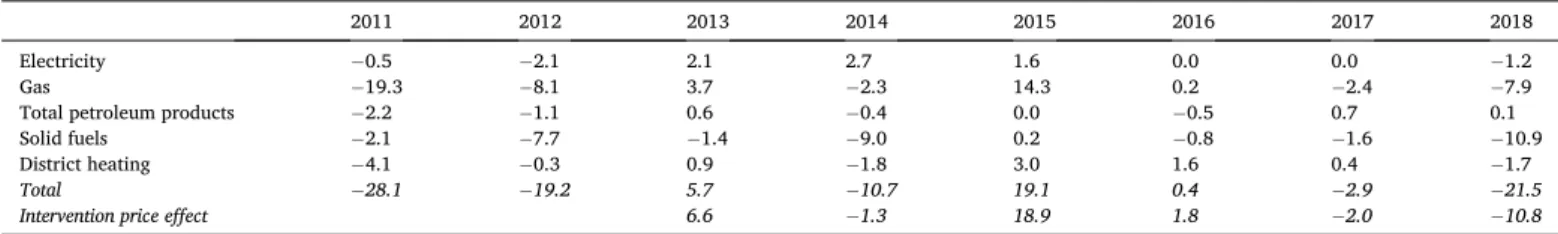
economic expectation that higher energy prices motivate households to reduce energy consumption to save money, while lower prices encourage greater demand. Without taking structural, expenditure or population effects into account, figures reveal that the price effect itself would have increased the dependent variable by 5.7 PJ in 2013, 19.1 PJ in 2015 and 0.4 PJ in 2016 (from the previous year, respectively).
However, in 2014 and 2017–2018, the size of the price effect was negative at − 10.7 PJ in 2014, − 2.9 PJ in 2017 and − 21.5 PJ in 2018.
The picture is considerably more nuanced if the price effect is split into two and the intervention price effect of the three energy sources covered by the state intervention is separated (Table 4). In 2013, the intervention price effect was 6.6 PJ (the sum of 2.1 PJ, 3.7 PJ and 0.9 PJ), − 1.3 PJ in 2014, 18.9 PJ in 2015, 1.8 PJ in 2016, − 2.0 PJ in 2017 and − 10.8 PJ in 2018. Overall, the utility cost reduction programme generated an extra energy use of 13.2 PJ in the residential sector during the period of 2013–2018.
Except a slight rebound in 2014, the intervention price effect was on a declining trend over the examined period. The Hungarian households adapted to the lower price environment, leading to the results of the intervention price effect being diminished and thus the utility cost reduction programme being exhausted. During this adaptation, the residential energy mix was restructured, with many households switching from firewood to gas. In 2014, the third phase of the pro- gramme started only in April; therefore, it could not affect energy con- sumption in the winter of 2013/2014, reflected in the negative intervention price effect. Meanwhile, firewood prices, which are not affected by the state intervention, went up significantly during the period of 2010–2018 [40]. The importance of firewood in the Hungarian residential energy mix is also evidenced by the fact that the total price effect was mainly driven by changes in the price of solid fuels. This is particularly striking in 2014 when the price effect of solid fuels amounted to − 9.0 PJ, compared to the total price effect of − 10.7 PJ.
When examining the intervention price effect by income decile (Table 5), the absolute values for each year are found to be much lower in deciles 1–5 than in 6–10. The different income deciles have not benefitted equally from the price fall, with the size of the intervention price effect varying by income decile. This may confirm our assumption that the state
intervention had a smaller effect on the lower deciles, and it favoured mainly the upper-middle income class and the wealthiest. The largest difference occurred in 2015, with the intervention price effect being more than double in deciles 6–10 than in 1–5 and the difference being 7.4 PJ.
The development of the total price effect and especially that of the intervention price effect uncovers three major findings. First, the utility cost reduction programme had a tangible impact on Hungarian resi- dential energy use by significantly increasing it. Second, the role of solid fuels is still considerable and the price growth for firewood is clearly reflected in the price effect. Third, although the poor have also benefited from the programme, these benefits have been far less than the positive effects experienced in the upper income deciles.
The structural effect can be divided into two main parts, intensive and extensive. The intensive part (the change in the composition of energy expenditure) is affected by two factors, the price change between various energy sources and the structural shift in the energy mix (the so-called basket effect). The extensive part shows the energy intensity develop- ment, i.e. the energy expenditure per unit of annual total expenditure.
Between 2011 and 2012, the intensive structural effect was positive (Tables 6 and 7). This suggests that during these years there was an increasing demand for cheaper energy sources, and many families switched to the less modern but more favourably priced firewood as fuel.
In 2013, some restructuring took place as a result of the utility cost reduction programme. An increasing demand for higher quality energy sources can be observed, which is most evident in higher gas con- sumption. What natural gas lost in popularity in 2012–2013, it actually gained back in 2016–2017. Solid fuels are slowly losing importance, but are still considered as fuels for the poor.18
The extensive structural effect was positive in 2011, which could be attributed to the increasing share of energy expenditure in the total annual expenditure. At that time, approximately 36% of the households used solid fuels for heating, compared to only 14% in 2005 [78]. This phenomenon is called energy degradation, referring to replacing higher Fig. 4. Decomposition results of residential energy consumption in Hungary, 2010–2018 (PJ).
Source: Own calculation.
18 No pattern can be discerned in Table 7. Therefore, this table is not analysed in the text.
![Fig. A1. Final energy consumption in Hungary using the old and the new methodology, 2005–2018 (PJ) Source: Own compilation based on Eurostat [22,23]](https://thumb-eu.123doks.com/thumbv2/9dokorg/731670.29173/17.892.129.763.578.999/final-energy-consumption-hungary-methodology-source-compilation-eurostat.webp)
