Empirical Evaluation of Software Maintainability Based on a Manually Validated Refactoring Dataset
P ´eter Heged }us, Istv ´an K ´ad ´ar, Rudolf Ferenc, Tibor Gyim ´othy
PII: S0950-5849(16)30356-1
DOI:
10.1016/j.infsof.2017.11.012Reference: INFSOF 5918
To appear in:
Information and Software TechnologyReceived date: 14 January 2017
Revised date: 11 November 2017 Accepted date: 19 November 2017
Please cite this article as: P ´eter Heged }us, Istv ´an K ´ad ´ar, Rudolf Ferenc, Tibor Gyim ´othy, Empirical Evaluation of Software Maintainability Based on a Manually Validated Refactoring Dataset,
Information and Software Technology(2017), doi:
10.1016/j.infsof.2017.11.012This is a PDF file of an unedited manuscript that has been accepted for publication. As a service
to our customers we are providing this early version of the manuscript. The manuscript will undergo
copyediting, typesetting, and review of the resulting proof before it is published in its final form. Please
note that during the production process errors may be discovered which could affect the content, and
all legal disclaimers that apply to the journal pertain.
ACCEPTED MANUSCRIPT
Highlights
• We provided a manually validated refactoring dataset containing only true positive refactorings.
• The maintainability of refactored elements (classes and methods) was lower than that of not-refactored elements.
• Size, complexity, and coupling metrics were generally higher in the refac- tored elements.
• Results are in line with our previous findings on the not validated dataset, but more significant.
• We found no strong connection between clone metrics and refactoring that was reported previously.
ACCEPTED MANUSCRIPT
Empirical Evaluation of Software Maintainability Based on a Manually Validated Refactoring Dataset
Péter Hegedűsa, István Kádárb, Rudolf Ferencb, Tibor Gyimóthyb
aMTA-SZTE Research Group on Artificial Intelligence, Szeged, Hungary
bUniversity of Szeged, Hungary
Abstract
Context: Refactoring is a technique for improving the internal structure of software systems. It has a solid theoretical background while being used in development practice also. However, we lack empirical research results on the real effect of code refactoring and its application.
Objective: This paper presents a manually validated subset of a previously published dataset containing the refactorings extracted by the RefFinder tool, code metrics, and maintainability of 7 open-source systems. We found that RefFinder had around 27% overall average precision on the subject systems, thus our manually validated subset has substantial added value. Using the dataset, we studied several aspects of the refactored and non-refactored source code elements (classes and methods), like the differences in their maintainability and source code metrics.
Method: We divided the source code elements into a group containing the refactored elements and a group with non-refactored elements. We analyzed the elements’ characteristics in these groups using correlation analysis, Mann- Whitney U test and effect size measures.
Results: Source code elements subjected to refactorings had significantly lower maintainability than elements not affected by refactorings. Moreover, refactored elements had significantly higher size related metrics, complexity, and coupling.
Email addresses: hpeter@inf.u-szeged.hu(Péter Hegedűs),ikadar@inf.u-szeged.hu (István Kádár),ferenc@inf.u-szeged.hu(Rudolf Ferenc),gyimothy@inf.u-szeged.hu (Tibor Gyimóthy)
ACCEPTED MANUSCRIPT
Also these metrics changed more significantly in the refactored elements. The results are mostly in line with our previous findings on the not validated dataset, with the difference that clone metrics had no strong connection with refactoring.
Conclusions: Compared to the preliminary analysis using a not validated dataset, the manually validated dataset led to more significant results, which suggests that developers find targets for refactorings based on some internal quality properties of the source code, like their size, complexity or coupling, but not clone related metrics as reported in our previous studies. They do not just use these properties for identifying targets, but also control them with refactorings.
Keywords: code refactoring, manually validated empirical dataset, source code metrics, software maintainability, empirical study
1. Introduction
Source code refactoring is a popular and powerful technique for improving the internal structure of software systems. The concept of refactoring was in- troduced by Fowler [1] and nowadays IT practitioners think of it as an essential part of the development process. Despite the high acceptance of refactoring techniques by the software industry, it has been shown that practitioners apply code refactoring differently than Fowler originally suggested. He proposed that code smells should be the primary technique for identifying refactoring oppor- tunities in the code and a lot of research effort [2, 3, 4, 5] has been put into examining them. However, there are statements in the literature [6, 7, 8] that engineers are aware of code smells, but are not really concerned on their im- pact as refactoring activity is not focused on them. A similar counter intuitive result by Bavota et al. [9] suggests that only 7% of the refactoring operations actually remove the code smells from the affected class. Besides exploring how, when and why refactoring is used in the everyday software development, their effects on short and long-term maintainability and costs are vaguely supported by empirical results.
ACCEPTED MANUSCRIPT
To help addressing the further empirical investigations of code refactoring, we proposed a publicly available refactoring dataset [10] that we assembled using the RefFinder [11, 12] tool for refactoring extraction and the SourceMeter1 static source code analyzer tool for source code metric calculation. The dataset consists of refactorings and source code metrics for 37 releases of 7 open-source Java systems. We applied the dataset for a preliminary analysis on the effects of code refactoring on source code metrics and maintainability [10, 13]. After the analysis, however, it turned out that the quality of the refactoring data is quite low due to the false positive instances extracted by RefFinder, thus in this paper2 we propose an improved dataset that is a manually validated subset of our original dataset. It contains one manually validated release for each of the 7 systems. Besides the list of true positive refactoring instances in the dataset every refactoring is also mapped to the source code elements at the level of methods and classes on which the refactoring was performed.
We also store exact version and line information in the dataset to supports reproducibility. Additionally to the source code metrics, the dataset includes the relative maintainability indices of source code elements, calculated by the QualityGate3 tool, an implementation of theColumbusQM quality model [15].
Being a direct measure of maintainability, it allows the analysis of the connection between source code maintainability and code refactoring as well.
Although the manually validated refactoring dataset is in itself a major contribution, we also utilized it to replicate and extend our preliminary stud- ies [10, 13] and re-examine the connection between maintainability and code refactoring as well as the distribution of the individual source code metrics in the refactored and non-refactored source code elements. The previous studies used the original (i.e. not validated) dataset, thus it is a question how the re- sults change using the manually validated dataset. Our empirical investigation focused on the low-level quality attributes of refactored (and non-refactored)
1http://www.sourcemeter.com/
2This journal paper is an extended version of our conference paper [14].
3http://www.quality-gate.com/
ACCEPTED MANUSCRIPT
classes and methods, and we tried to find patterns that may explain the moti- vations of the developers to perform refactoring and how the internal structure of the source code elements change upon refactoring.
To concisely describe our research motivations, we framed the following re- search questions, which we investigated with the help of the improved dataset:
RQ1. Are source code elements with lower maintainability subject to more refactorings in practice?
Since refactoring is by definition a change to improve the internal code struc- ture by preserving its functionality, it is an intuitive assumption that poor code structure is the primary driver behind code refactoring. To verify this, we inves- tigated the maintainability values of the refactored and non-refactored source code elements to see whether there are patterns that support or contradict this assumption. By applying statistical methods on the refactoring data contained in our dataset we found that the low maintainability values of source code en- tities indeed triggered more code refactorings in practice.
RQ2. What are the typical values of source code metrics of the refactored and non-refactored elements and how do they change upon refactorings?
The first research question investigates the maintainability of the refactored and non-refactored source code elements, but we were also interested in the typical source code metric values of these elements and the effects of refactorings on these metrics. Although the RMI itself relies on source code metrics, it uses and combines only a small fraction of the available metrics (i.e. those extracted by SourceMeter). We wanted to analyze each and every metric by itself to get a deeper insight about the effect of refactorings on them. Moreover, besides the sheer metric values we were also interested in their changes throughout the releases.
Therefore, in RQ2 we examined how do the well-known source code metrics, like complexity, lines of code, coupling, etc., shape and change for the refactored and non-refactored source code elements. In general, we found that source code elements that were refactored had significantly different (typically higher) size related metrics (e.g. lines of code, number of statements), complexity (e.g.
ACCEPTED MANUSCRIPT
McCabe’s cyclomatic complexity [16], nesting level) and coupling (e.g. coupling between object classes and number of incoming invocations) on average than source code elements not refactored at all.
Moreover, these were the metrics that changed more significantly in the refactored elements than in the non-refactored ones. Additionally, we found no such metric that would be consistently larger in the non-refactored classes and/or would grow much slower in non-refactored classes than in the refactored ones.
We also compared the findings with the previous results obtained on the not validated refactoring dataset and found that most of the metric groups found to be relevant in connection with refactoring was the same for both datasets. How- ever, while previous results displayed 2-4 significant cases out of 7, we obtained 3-6 significant cases with much stronger p-values using the manually validated dataset. We also identified that clone related metrics had no strong connec- tion with refactoring, even though previous results on the not validated dataset suggested so due to the false positive refactoring instances.
The main contributions of the paper can be summarized as follows. In the conference version [14] we already presented:
• A manually validated dataset containing true positive refactoring instances attached to source code elements at method and class level and their source code metrics and maintainability scores.
• An extension of the RefFinder tool that allows batch-style analysis and result reporting attached to the source code elements.
• An empirical investigation of the maintainability scores of the source code classes and methods affected by at least one refactoring and those of not.
On the basis of the achieved positive results so far, in this paper we extend our previous analysis with:
• An empirical evaluation of the main quality properties (i.e. source code metrics) and their changes due to refactoring (an entirely new research
ACCEPTED MANUSCRIPT
question).
• A comparison of the findings with the previous results obtained on the not validated refactoring dataset.
• Detailed information of the existing and new statistical test results and an extended discussion of them.
• We made our data analysis results available online just like the dataset itself.
The rest of the paper is organized as follows. First, we start with a related literature overview in Section 2. Next, Section 3 outlines the data collection and validation process of creating the dataset. We describe the data analysis methodology applied for answering the research questions in Section 4. In Sec- tion 5, we display the results of our empirical investigation on the maintainability and source code metrics of refactored and non-refactored source code entities.
The threats to the validity of our results are listed in Section 7. Finally, we conclude the paper in Section 8.
2. Related Work
There are several studies that have investigated the relationship between practical refactoring activities and the software quality through different quality attributes. Many of them used the RefFinder tool [11] to extract refactorings from real-life open-source systems, similarly as we did.
Bavota et al. [9] made observations on the relations between metrics/code smells and refactoring activities. They mined the evolution history of 2 open- source Java projects and revealed that refactoring operations are generally fo- cused on code components for which quality metrics do not suggest there might be a need for refactoring operations. In contrast to this work, by consider- ing maintainability instead of code smells, we found significant and quite clear relationship with refactoring activities. Bavota et al. also provided a large refactoring dataset with 15,008 refactoring operations, but it contains file level
ACCEPTED MANUSCRIPT
data only without exact line information. Our open dataset contains method level information as well and refactoring instances are completely traceable.
In a similar work to ours, Murgia et al. [17] studied whether highly coupled classes are more likely to be targets of refactoring than less coupled ones. Classes with high fan-out (and relatively low fan-in) metric consistently showed to be targets of refactoring, implying that developers may prefer to refactor classes with high outgoing rather than high incoming coupling. Kataoka et al. [18]
also focused on the coupling metrics to evaluate the impact of refactorings and showed that their method is effective in quantifying the impact of refactoring and helped them to choose the appropriate refactoring types.
Contrary to these two works [17, 18], we did not select a particular metric to assess the effect of refactorings, but rather used statistical tests to find those metrics that change meaningfully upon refactorings. This way we could identify that complexity and size metrics also play an important role in connection with refactorings applied in practice.
Kosker et al. [19] introduced an expert system for determining candidate software classes for refactoring. They focused on the complexity measures as primary indicators for refactoring and built machine learning models that can predict whether a class should be refactored or not based on its static source code metrics. In lack of real refactoring data, they assumed that classes with decreasing complexity over the releases are the ones being refactored actively.
Using this heuristic, they were able to build quite efficient prediction models.
Although it might seem that our work is very similar to that of Kosker et al., there are numerous differences. We mined and manually verified real refactoring instances instead of using heuristics to determine which classes are refactored.
We also analyzed the values of static source code metrics of the refactored and non-refactored elements, but our focus was not on selecting the best predictors for building machine learning models, but to generally explore the connection between each and every metric and refactorings. Moreover, we examined 50+
metrics, which is almost the double that Kosker et al. used and also contain for example, cohesion and clone related metrics that were not examined by them.
ACCEPTED MANUSCRIPT
Furthermore, we applied a statistical approach instead of machine learning, and published results at the level of methods as well, not just for classes as Kosker et al did. A significant part of our work was dedicated to the analysis of the changes in metric values that was entirely omitted by Kosker et al.
In the study conducted by Silva et al. [20] the authors monitored Java projects on GitHub and asked the developers to explain the reasons behind their decision to refactor the code. They composed a set of 44 distinct motivations of 12 refactoring types such as “Extract reusable method” or “Introduce alterna- tive method signature” and found that refactoring activity is mainly triggered by changes in the requirements and much less by code smells. The authors also made the collected data and the tool called RefactoringMiner publicly available, which was used to detect the refactorings.
The case study by Ratzinger et al. [21] investigated the influence of refac- toring activities on software defects. The authors extracted refactoring and non-refactoring related features that represent several domains such as code measures, team and co-change aspects, or complexity that served as input to build prediction models for software defects. They found that the number of software defects decreased if the number of refactorings increased in the preced- ing time period.
Similarly to us, Murphy-Hill et al. [22] empirically analyzed how developers refactor in practice. They found that automatic refactoring is rarely used: 11%
by Eclipse developers and 9% by Mylyn developers. Unlike this paper, we did not focus on how refactorings are introduced (i.e. manually or using a tool), but rather on their effect on source code.
Negara et al. [23] conducted an empirical study considering both manual and automated refactoring. Using a continuous refactoring inference algorithm, they composed a corpus of 5,371 refactoring instances collected from developers working in their natural environment. According to their findings, more than half of the refactorings were performed manually, more than one third of the refactorings performed by developers were clustered in time, and 30% of the applied refactorings did not reach the version control system.
ACCEPTED MANUSCRIPT
The approach presented by Hoque et al. [24] investigates the refactoring activity as part of the software engineering process and not its effect on code quality. The authors found that it is not always true that there are more refac- toring activities before major project release dates than after. The authors were able to confirm that software developers perform different types of refactoring operations on test code and production code, specific developers are responsible for refactorings in the project and refactoring edits are not very well tested.
Tsantalis et al. [25] identified that refactoring decision-making and appli- cation is often performed by individual refactoring “managers”. They found a strong alignment between refactoring activity and release dates and revealed that the development teams apply a considerable amount of refactorings during testing periods.
Measuring clones (code duplications) and investigating how refactoring af- fects them has also attracted a lot of research effort. Our dataset also includes clone metrics, thus clone oriented refactoring examinations can also be per- formed.
Choi et al. [26] identified that merged code clone token sequences and differ- ences in token sequence lengths vary for each refactoring pattern. They found that “Extract method” and “Replace method with method object” refactorings are the most popular when developers perform clone refactoring.
Choi et al. [27] also presented an investigation of actual clone refactorings performed in open-source development. The characteristics of refactored clone pairs were also measured. From the results, they again confirmed that clone refactorings are mostly achieved by “Replace method with method object” and
“Extract method”.
We found that refactoring activities are not related to clone metrics signif- icantly in general. However, we did not distinguish our analysis based on the types of refactorings (due to the relatively small number of true positive refactor- ing instances), which might introduce new results for specific refactoring types that differ from the overall case.
An automated approach to recommend clones for refactoring by training a
ACCEPTED MANUSCRIPT
decision tree-based classifier was proposed by Wang et al. [28]. The approach achieved a precision of around 80% in recommending clone refactoring instances for each target system, and similarly good precision is achieved in cross-project evaluation. By recommending which clones are appropriate for refactoring, the approach allows for better resource allocation for refactoring itself after obtain- ing clone detection results.
Fowler informally linked bad code smells to refactorings and according to Beck, bad smells are structures in the code that suggest refactoring [1]. Despite that many studies showed that practitioners apply code refactoring differently, probably the most widespread approach in the literature to detect program parts that require refactoring is still the identification of bad smells.
Tourwé and Mens recommended a semi-automated approach based on logic meta programming to formally specify and detect bad smells and to propose ade- quate refactorings that remove these bad smells [29]. Another approach to point out structural weaknesses in object-oriented programs and solve them in an au- tomated fashion using refactorings was proposed by Dudziak and Wolak [30].
Tahvildari and Kontogiannis proposed a framework in which a catalog of object- oriented metrics was used as indicators to automatically detect where a particu- lar refactoring can be applied to improve software quality [31]. Szőke et al. [32]
introduced a tool called FaultBuster that identifies bad code smells using static source code analysis and automatically applies algorithms to fix selected code smells by refactoring.
Although RefFinder can detect 63 refactoring types from Fowler’s catalog and many studies used it to extract refactorings [27, 33, 34, 35], there are other approaches for refactoring detection in practice. A method by Godfrey and Zou [36] identified merge, split and rename refactorings using extended origin analysis in procedural code, which served as a basis of refactoring reconstruction by matching code elements. Demeyer et al. [37] proposed an approach that compares two program versions based on a set of lightweight, object-oriented metrics such as method size, class size, and the number of method calls within a method to detect refactorings. Rysselberghe and Demeyer exploited also clone
ACCEPTED MANUSCRIPT
detection to detect move refactorings [38]. Xing et al. [39] presented an ap- proach by analyzing the system evolution at the design level. They used a tool called UMLDiff to match program entities based on their name and structural similarity. However, the tool did not analyze method bodies, so it did not detect intra-method refactoring changes, such as a ’Remove Assignment To Parameter’.
The survey by Soares et al. [40] compared different approaches to detect refactorings in a pair of versions. They performed comparisons by evaluat- ing their precision and recall in randomly selected versions of JHotDraw and Apache Common Collections. The results showed that Murphy-Hill [22] (man- ual analysis) performed the best, but was not as scalable as the automated approaches. Ratzinger’s approach [21] is simple and fast, but it has low re- call; SafeRefactor [41] is able to detect most applied refactorings, although they get low precision values in certain circumstances. According to experiments, RefFinder has a precision of around 35% and a recall of 24%, which is similar to our evaluation results.
A history querying tool called QWALKEKO [42] was also applied to the problem of detecting refactorings. The main difference between QWALKEKO and RefFinder is that RefFinder is limited to reason about two predefined ver- sions while QWALKEKO is able to detect refactorings that happen across mul- tiple versions. Besides the ones presented above, many other approaches exist in the literature [43, 44, 45, 46, 47], however, our focus is not on refactoring miner tools, but to utilize refactoring instances found by those tools to analyze their connection with software maintainability in practice.
3. Dataset Construction
In order to support empirical research on source code refactorings, we built a manually validated dataset of the applied refactorings and source code metrics between two subsequent releases of 7 open-source Java systems available on GitHub. The dataset published here is the manually validated subset (from now onimproved dataset) of the one proposed in our previous paper (from now
ACCEPTED MANUSCRIPT
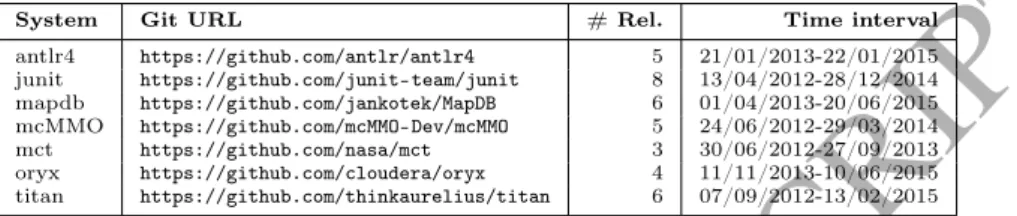
onbase dataset) [10]. Table 1 provides an overview of the projects, their names, URLs, number of analyzed releases and the covered time interval by the releases in the base dataset.
Table 1: Descriptive statistics of the systems included in the refactoring base dataset
System Git URL # Rel. Time interval
antlr4 https://github.com/antlr/antlr4 5 21/01/2013-22/01/2015 junit https://github.com/junit-team/junit 8 13/04/2012-28/12/2014 mapdb https://github.com/jankotek/MapDB 6 01/04/2013-20/06/2015 mcMMO https://github.com/mcMMO-Dev/mcMMO 5 24/06/2012-29/03/2014
mct https://github.com/nasa/mct 3 30/06/2012-27/09/2013
oryx https://github.com/cloudera/oryx 4 11/11/2013-10/06/2015 titan https://github.com/thinkaurelius/titan 6 07/09/2012-13/02/2015
To reveal refactorings between two adjacent release versions we used the RefFinder [11] refactoring reconstruction tool. In order to use RefFinder to automatically extract refactorings not just between two adjacent versions of a software but between each of the versions in a given version sequence we improved RefFinder to be able to perform an automatic batch analysis. To make further examinations possible, we also implemented an export feature in RefFinder that writes the revealed refactorings and all of their attributes into CSV files for each refactoring type.4 The base dataset is composed of the not validated output of RefFinder grouped by refactoring types (e.g. extract method, remove parameter) and the more than 50 types of source code metrics extracted by the SourceMeter static code analysis tool, mapped to the classes and methods of the systems. The full list of extracted source code metrics is available on the tool’s website.5 Instead of selecting several metrics to analyze, we applied all the statistical methods on each of the provided metrics, which include all the most widely used code metrics.
The refactoring types are different at the class and method levels: there are 23 refactoring types at class level, and 19 at method level. For a complete list of method and class-level refactorings see our previous paper [13]. Beyond the plain source code metrics the datasets include the so-called relative maintain-
4The corresponding code changes can be found in a pull-request to the original repository:
https://github.com/SEAL-UCLA/Ref-Finder/pull/1
5https://www.sourcemeter.com/resources/java/
ACCEPTED MANUSCRIPT
ability index (RMI) which was measured by QualityGate SourceAudit [48] for each method and class of the systems. RMI, similarly to the well-known main- tainability index [49], reflects the maintainability of a code element, but it is calculated using dynamic thresholds from a benchmark database, not by a fixed formula. Thus, RMI expresses the maintainability of a code element compared to the maintainability of other elements in the benchmark [50].
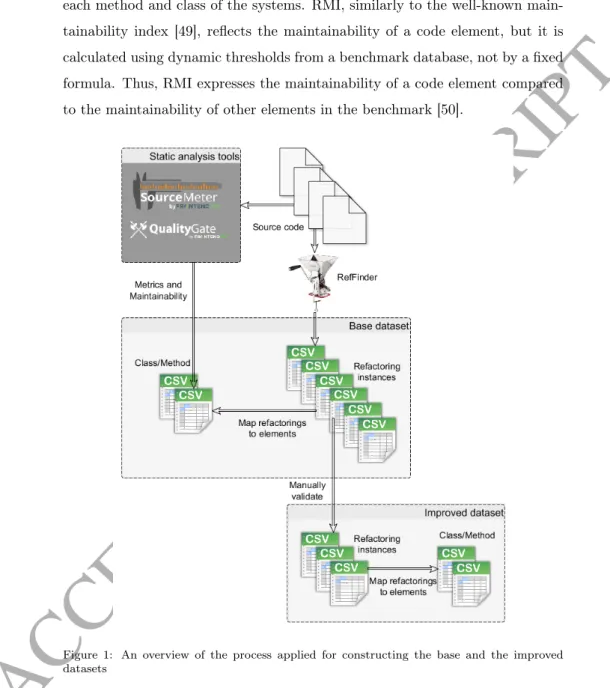
Figure 1: An overview of the process applied for constructing the base and the improved datasets
The high-level overview of the dataset creation process is shown in Figure 1.
First of all, the Java source code is processed by the extended RefFinder version that reveals and exports the refactoring instances to CSV files for each refactor-
ACCEPTED MANUSCRIPT
ing type. The source code is also analyzed by the SourceMeter and QualityGate tools to calculate the source code metrics and RMI values for each method and class of the input project. The base dataset is assembled by mapping the ex- tracted refactorings to the affected code elements and extending the output of static code analysis with the number of refactorings for each type that is mapped to the element.
To compose the improved dataset we performed a manual validation that resulted in a subset of the refactoring instances detected by RefFinder (i.e. we left only the true positive instances), then we mapped this validated subset of refactoring instances to the code elements again.
The datasets are available in thePROMISE data repository [51]:
http://openscience.us/repo/refactoring/refact.html http://openscience.us/repo/refactoring/refact_val.html
and also at the following location:
http://www.inf.u-szeged.hu/~ferenc/papers/RefactDataSet
3.1. Dataset Validation
As false positive instances may seriously affect the validity of empirical in- vestigations using the dataset, we decided to manually validate the refactoring instances extracted by RefFinder and propose an improved dataset. The raw output of the tool enumerates all the source code elements with path and line information in the source code versions before and after refactoring.
Listing 1: Sample Add Parameter output of RefFinder old method ; new method ; added parameter
removeAllConfigsNotInRuleStopState ()
@/ antlr4_base1 /.../ ParserATNSimulator . java :1027:1;
removeAllConfigsNotInRuleStopState ()
@/ antlr4_base2 /.../ ParserATNSimulator . java :846:1;
boolean : lookToEndOfRule
For example, if the tool reports an “Add Parameter” refactoring, the output contains the old method to which a new parameter is being added and the same
ACCEPTED MANUSCRIPT
method in the new version (where the new parameter is already present in the source code) as well as the name of the parameter that was added. Listing 1 shows a simplified “Add Parameter” sample output of RefFinder for theantlr4 system.
The evaluation process consisted of the following steps for each such refac- toring instance selected for manual validation:
1. We located the files affected by the actual refactoring instance both in the old and new versions.
2. We opened the old and new files in a diff viewer tool (Araxis6 or Win- Merge7) and located the source code elements enumerated in the refactor- ing instance by the reported line numbers and identifier names.
3. By doing a line-by-line code inspection the evaluators decided whether the reported instance is a true refactoring or not (adhering to the definition of the individual refactorings and comprehending the semantic meaning of the reviewed code parts).
Since it requires an enormous amount of human effort, we started by se- lecting one release from each of the 7 systems and validated every refactoring instance candidate proposed by RefFinder following the above described process.
The releases were selected to contain as many different types of refactorings as possible. We also kept in mind that the number of refactorings within each type has to be large enough in the releases given that some of them will be marked as false positives. We did not choose releases with huge amount of refactorings due to the necessity of an enormous validation effort.
Note, that we made a compromise in selecting the refactoring instances for validation. We chose to evaluate all instances between two selected releases for each of our subject systems. This resulted in an uneven proportion of validated
6https://www.araxis.com/
7http://winmerge.org/
ACCEPTED MANUSCRIPT
refactorings from system to system (e.g. we evaluated almost 58% of refactor- ing instances for oryx, but only about 2% for titan), see Table 2. Moreover, there are refactoring types from which we did not evaluate a single instance, Table 3 lists only those refactoring types that were encountered during manual validation (RefFinder is able to extract 23 different types of refactorings [13]).
The reason why we did this contrary to choosing for example, a fixed x% of refactoring instances for evaluation, is that it would not allow us to answer our research questions meaningfully. Validating a fixed proportion of refactorings for each system would not ensure a fully validated release for each system, in- stead we would end up with releases containing refactoring instances from a couple of which are manually validated and the rest are not. Analysis on such a dataset would be by no means more precise than using the base dataset, as the unvalidated instances might bias the statistical tests performed on the data between two releases of a system. As the manually validated subset of refactor- ing instances for analyzing our research questions is meaningful only if we have at least one fully validated release for each system, we made this compromise.
The validation was carried out by two of the authors of this paper. Un- fortunately, performing the evaluation in an optimal way, namely to examine all the possible refactoring instances by both of the authors, was not feasible due to our available resources. Instead, the authors distributed the refactorings between them nearly equally and they validated only their corresponding in- stances. This strategy reduced the amount of required human resources to half of the optimal strategy; however, it also introduced some issues. To mitigate the possible inconsistency in the judgment of the two authors, they performed a random sample cross-validation on about 10% of each other’s data. Addition- ally, in each and every problematic case all the authors of the paper (not just the two evaluators) mutually agreed on how those specific refactorings should be classified.
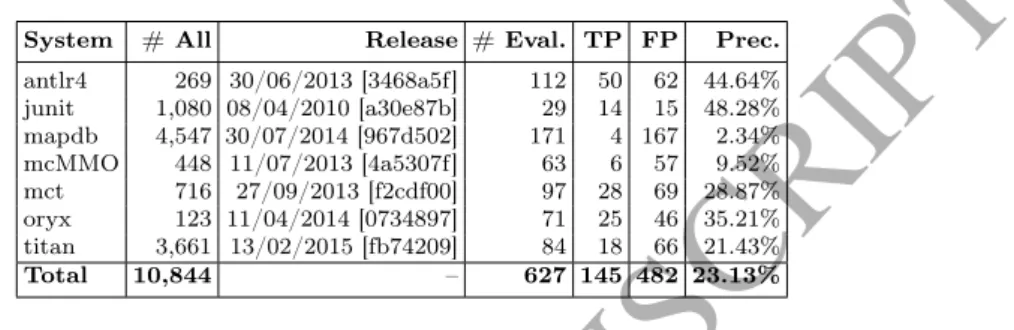
Table 2 shows the total number of refactoring instances found by RefFinder in all the releases of the systems (# All), the selected revisions for manual validation (Release), the number of manually validated instances per system
ACCEPTED MANUSCRIPT
(# Eval.), the number of true/false positive refactoring instances (TP and FP) and the overall precision of RefFinder on the analyzed systems (Prec.).
Table 2: Number of all and manually validated refactorings in each subject system with precision information
System # All Release # Eval. TP FP Prec.
antlr4 269 30/06/2013 [3468a5f] 112 50 62 44.64%
junit 1,080 08/04/2010 [a30e87b] 29 14 15 48.28%
mapdb 4,547 30/07/2014 [967d502] 171 4 167 2.34%
mcMMO 448 11/07/2013 [4a5307f] 63 6 57 9.52%
mct 716 27/09/2013 [f2cdf00] 97 28 69 28.87%
oryx 123 11/04/2014 [0734897] 71 25 46 35.21%
titan 3,661 13/02/2015 [fb74209] 84 18 66 21.43%
Total 10,844 – 627 145 482 23.13%
The evaluated release means that the refactoring instances between this and the previous release was considered for validation. As can be seen, only the fraction of the total number of refactorings has been validated (less than 6%).
Even this work took more than one person month work from the two authors.
However, as the overall precision of the RefFinder tool was only around 23% in total (and approximately 27% if we take the average of the system-wise precision values) on the base dataset, even these few hundred manually validated instances of the improved dataset bear a significant additional value compared to the base dataset. Considering the projects, we got the lowest precision value in case of mapdb and mcMMO resulting a relatively low number of refactorings in these projects.
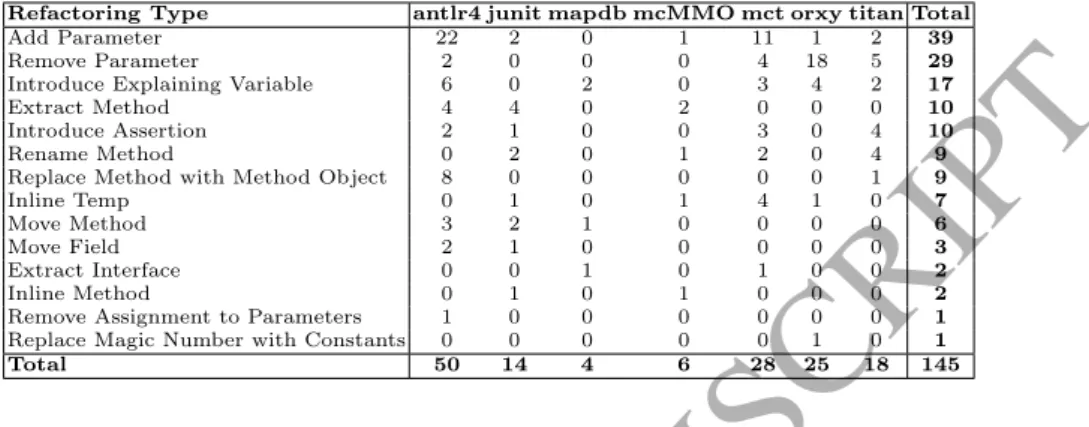
Table 3 summarizes the number of various refactoring types within each subject system. As can be seen, Add and Remove Parameter are the two most frequently applied refactorings types. Together with the third most common In- troduce Explaining Variable, they constitute nearly 60% of the total refactoring count. The majority of the Add Parameter refactoring is in the antlr4 system, while most of the Remove Parameter refactorings appear in oryx.
3.2. Dataset Structure
The improved dataset contains one folder for each release of the analyzed systems. Within each folder there are two files ($proj-Class.csv and $proj-
ACCEPTED MANUSCRIPT
Table 3: Total number of refactoring occurrences in the improved dataset grouped by their types
Refactoring Type antlr4 junit mapdb mcMMO mct orxy titan Total
Add Parameter 22 2 0 1 11 1 2 39
Remove Parameter 2 0 0 0 4 18 5 29
Introduce Explaining Variable 6 0 2 0 3 4 2 17
Extract Method 4 4 0 2 0 0 0 10
Introduce Assertion 2 1 0 0 3 0 4 10
Rename Method 0 2 0 1 2 0 4 9
Replace Method with Method Object 8 0 0 0 0 0 1 9
Inline Temp 0 1 0 1 4 1 0 7
Move Method 3 2 1 0 0 0 0 6
Move Field 2 1 0 0 0 0 0 3
Extract Interface 0 0 1 0 1 0 0 2
Inline Method 0 1 0 1 0 0 0 2
Remove Assignment to Parameters 1 0 0 0 0 0 0 1
Replace Magic Number with Constants 0 0 0 0 0 1 0 1
Total 50 14 4 6 28 25 18 145
Method.csv) and a sub-folder containing a list of CSV (Comma Separated Val- ues) files named by refactoring types. The CSV files with the names of refac- torings (e.g. ADD_PARAMETER) lists only the true positive refactoring in- stances found by RefFinder and manually checked by one of the authors. The structure of these CSV files may differ based on the refactoring types, but they always contain enough information to uniquely identify the entities affected by the refactoring in the previous and actual releases (e.g. unique name, path of classes/methods, parameters or line information). The$proj-Class.csv and
$proj-Method.csv files hold an accumulated result of the above.
Each line of these CSV files represents a class or method in the system (identified in the same way as in the refactoring CSVs). In the columns of the CSV, there are the source code metrics with the RMI scores and the various refactoring types. For each row we have the source code metrics calculated for this element and the number of refactorings of a certain type affecting the source code element (i.e. the source code element appears in the refactoring type CSV in an arbitrary role).
4. Data Analysis Methodology
To investigate our research questions we utilized the improved dataset in the following ways.
ACCEPTED MANUSCRIPT
Answering RQ1: Are source code elements with lower maintainability subject to more refactorings in practice? To check if there are significant differences in the maintainability of the refactored and non-refactored elements, we took all the RMI values in releasexi−1for each system, wherexi is the release selected for manual validation. We formed two groups by RMI values based on the fact if a corresponding source code entity was affected by any refactorings in release xi. So we mapped the source code entities (i.e. classes and methods) from versionxi−1 to xi and put all the RMI values for the entities in xi−1 into the not affected group if the entity had zeros in all refactoring columns inxi, other- wise we put the RMI values of the entity into the affected group. Once we had these two groups we run a Mann-Whitney U test [52], which is a non-parametric statistical test to analyze whether the distribution of the values differ signifi- cantly between two groups. The p-value of the test helped us judging whether there is significant difference in the maintainability values between the source code entities subjected to refactoring and the entities unaffected by refactoring.
Moreover, we used the mean rank values produced by the test to decide the direction of the differences, namely whether the maintainability value is lower or higher within one of the groups. To assess the volume of the differences, we calculated the so-called Cliff’sδnon-parametric effect size measure as well [53].
Answering RQ2: What are the typical values of source code metrics of the refactored and non-refactored elements and how do they change upon refactor- ings? To analyze the differences in the metric values, we followed a very similar approach to that of answering RQ1. We formed the two groups in the same way as before, but instead of the RMI values, we run the Mann-Whitney U test on each and every source code metric of the refactored and non-refactored classes and methods. With this test we could identify those source code metrics that are significantly different in the refactored group compared to the elements unaffected by refactorings (from now on, we refer to this test as M W UP rev).
To study the effect of code refactoring as well, we calculated the metric differ- ences between versionsxi−1 and xi and run the Mann-Whitney U test on the differences as well (from now on, we refer to this test as M W UDif f). Since
ACCEPTED MANUSCRIPT
refactorings aim at improving the internal code structure, we were interested in whether we can observe more significant changes of the metrics in the refactored elements or not. To get a high-level overview of the most important source code metrics, we counted the number of cases (for the 7 different subject systems) when there were significant differences both in the metric values before the refactoring and in the amount of metric change after the refactoring in a source code element. We also counted the number of cases where only one of the test produced significant results (i.e. only the metric values before the refactoring or the amount of change for a metric value differed significantly in the refactored group). To assess the effect sizes in case of significant differences, we calculated the Cliff’sδ measures here as well.
5. Results
5.1. Maintainability Analysis
RQ1 – Are source code elements with lower maintainability subject to more refactorings in practice?
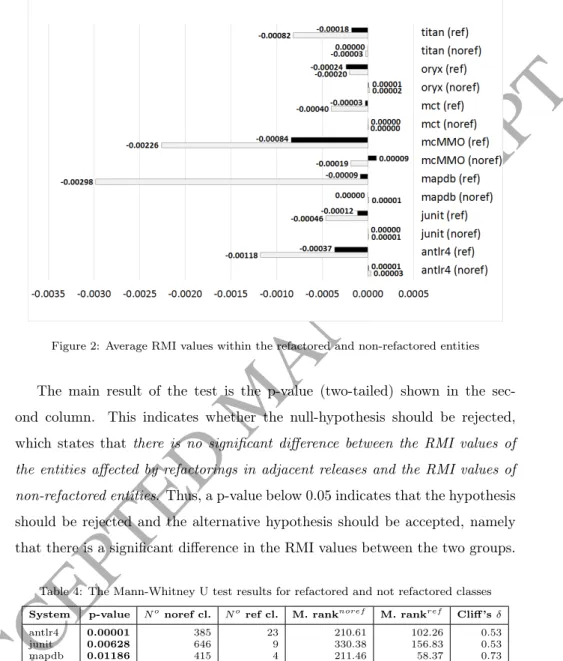
As described in the previous section, for answering RQ1 we divided the methods and classes of the systems into two groups. The first group was formed out of the entities affected by at least one refactoring between the two releases we validated. The second group contained all the other entities (i.e. the ones being untouched by refactorings between the releases). Figure 2 depicts the average RMI values of the entities falling into these groups. Light gray columns denote the average RMI values within methods, while black color is for classes.
Theref and noref marks next to the systems stand for the two groups, ref is the first group of entities (i.e. the ones affected by refactorings) and noref is the second group.
To formally evaluate whether there is a difference in the maintainability values we performed a Mann-Whitney U test on the RMI values of the two groups defined above. We executed the test on each system both for the groups of classes and methods. Tables 4 and 5 summarize the results of the test runs.
ACCEPTED MANUSCRIPT
Figure 2: Average RMI values within the refactored and non-refactored entities
The main result of the test is the p-value (two-tailed) shown in the sec- ond column. This indicates whether the null-hypothesis should be rejected, which states that there is no significant difference between the RMI values of the entities affected by refactorings in adjacent releases and the RMI values of non-refactored entities. Thus, a p-value below 0.05 indicates that the hypothesis should be rejected and the alternative hypothesis should be accepted, namely that there is a significant difference in the RMI values between the two groups.
Table 4: The Mann-Whitney U test results for refactored and not refactored classes System p-value No noref cl. Noref cl. M. ranknoref M. rankref Cliff’sδ
antlr4 0.00001 385 23 210.61 102.26 0.53
junit 0.00628 646 9 330.38 156.83 0.53
mapdb 0.01186 415 4 211.46 58.37 0.73
mcMMO 0.27604 85 4 45.65 31.25 0.32
mct 0.00000 2013 15 1019.94 284.60 0.73
oryx 0.04467 489 15 254.78 178.13 0.30
titan 0.00009 1145 13 583.61 217.50 0.63
To tell something about which group has higher RMI values, thus better maintainability, we should observe the mean ranks. The column Mean ranknoref
ACCEPTED MANUSCRIPT
displays the mean ranks in the not refactored groups, while Mean rankref shows the mean rank values within the refactored groups. If the mean rank value of one group is higher, it means the RMI values in that group are significantly higher than in the other group. We report Cliff’s δ values as well in the last columns, which measure how often the values in one distribution are larger than the values in another distribution. It ranges from -1 to 1 and is linearly related to the Mann-Whitney U statistic, however it captures the direction of the difference in its sign as well. Simply speaking, if Cliff’sδ is a positive number, the maintainability values are higher in the non-refactored group, while negative value means that RMIs are higher in the refactored group. The closer the|δ|is to 1, the more values are larger in one group than the values in the other group.
Table 5: The Mann-Whitney U test results for refactored and not refactored methods System p-value Nonoref mth. Noref mth. M. ranknoref M. rankref Cliff’sδ
antlr4 0.00000 3104 40 1583.10 750.16 0.53
junit 0.00466 2253 12 1135.84 600.21 0.47
mapdb 0.20610 3358 3 1681.63 973.00 0.42
mcMMO 0.06529 813 5 410.69 215.40 0.48
mct 0.00346 11068 16 5545.88 3205.34 0.42
oryx 0.00034 2333 19 1181.03 620.82 0.48
titan 0.00530 7950 17 3987.32 2431.26 0.39
5.2. Source Code Metrics Analysis
RQ2 – What are the typical values of source code metrics of the refactored and non-refactored elements and how do they change upon refactorings?
To find those properties that are significantly different of the refactored and non-refactored source code elements, we performed a Mann-Whitney U test according to the methodology described in Section 4. We used source code metrics to describe source code properties extracted by the SourceMeter static code analysis tool (the extraction process is highlighted in Section 3).
The possible differences in the distribution of source code metrics may help to shed light on the main characteristics of refactoring targets in practical de- velopment. As we saw in Section 5.1, the maintainability values are significantly lower in the source code elements targeted by refactorings. As the maintainabil- ity value is derived from source code metrics, it suggests that developers tend
ACCEPTED MANUSCRIPT
to (consciously or unconsciously) pay attention to some source code properties finding refactoring candidates. To get a more detailed picture of this, we ana- lyzed all the 52 class-level and 17 method-level metrics regarding two aspects.
First, how do their distributions differ within the source code elements that are refactored from one version to another and those that are not (testM W UP rev).
Second, how do the metric change distributions differ between the refactored and non-refactored elements from one version to another (M W UDif f).
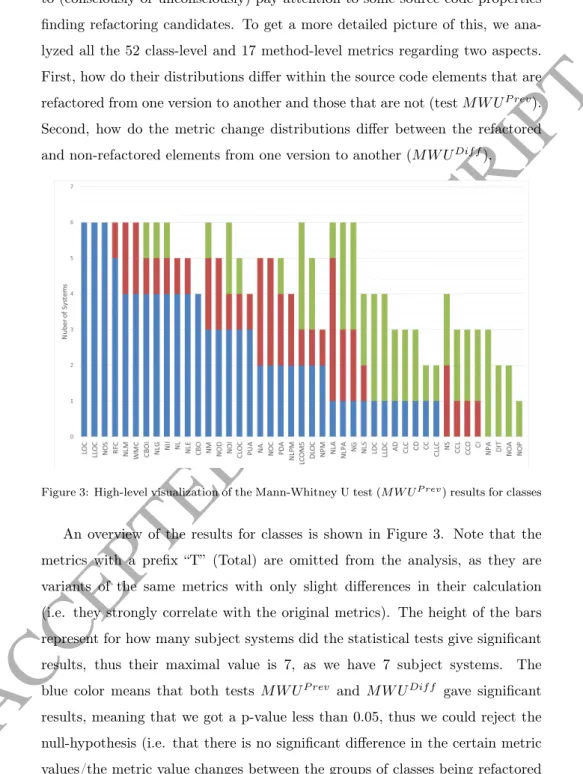
Figure 3: High-level visualization of the Mann-Whitney U test (M W UP rev) results for classes
An overview of the results for classes is shown in Figure 3. Note that the metrics with a prefix “T” (Total) are omitted from the analysis, as they are variants of the same metrics with only slight differences in their calculation (i.e. they strongly correlate with the original metrics). The height of the bars represent for how many subject systems did the statistical tests give significant results, thus their maximal value is 7, as we have 7 subject systems. The blue color means that both tests M W UP rev and M W UDif f gave significant results, meaning that we got a p-value less than 0.05, thus we could reject the null-hypothesis (i.e. that there is no significant difference in the certain metric values/the metric value changes between the groups of classes being refactored
ACCEPTED MANUSCRIPT
and those of not being refactored). Red color marks the number of cases where only testM W UP revresulted in significant p-value, while green color means the same for test M W UDif f. That is, in case of red bars only the metric values differ significantly between the classes being refactored later and those of not, while the amount of changes in this metric between the two versions do not differ significantly. Green bars mark the opposite, where there is no significant difference in the bare metric values, but the amount of changes for that specific metric differs significantly between the refactored and non-refactored classes.
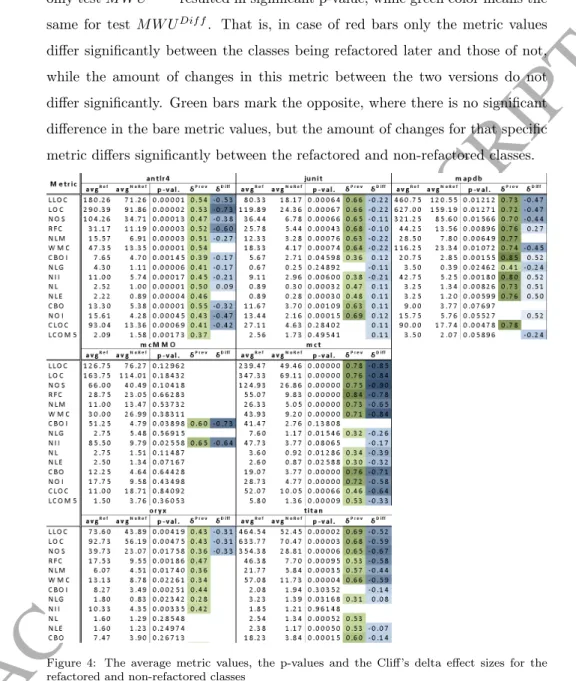
Figure 4: The average metric values, the p-values and the Cliff’s delta effect sizes for the refactored and non-refactored classes
To see also the likely direction of the differences in the values as well, we col- lected the main characteristics of the most relevant metrics (i.e. those showing the strongest connection with refactorings) in Figure 4. The table contains five
ACCEPTED MANUSCRIPT
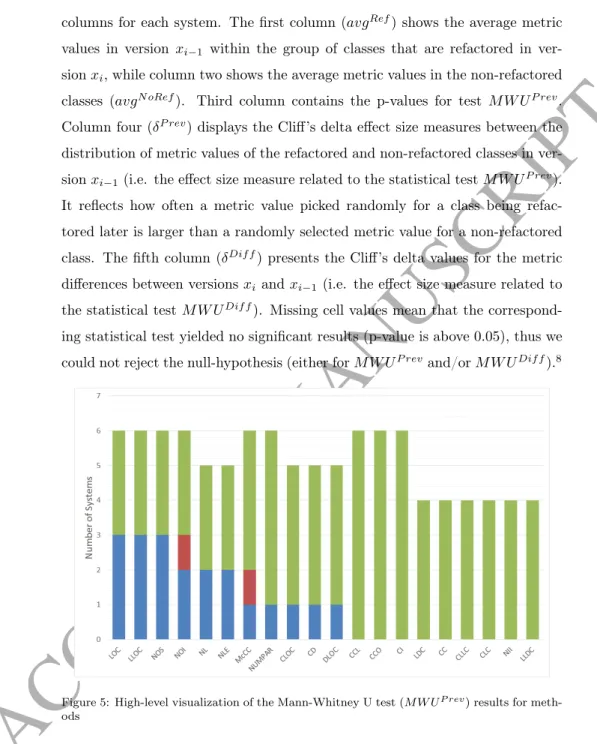
columns for each system. The first column (avgRef) shows the average metric values in version xi−1 within the group of classes that are refactored in ver- sionxi, while column two shows the average metric values in the non-refactored classes (avgN oRef). Third column contains the p-values for test M W UP rev. Column four (δP rev) displays the Cliff’s delta effect size measures between the distribution of metric values of the refactored and non-refactored classes in ver- sionxi−1(i.e. the effect size measure related to the statistical testM W UP rev).
It reflects how often a metric value picked randomly for a class being refac- tored later is larger than a randomly selected metric value for a non-refactored class. The fifth column (δDif f) presents the Cliff’s delta values for the metric differences between versionsxi and xi−1(i.e. the effect size measure related to the statistical testM W UDif f). Missing cell values mean that the correspond- ing statistical test yielded no significant results (p-value is above 0.05), thus we could not reject the null-hypothesis (either forM W UP revand/orM W UDif f).8
Figure 5: High-level visualization of the Mann-Whitney U test (M W UP rev) results for meth- ods
8The exact p-values for all the tests can be found in the online appendix available at http://www.inf.u-szeged.hu/~ferenc/papers/RefactDataSet/
ACCEPTED MANUSCRIPT
The color codes express the magnitude of the effect sizes, darker cell values (green for the metric values, blue for the metric value differences) indicate larger effect sizes.
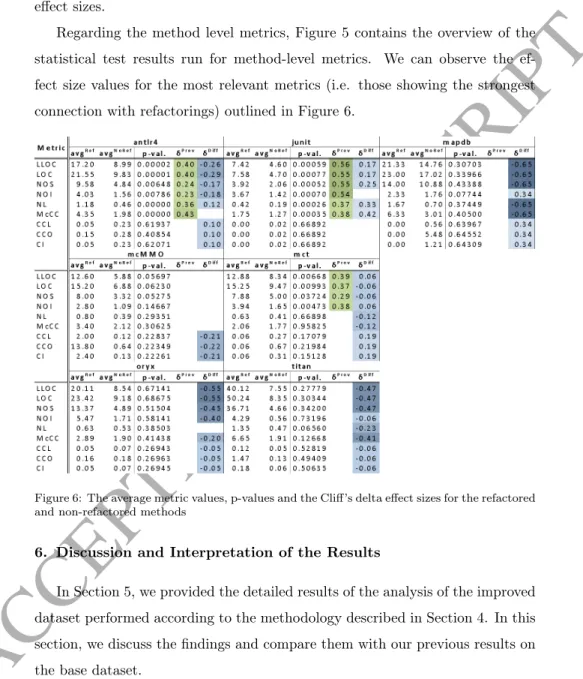
Regarding the method level metrics, Figure 5 contains the overview of the statistical test results run for method-level metrics. We can observe the ef- fect size values for the most relevant metrics (i.e. those showing the strongest connection with refactorings) outlined in Figure 6.
Figure 6: The average metric values, p-values and the Cliff’s delta effect sizes for the refactored and non-refactored methods
6. Discussion and Interpretation of the Results
In Section 5, we provided the detailed results of the analysis of the improved dataset performed according to the methodology described in Section 4. In this section, we discuss the findings and compare them with our previous results on the base dataset.
ACCEPTED MANUSCRIPT
6.1. RQ1 – Are source code elements with lower maintainability subject to more refactorings in practice?
6.1.1. Interpretation of the Results for Classes and Methods
As can be seen in Figure 2, all the average maintainability values of the refactored group (regardless whether for classes or methods) is much lower than the non-refactored group. What is more, almost all the average maintainability values for non-refactored classes and methods are positive (except for titan and classes of mcMMO), while the values related to refactored entities are negative.
By the nature of its calculation, the sign of the RMI value captures the fact whether a source code element increases the overall maintainability or decreases it. Thus an RMI value of 0 has a special meaning, namely that the maintainabil- ity of a source code element (be it a class or a method) with 0 RMI is exactly as good as the system’s average maintainability [50]. This implicates that positive RMI value means above average maintainability, negative RMI means maintain- ability below the average, which makes it intuitive that the source code entities targeted by refactorings have lower maintainability than the average.
The formal justification of this can be interpreted from the results in Tables 4 and 5. As can be seen all the p-values are well below 0.05 (highlighted with bold letters), except for mcMMO and mapdb at method granularity. We already showed in Table 3 that the precision of RefFinder is very low on these systems for some reason, thus the number of available true positive refactoring instances is also very low in the improved dataset. To make it even worse, for mcMMO the 6 refactorings are located in just 4 classes further reducing the number of cases (columns two and three display the number of classes/methods not affected by refactorings and those of affected, respectively). This low number of samples for one group might be the reason for the higher p-values. Nonetheless, it poses a question about the reliability of the other tests as well, as the number of samples in the two groups are highly unbalanced in most of the cases. However, the Mann-Whitney U test is designed to work well in such unbalanced sets as well [52], using the exact distribution of the small sized samples. Thus,
ACCEPTED MANUSCRIPT
in general, we can conclude that according to the statistical test, there is a significant difference in the RMI values between the source code entities being refactored and the entities not affected by any refactorings.
In each row of both tables (Tables 4 and 5), the mean ranks of refactored group are lower than the not refactored group and all the Cliff’s δ values are positive, which means that the maintainability values of not refactored elements are higher, thus in general, elements targeted by refactorings typically have lower maintainability. So based on these numbers, we can say thatthe maintainability of source code entities subjected to refactorings is significantly lower than the maintainability of not refactored entities.
6.1.2. Comparison With the Base Dataset Results
In a previous study [13] we already presented preliminary results on the connection of code maintainability and refactoring. For that study, we used the original, not validated base dataset containing refactoring instances extracted by RefFinder as is. Since we learned that the precision of RefFinder is quite low, and we created a manually validated, improved subset of the original dataset, it is an interesting question how the new analysis results relate to previous results.
At first, we examined the Spearman’s correlation between the RMI and the number of refactorings affecting the source code elements. The previously pub- lished results can be seen in Figure 7 (the various gray bars mark the calculated correlation between the different versions of a system). There is a clear inverse correlation between RMI and the number of refactorings for both classes and methods. That is, the lower the maintainability of a source code element, the more refactorings touch it. We replicated the very same correlation analysis on the manually validated subset of data, and the results are shown in Ta- ble 6. Since we have validated data for one version of each subject system (i.e.
refactorings are validated between two selected versions), we present only two correlation coefficients for each system, one for the connection between class- level RMI scores and the number of refactorings affecting the classes, and one for the same connection at method level.
We can observe the very same inverse correlations, though the coefficients are
ACCEPTED MANUSCRIPT
Figure 7: Correlation of maintainability (RMI) and number of refactorings in classes and methods calculated on the base dataset [13]
slightly lower than those calculated on the base dataset and in case of mcMMO at class level and mapdb at method level, the p-values are well above 0.05. The p-values are almost the same as the ones presented for the Mann-Whitney U tests (see the detailed discussion and reasoning about them in Section 5.1). Even the tendency that method level coefficients are smaller than class level values is the same. The reason behind the lower coefficients on the improved dataset might be due to the smaller sample sizes. Thus, we can say that the early results seem to remain valid after using the improved dataset. In addition, in Section 5.1 we confirmed that there is a statistically significant difference in the
ACCEPTED MANUSCRIPT
Table 6: Spearman’s correlation coefficients between RMI and refactoring numbers on the improved dataset (significant values are marked with bold)
System Class Method
Coeff. p-value Coeff. p-value antlr4 -0.21163 0.00002 -0.10281 0.00000 junit -0.10665 0.00629 -0.05947 0.00464 mapdb -0.12297 0.01176 -0.02181 0.20615 mcMMO -0.11661 0.27649 -0.06449 0.06526 mct -0.10760 0.00000 -0.02778 0.00345 oryx -0.08828 0.04762 -0.07381 0.00034 titan -0.11507 0.00009 -0.03125 0.00528
maintainability scores of the refactored and non-refactored source code elements (both at class and method level) with a Mann-Whitney U test. What is more, we also showed that effect size values range from medium to high, and their direction confirms that source code elements to be refactored are likely to have smaller maintainability scores than elements not refactored between the two versions.
6.2. RQ2 – What are the typical values of source code metrics of the refactored and non-refactored elements and how do they change upon refactorings?
6.2.1. Interpretation of the Results for Classes
The first blue bar in Figure 3 means that the LOC (Lines Of Code) metric and its changes showed a significant difference between the refactored and non- refactored group of classes for 6 out of the 7 subject systems. If we examine the direction of this difference (i.e. the effect sizes shown in Figure 4), we can even see that the LOC values of refactored classes are significantly larger in all 6 cases. Thus, developers tend to select and refactor large classes, what is not surprising. LLOC (Logical Lines Of Code) and NOS (Number of Statements) are also size metrics (and strongly correlate with LOC), thus their strong effect is also not surprising.
Another group of metrics showing clear patterns is the coupling metrics:
RFC (Response set For a Class), CBO (Coupling Between Object classes),
ACCEPTED MANUSCRIPT
CBOI (Coupling Between Object classes Inverse), NII (Number of Incoming Invocations) and NOI (Number of Outgoing Invocations). The three colored bar for CBOI (i.e. the number of other classes, which directly use a class) means that in 4 out of 7 cases both the metric values and their changes showed a significant difference, while in 1-1 case only the metric values or their changes showed a significant difference between the refactored and non-refactored group of classes. Red cases might suggest that developers consider the given metric to decide which classes to refactor, however, the aim of the refactoring is not (primarily) to improve the given characteristic of the code. Green cases suggest just the opposite, namely that developers do not consider the value of a given metric as a major factor in deciding what classes to refactor, but (intentionally or not) by refactoring a class, they change these properties in a significant way.
The third group of metrics with remarkable patterns are the complexity metrics: WMC (Weighted Methods per Class), NL (Nesting Level) and NLE (Nesting Level Else-If). For all three metrics in 4 out of 7 systems we found significant differences both in the metric values and their changes, while in 2 and 1 cases (for WMC, and NL, NLE, respectively) only the metric values differed between the refactored and non-refactored group of classes. The comment, code clone related and inheritance metrics do not show clear patterns, most of them have only (quite low) green bars.
Looking at the direction of the above discussed differences it is remarkable in Figure 4 that all the available δP rev values are positive, which reflects that the appropriate metric values in the refactored group is much likely to be larger than in the non-refactored group. Although most of the values reflect a medium level effect size, such high values like 0.85 (CBOI for mapdb) and 0.84 (RFC for mct) also appear. It suggests that coupling is one of the main factors that developers consider when they select the targets for refactoring (which is in line with other research results [17]). Very similar phenomenon applies to size (i.e.
LLOC, LOC, NOS) and complexity (i.e. WMC, NL, NLE) metrics in general.
An interesting observation can be made in connection with the CLOC (Com- ment Lines Of Code) metric. It measures the amount of comments in a class,
ACCEPTED MANUSCRIPT
and for 5 out of the 7 systems its average value is larger in the classes that are refactored in version xi (it is even true for the CD – Comment Density metric – for 4 out of 7 cases). Thus, developers refactor classes with more comments, which might seem to be a contradiction at first glance. However, comments are often outdated, misleading or simply comment out unnecessary code, which are all indicators of poor code quality, thus refactoring is justified.
Another interesting question is how refactorings affect the changes of these metric values, do developers intend to control the growth of some metrics with refactorings or not? To analyze this, we observed the values in columnδDif f. One could expect negative values here, which would indicate that the metric value changes are significantly larger in the non-refactored classes (thus eroding much faster due to development [54]). Actually, exactly this pattern can be observed with only a few exceptions (some junit and mapdb complexity and coupling metrics).
The contradictory values in mapdb and the lots of missing values in the mcMMO system (due to not significant test results) are likely to be caused by the very small number of source code elements falling into the refactored group.
Thus, the number of metric differences we can use is also too small, so hectic or not significant results might occur with higher probability. For the oryx system, many metric values did not change between the two versions, thus we encoun- tered many 0 diff values, which caused the tests to fail in deriving significant results. However, despite the few exceptions, it still quite spectacular that the size, complexity and coupling metrics grow much faster in the non-refactored classes than in the classes subjected to refactoring. This might suggest that de- velopers not just select refactoring targets based on these source code properties, but try to manage and keep these values under control by applying refactorings.
On one hand, we can observe a more or less clear pattern in the presented metrics, namely that the metric values tend to be significantly higher in the classes that are the targets of later code refactorings and the metric values tend to grow much slower (or even decrease) for these classes compared to the non- refactored ones. On the other hand, we did not find metrics that would show the
![Figure 7: Correlation of maintainability (RMI) and number of refactorings in classes and methods calculated on the base dataset [13]](https://thumb-eu.123doks.com/thumbv2/9dokorg/1318344.106247/31.892.213.722.220.732/figure-correlation-maintainability-refactorings-classes-methods-calculated-dataset.webp)
