Edited by:
Kevin R. Theis, Wayne State University, United States
Reviewed by:
Beza Ramasindrazana, Institut Pasteur de Madagascar, Madagascar Kendra Phelps, EcoHealth Alliance, United States
*Correspondence:
Clifton D. McKee clifton.mckee@colostate.edu Aleksandra I. Krawczyk aleksandra.krawczyk@rivm.nl
†These authors have contributed equally to this work
Specialty section:
This article was submitted to Coevolution, a section of the journal Frontiers in Ecology and Evolution
Received:26 November 2018 Accepted:22 February 2019 Published:26 March 2019
Citation:
McKee CD, Krawczyk AI, Sándor AD, Görföl T, Földvári M, Földvári G, Dekeukeleire D, Haarsma A-J, Kosoy MY, Webb CT and Sprong H (2019) Host Phylogeny, Geographic Overlap, and Roost Sharing Shape Parasite Communities in European Bats. Front. Ecol. Evol. 7:69.
doi: 10.3389/fevo.2019.00069
Host Phylogeny, Geographic Overlap, and Roost Sharing Shape Parasite Communities in European Bats
Clifton D. McKee1,2,3*†, Aleksandra I. Krawczyk4*†, Attila D. Sándor5, Tamás Görföl6, Mihály Földvári7,8, Gábor Földvári9,10, Daan Dekeukeleire11, Anne-Jifke Haarsma12,13, Michael Y. Kosoy3, Colleen T. Webb1,2and Hein Sprong4
1Graduate Degree Program in Ecology, Colorado State University, Fort Collins, CO, United States,2Department of Biology, Colorado State University, Fort Collins, CO, United States,3Division of Vector-Borne Diseases, Centers for Disease Control and Prevention, Fort Collins, CO, United States,4Centre for Zoonoses and Environmental Microbiology, Centre for Infectious Disease Control, National Institute for Public Health and the Environment, Bilthoven, Netherlands,5Department of Parasitology and Parasitic Diseases, University of Agricultural Sciences and Veterinary Medicine Cluj-Napoca, Cluj-Napoca, Romania,6Department of Zoology, Hungarian Natural History Museum, Budapest, Hungary,7Department of Evolutionary Zoology and Human Biology, University of Debrecen, Debrecen, Hungary,8Department of Research and Collections, Natural History Museum, University of Oslo, Oslo, Norway,9Department of Parasitology and Zoology, University of Veterinary Medicine, Budapest, Hungary,10Evolutionary Systems Research Group, Centre for Ecological Research, Hungarian Academy of Sciences, Tihany, Hungary,11Terrestrial Ecology Unit, Department of Biology, Ghent University, Ghent, Belgium,
12Department of Animal Ecology and Physiology, Radboud University, Nijmegen, Netherlands,13Endless Forms Group, Naturalis Biodiversity Center, Leiden, Netherlands
How multitrophic relationships between wildlife communities and their ectoparasitic vectors interact to shape the diversity of vector-borne microorganisms is poorly understood. Nested levels of dependence among microbes, vectors, and vertebrate hosts may have complicated effects on both microbial community assembly and evolution. We examined Bartonella sequences from European bats and their ectoparasites with a combination of network analysis, Bayesian phylogenetics, tip- association and cophylogeny tests, and linear regression to understand the ecological and evolutionary processes that shape parasite communities. We detected seven bat–
ectoparasite–Bartonella communities that can be differentiated based on bat families and roosting patterns. Tips of theBartonella tree were significantly clustered by host taxonomy and geography. We also found significant evidence of evolutionary congruence between bat host and Bartonella phylogenies, indicating that bacterial species have evolved to infect related bat species. Exploring these ecological and evolutionary associations further, we found that sharing of Bartonella species among bat hosts was strongly associated with host phylogenetic distance and roost sharing and less strongly with geographic range overlap. Ectoparasite sharing between hosts was strongly predicted by host phylogenetic distance, roost sharing, and geographic overlap but had no additive effect onBartonellasharing. Finally, historicalBartonellahost-switching was more frequent for closely related bats after accounting for sampling bias among bat species. This study helps to disentangle the complex ecology and evolution ofBartonella bacteria in bat species and their arthropod vectors. Our work provides insight into the important mechanisms that partition parasite communities among hosts, particularly the effect of host phylogeny and roost sharing, and could help to elucidate the evolutionary patterns of other diverse vector-borne microorganisms.
Keywords:Bartonella, ectoparasites, disease ecology, parasite communities, host-switching, network analysis
INTRODUCTION
The enormous complexity of natural communities results from the large number of coexisting species and the diverse and unequal strengths of their interactions. Parasites, including macroparasites (e.g., worms and arthropods) and microparasites (e.g., bacteria and viruses), are an integral component of natural communities. Parasitism is a widespread life history strategy used by approximately one-third to over one-half of all species (Poulin, 2014; Morand, 2015). These parasitic organisms are under selective pressure to optimize their life history traits to efficiently colonize and reproduce in or on their hosts. This process of developing host specificity can be complicated, however, when there are several layers of parasitism. Such is the case for vector-borne microorganisms.
For these organisms, selection can occur in both the host and the vector. When combined with host-associated selection on vectors, vector-borne microbes may exhibit complicated patterns of host and vector associations and phylogenetic differentiation.
In light of this, classic models of parasite cospeciation and host-switching (de Vienne et al., 2013) must give way to novel approaches that examine the contributions of both hosts and vectors to the evolution and community assembly of vector-borne microorganisms.
Examining these processes is fundamental to understanding microbial diversity and surveillance of vector-borne microorganisms (Braks et al., 2011). Vectors vary in their host specificity, potentially leading to transmission of microorganisms to atypical hosts including humans. Vector- borne microorganisms account for a substantial proportion of emerging infectious diseases worldwide (Jones et al., 2008), and the zoonotic potential of mammalian viruses has been positively linked with being vector-borne (Olival et al., 2017). Knowledge of associations between microbes, hosts, and vectors will help to understand how humans become exposed to zoonotic agents and mitigate these risks. Thus, disentangling the ecological and evolutionary relationships between microorganisms and their hosts and vectors is important for managing the potential spillover of zoonotic agents to humans.
Disentangling these complex ecological and evolutionary processes requires sampling and analytical methods that integrate across trophic levels. If sampling is done across multiple ectoparasites and hosts, we can characterize the strength of host–parasite associations and identify host–vector–microbe communities using network-based approaches. Knowledge of these communities would directly facilitate disease management and the prevention of spillover events. For instance, hosts or vectors that have high infection prevalence or are connected with a large number of other nodes in the tripartite host–vector–
microbe network may be targeted for pathogen surveillance or vector control. Looking at patterns of microbe sharing among hosts, we can highlight factors that constrain microbial host range using multiple regression, including host phylogenetic distance, vector sharing, geographic range overlap, and roost sharing as covariates (Streicker et al., 2010; Willoughby et al., 2017). Finally, we can examine how biases in historical microbial host-switching result in the observed congruence between host and microbial phylogenies (Charleston and Robertson, 2002).
To understand how complex host–vector–microbe communities are assembled and maintained in nature, we examined the associations of Bartonella spp. bacteria and ectoparasitic arthropods with their bat hosts using compiled data from nine European countries. We argue that Bartonella infections in bats and their ectoparasites represent an ideal system for understanding these complexities, first because Bartonella infections are prevalent and genetically diverse in many bat species studied to date (McKee et al., 2016; Stuckey et al., 2017b), providing rich data with which to analyze complex patterns. Second, bats are present on all continents except Antarctica and have traits that favor parasite transmission and geographic spread, including flight and long life spans.
Many bat species are highly social and may form large colonies (Kerth, 2008), frequently co-roosting with other species, which could facilitate cross-species parasite transmission. Third, bats are a phylogenetically ancient lineage (Shi and Rabosky, 2015; Foley et al., 2016), allowing extended time for microbes and ectoparasites to develop host specificity. Finally, bats have many ectoparasites that vary in host specificity, ranging from highly specific wing mites (Bruyndonckx et al., 2009) to more generalist vectors like ticks (Hornok et al., 2016, 2017), which could have opposing effects on the evolution of host specificity in microorganisms they transmit. Such ectoparasite life history traits can interact with bat social systems in shaping microbial transmission (van Schaik et al., 2015). All these forces may combine to generate complex host–vector–microbe communities over evolutionary time but may be predictable given sufficient data and appropriate analytical methods.
Moreover, bats are a highly threatened group of wildlife species, play central roles in ecosystems, and deliver valuable ecosystem services such as pollination and pest control (Boyles et al., 2011;
Kunz et al., 2011); thus, ecological and evolutionary information on parasites could be informative for bat conservation and ecosystem sustainability (Whiteman and Parker, 2005; van Schaik et al., 2018). In addition to these factors, there are outstanding questions regarding the forces that driveBartonella evolution in bats. Previous work has shown that the phylogeny of bat-associatedBartonella lineages is congruent with the bat host phylogeny (Lei and Olival, 2014), andBartonellalineages tend to cluster by bat suborders and families (McKee et al., 2016). This previous work indicates thatBartonellaspecies have developed some level of host specificity; however, the relative influence of ectoparasites and the biogeography of bat hosts on bat–Bartonellaassociations remain unclear.
Lastly, recent studies have highlighted the zoonotic potential of bat-associatedBartonellaspecies.Bartonellaspp. infections in humans and domestic animals can lead to symptoms ranging from mild fever to potentially life-threatening endocarditis (Chomel and Kasten, 2010). In one case of human endocarditis, the etiological agent was identified as a novel pathogenic species, CandidatusBartonella mayotimonensis (Lin et al., 2010). This species and related strains have been identified in European and North American bat species (Veikkolainen et al., 2014;
Lilley et al., 2017; Stuckey et al., 2017a; Urushadze et al., 2017).
Bartonellaspp. have been detected in numerous bat ectoparasites (Stuckey et al., 2017b; Hornok et al., 2019), some of which are known to occasionally attack humans (Jaenson et al., 1994;
Estrada-Peña and Jongejan, 1999). A recent study also found serological evidence of a Bartonella species specific to fruit bats in humans in Nigeria where members of the community capture and sometimes eat bats (Bai et al., 2018). Given these emerging patterns, knowledge of the host and vector associations of bat-associatedBartonellaspecies could have implications for managing spillover risk.
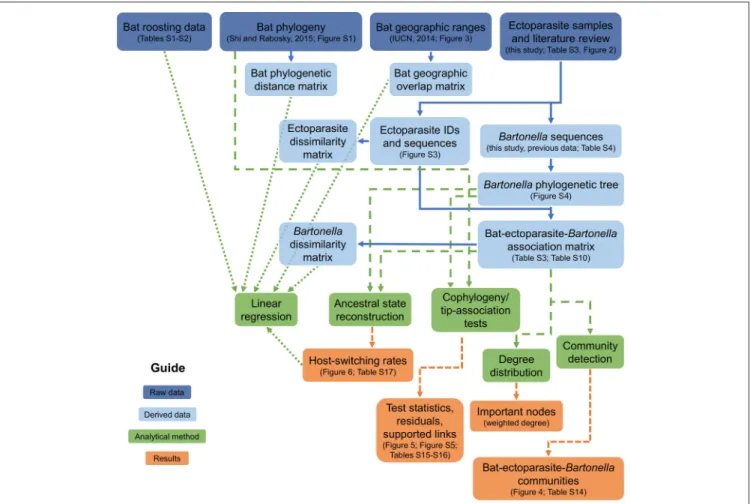
Our strategy to investigate how bat–ectoparasite–Bartonella communities are assembled and how they evolve involves a multifaceted analytical approach (Figure 1) that splits this problem into three fronts: (1) assessing the diversity ofBartonella species in European bats and their ectoparasites and the structure of bat–ectoparasite–Bartonella communities using network analysis, (2) understanding the evolutionary implications of these ecological patterns using tip-association and cophylogeny tests and phylogenetic measures of historical host-switching rates, and (3) linking patterns of Bartonella host specificity to ecological and evolutionary covariates using linear regression.
We hypothesized that associations between bats, ectoparasites, and bacteria can be resolved into identifiable communities that separate by bat phylogeny, geographic overlap, and roosting patterns. Second, we expected that the phylogeny ofBartonella species will exhibit significant clustering by bat taxonomy and will have significant congruence with the phylogeny of bat species. Linking these patterns together, we hypothesized that host phylogenetic distance, ectoparasite sharing, geographic range overlap, and summer roost sharing are predictors of bacterial species assemblages and host-switching rates among bat species. This multifaceted approach aims to bridge ecological processes to observed evolutionary patterns to better understand the diversity and epizootiology of bartonellae in bats. Such an approach could be generalized to study and manage other microorganisms with complex, multihost dynamics.
MATERIALS AND METHODS
Study Sites and Specimen Collection
Bat ectoparasites were collected in the Netherlands, Belgium, Hungary, and Romania between 1993 and 2015. Sampling sites included roosting, swarming, and foraging areas, and all sampling occurred during the summer maternity and autumn mating phases when ectoparasites are more active (van Schaik and Kerth, 2017). In the Netherlands and Belgium, ectoparasite specimens were collected with forceps either directly from bats during inspections of bat boxes and night mist netting or from their roosts. In addition, ectoparasites were sampled during inspection of dead bats collected in the Netherlands between 1993 and 2011 and stored in the Naturalis Biodiversity Center, Leiden, the Netherlands. Bat flies from Hungary and Romania derived from a study by Sándor et al. (2018).
All bats were morphologically identified to the species level.
Initial identification of bat flies was based on morphological characteristics (Theodor and Moscona, 1954; Theodor, 1967).
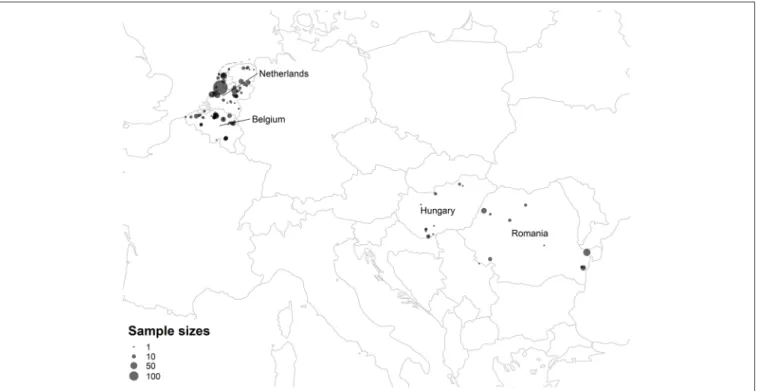
Ectoparasites were stored in 70% ethanol in separate vials prior to further analysis. The distribution of sampling sites is mapped in Figure 2, and the coordinates of sampling sites are listed inTable S13.
Bat Species Tree, Geographic Range Overlap, and Roosting and Mating Data
A phylogenetic tree of bats (Figure S1) was obtained from the Open Tree of Life (http://www.opentreeoflife.org) from a previous study of bat taxonomy using multiple mitochondrial and nuclear loci (Shi and Rabosky, 2015). The tree was pruned to the 21 species inTable 1.Myotis oxygnathuswas considered a synonym forMy. blythii (Agnarsson et al., 2011; Balvín and Bartoniˇcka, 2014; Wilson and Reeder, 2015).
The geographic ranges of each bat species were downloaded from the International Union for Conservation of Nature (IUCN) Red List website (http://www.iucnredlist.org) (IUCN, 2014). IUCN ranges are convenient data that are available for all the bat species in this study, and previous studies have successfully used these data for understanding the determinants of viral diversity in bats (Luis et al., 2013, 2015; Maganga et al., 2014; Webber et al., 2017; Willoughby et al., 2017). Shape files were imported into R using the “readShapeSpatial” function in the “maptools” package (Bivand et al., 2017; R Core Team, 2018).
Individual range maps (Figure S2) and a map of overlapping ranges (Figure 3) were generated by drawing shape files over the
“worldHires” map from the “maps” package (Becker et al., 2016).
We then calculated pairwise percent geographic range overlap between each bat species as described previously (McKee et al., 2016); see the Supplementary Material for more details. Data on roosting patterns and mating systems of bats (Tables S1and S2) were collected from books byDietz and Kiefer (2014)and Niethammer and Krapp (2001, 2004).
Ectoparasite DNA Extraction and Barcoding
DNA from bat flies, mites, fleas, and bat bugs was extracted with ammonium hydroxide as described previously (Wielinga et al., 2006). DNA from bat ticks was extracted using the Qiagen DNeasy Blood & Tissue Kit according to the manufacturer’s protocol for the purification of total DNA from ticks (Qiagen, Venlo, the Netherlands). Confirmation of ectoparasite identification was performed by sequencing a 658-base-pair fragment of the cytochrome oxidase subunit I (COI) using primers LCO1490 and HCO2198 (Folmer et al., 1994); see theSupplementary Material for details. For species identification, both strands of PCR products were Sanger sequenced (BaseClear, Leiden, the Netherlands) using the same forward and reverse primers as in the conventional PCR. Trimming and manual cleaning of COI sequences were performed in BioNumerics v7.1 (Applied Math, Belgium).
A phylogeny was inferred using the GTR+Ŵ model with 25 distinct rate categories with 1,000 bootstrap replicates using RAxML (Stamatakis, 2014). Based on this phylogeny, individual associations between a Bartonella sequence and a vector species were corrected if the phylogenetic position of the COI sequence conflicted with the morphological identification, replacing the morphological identification with the phylogenetic identification.
FIGURE 1 |Analysis framework diagram. Boxes link raw data (dark blue) to derived data (light blue), analytical methods (green), and results (orange) to connect all of the scientific analyses used in the study.
Review of Ectoparasite Host Range
We recognize that the relationships between bat hosts and ectoparasites in our dataset may not capture the full ectoparasite host range due to infrequent associations between ectoparasites and some bat hosts. To capture some of this additional variation, we performed a literature review (Table S3) of the host range of the 17 ectoparasite species for which we had associated Bartonella data. The search was implemented in Google Scholar, Web of Science, and GenBank using the ectoparasite species epithet in the search terms. Additional publications were obtained based on citations therein and from previous reviews of bat fly host associations (Szentiványi et al., 2016). This review gathered a total of 302 publications from 1835 to 2018, 212 of which yielded information relevant to the ectoparasite and bat species in the current study. We counted the number of publications for which an ectoparasite species was noted as occurring on a bat species, adding the current study toward each total only if an ectoparasite was sampled from a bat species in our collection. Bat–ectoparasite associations noted in the studies that did not record the full species epithet for both ectoparasite or host species were excluded.
Bartonella Amplification and Sequencing
Ectoparasites were tested individually for the presence of Bartonella spp. with a conventional PCR assay targeting the citrate synthase gene (gltA) using primers designed by Norman et al. (1995); the Supplementary Material contains additional details on Bartonella detection protocols. Previous studies have found gltA sequences to be sufficiently diverse to distinguish among Bartonella species and some subspecies (La Scola et al., 2003). Additionally, gltA is the most common marker for genotyping Bartonella species (Kosoy et al., 2018); hence, it is useful for comparing Bartonella diversity across studies. For Bartonella species identification, both strands of PCR products were Sanger sequenced (BaseClear, Leiden, the Netherlands) using the same forward and reverse primers as in the conventional PCR. To minimize cross- contamination and false-positive results, positive (pool of Bartonella-positive ticks;Tijsse-Klasen et al., 2011) and negative (water only) controls were included in each batch tested by PCR.
Furthermore, DNA extraction, PCR mix preparation, sample addition, and PCR-product analysis were performed in assigned separate labs. Trimming and manual cleaning of Bartonella sequences were performed in BioNumerics v7.1 (Applied Math,
FIGURE 2 |Map of ectoparasite sampling sites. Points summarize the total number of ectoparasite samples from the Netherlands, Belgium, Hungary, and Romania collected from each sampling site. Latitude, longitude, and ectoparasite counts for each sampling site are listed inTable S13.
FIGURE 3 |Map of geographic ranges for the 21 European bat species studied. Transparent layers were mapped on top of one another to highlight regions with dense range overlap, primarily in Europe and the Middle East. Some species have additional overlap in Central and East Asia. Individual maps are shown inFigure S2.
Belgium) together withBartonellareference sequences available in GenBank.
Sequences were further confirmed asBartonellathrough Basic Local Alignment Search Tool (BLAST) searches (https://blast.
ncbi.nlm.nih.gov/Blast.cgi). Based on this initial screening, some sequences were identified as originating fromBartonellaspecies not associated with bats or from bacteria of other genera and were removed before further analysis (Supplementary Material).
For the purposes of ecological and evolutionary analysis, we have assumed that aBartonellastrain amplified from an ectoparasite species may also be carried by the bat species on which that ectoparasite was found. We argue that even incidental ectoparasitism on an atypical bat host may lead to transmission of bacteria and is thus important for understanding available parasite host range. The host associations of ectoparasite- derived sequences were validated for the subset of Bartonella
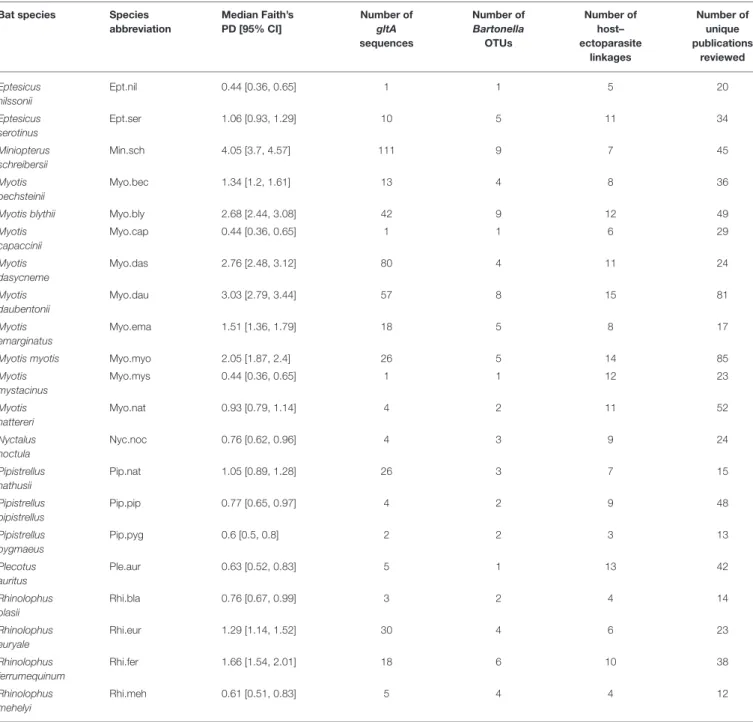
TABLE 1 |Summary ofBartonellaphylogenetic diversity for 21 European bat species included in our study.
Bat species Species abbreviation
Median Faith’s PD [95% CI]
Number of gltA sequences
Number of Bartonella
OTUs
Number of host–
ectoparasite linkages
Number of unique publications
reviewed
Eptesicus nilssonii
Ept.nil 0.44 [0.36, 0.65] 1 1 5 20
Eptesicus serotinus
Ept.ser 1.06 [0.93, 1.29] 10 5 11 34
Miniopterus schreibersii
Min.sch 4.05 [3.7, 4.57] 111 9 7 45
Myotis bechsteinii
Myo.bec 1.34 [1.2, 1.61] 13 4 8 36
Myotis blythii Myo.bly 2.68 [2.44, 3.08] 42 9 12 49
Myotis capaccinii
Myo.cap 0.44 [0.36, 0.65] 1 1 6 29
Myotis dasycneme
Myo.das 2.76 [2.48, 3.12] 80 4 11 24
Myotis daubentonii
Myo.dau 3.03 [2.79, 3.44] 57 8 15 81
Myotis emarginatus
Myo.ema 1.51 [1.36, 1.79] 18 5 8 17
Myotis myotis Myo.myo 2.05 [1.87, 2.4] 26 5 14 85
Myotis mystacinus
Myo.mys 0.44 [0.36, 0.65] 1 1 12 23
Myotis nattereri
Myo.nat 0.93 [0.79, 1.14] 4 2 11 52
Nyctalus noctula
Nyc.noc 0.76 [0.62, 0.96] 4 3 9 24
Pipistrellus nathusii
Pip.nat 1.05 [0.89, 1.28] 26 3 7 15
Pipistrellus pipistrellus
Pip.pip 0.77 [0.65, 0.97] 4 2 9 48
Pipistrellus pygmaeus
Pip.pyg 0.6 [0.5, 0.8] 2 2 3 13
Plecotus auritus
Ple.aur 0.63 [0.52, 0.83] 5 1 13 42
Rhinolophus blasii
Rhi.bla 0.76 [0.67, 0.99] 3 2 4 14
Rhinolophus euryale
Rhi.eur 1.29 [1.14, 1.52] 30 4 6 23
Rhinolophus ferrumequinum
Rhi.fer 1.66 [1.54, 2.01] 18 6 10 38
Rhinolophus mehelyi
Rhi.meh 0.61 [0.51, 0.83] 5 4 4 12
Median Faith’s phylogenetic diversity (PD) and 95% confidence intervals were calculated from 100 posterior samples of the Bartonella gltA tree inFigure S4, pruned to the sequences found in the 21 species of European bats. The number of host–ectoparasite linkages observed is summarized from the literature review inTable S3, including new specimens collected during this study. Species abbreviations are used inFigures 5,6andFigure S5.
species that have been characterized from bats in previous studies (Supplementary Material).
To aid in phylogenetic inference and the delineation of novel Bartonella species, additional Bartonella gltA sequences amplified from bats and ectoparasites were compiled from published articles and records in GenBank. This search was implemented in Google Scholar, Web of Science, and GenBank.
Initial BLAST screening also indicated that some Bartonella
sequences had close similarity to Bartonella sequences found in humans (Podsiadly et al., 2010; Lin et al., 2012) and stray dogs (Bai et al., 2010); thus, representative sequences from these studies were also included. Details on the origin of Bartonella sequences are listed in Table S4. Sequences were trimmed to a common length of 337 base pairs and aligned using the local and accurate L-INS-i method in MAFFT v7.187 (Katoh and Standley, 2013). The sequences were inspected for
gaps and misalignments and were removed if they contained obvious errors.
Phylogenetic Analysis of Bartonella Sequences
Two datasets were created for phylogenetic analyses. First, we compiled the full set of Bartonella sequences from bats and their ectoparasites fromTable S4 plus sequences from the current study (full dataset, n = 754), using three sequences from Brucella spp. as the outgroup. Second, this full set was restricted to Bartonella sequences from bats and their ectoparasites in Europe (European bat dataset,n=456). While ectoparasites collected from roosts and bat boxes were tested for Bartonella spp., the DNA sequences derived from these samples were only used in the phylogenetic analysis of the full dataset. Since they did not contain information on the host species, they were excluded from the European dataset and were thus not used to assess Bartonella diversity among bat species or in the other tests detailed below (network analysis, cophylogeny, and regression). This restricted set contained sequences from the 21 bat species represented in Figure S1 and the 17 ectoparasites represented in our literature review.
Sequences from My. oxygnathus were combined with those from My. blythii. Due to the potential confounding factor of recombination in phylogenetic inference (Posada and Crandall, 2002), we performed the pairwise homoplasy index test (Bruen et al., 2005) in SplitsTree v4.13.1 (Huson, 2005). Tests using both the full and European bat datasets indicated no significant evidence that recombination affects our phylogenetic inference (P=0.41 andP=0.25, respectively).
We selected models derived from both datasets to determine the best sequence evolution, speciation, and codon partitioning models. Following this procedure, a phylogenetic tree was generated for the full dataset in BEAST using the GTR+Ŵ+I sequence evolution model and the birth–death speciation model with incomplete sampling and rate partitions for each codon position. See theSupplementary Materialfor additional details on model selection and phylogeny generation.
Branches of the phylogenetic tree were collapsed according to probableBartonellaspecies. Classification of bacterial species is challenging and may not conform well to species concepts developed for eukaryotes (Konstantinidis et al., 2006; Fraser et al., 2007). La Scola et al. (2003) proposed that Bartonella species could be distinguished if gltA sequences differed by
>4% identity.Konstantinidis et al. (2006)advocated for a more
stringent approach wherein bacterial species are demarcated
by >5% difference in sequence identity, which corresponds
well with another standard of bacterial species, 70% DNA–
DNA hybridization. We chose to follow this more conservative approach and collapsed branches into operational taxonomic units (OTUs) based on ≤5% identity among sequences. Using these Bartonella OTUs, we can understand their ecology, specifically their host and ectoparasite associations, factors that can aid in demarcating Bartonella species or species complexes (Kosoy, 2010; Kosoy et al., 2012). Additional post hoc comparisons of OTUs with recently published Bartonella
sequences from insectivorous bats in China and western, central, and eastern Europe were performed (Han et al., 2017; Stuckey et al., 2017a; Corduneanu et al., 2018). Phylogenetic diversity (PD) ofBartonellasequences from each bat species was assessed by the number of OTUs found in the species and (Faith, 1992) PD index based on branch lengths in 100 posterior samples of thegltAtree. Faith’s PD was calculated in R using the “picante”
package (Kembel et al., 2014).
Network Analysis and Community Detection
Weights for edges linking bat, ectoparasite, and Bartonella nodes were initially assigned based on the number of citations linking ectoparasite species to bat species in the literature review (Table S3) or the number of Bartonella gltA sequences for a givenBartonellaOTU linked to a host bat or host ectoparasite (Table S10). To account for sampling intensity on edge weights, we adjusted bat–ectoparasite edge weights,wab, by dividing the number of citations linking ectoparasitebto bata,nab, by the sum of the total unique publications surveyed for bat a, xa, and the total unique publications surveyed for ectoparasite b, xb; thus, wab = nab/ (xa+xb). Similarly, we adjusted weights for edges linking BartonellaOTUs to hosts (either bat species or ectoparasite species), wcd, by dividing the number of gltA sequences linking OTU d to host c, ncd, by the sum of the totalgltAsequences obtained from hostc,yc, and the totalgltA sequences obtained for OTUd,yd; thus,wcd = ncd/ yc+yd
. Therefore, edge weights were constrained to be between 0 and 0.5, with an actual range of 0.00431 to 0.429.
We performed community detection on the tripartite network using three algorithms available in the R “igraph” package:
the information map method (Rosvall and Bergstrom, 2008), the Louvain method (Blondel et al., 2008), and the spin glass method (Reichardt and Bornholdt, 2006). The purpose of using multiple algorithms was to account for some uncertainty in the identification of communities (see theSupplementary Material for details on the algorithms). Communities were visualized using the “HiveR” package in R (Hanson et al., 2016).
To identify bat, ectoparasite, andBartonellaspecies that might be highly influential in the network, we examined nodes that were highly connected in the tripartite network based on calculation of their weighted degree. A node’s weighted degree represents the sum of the edge weights connecting a node to other nodes. Nodes were selected as influential if they were in the top 25th percentile of weighted degree. We then examined how the selected nodes were connected to other nodes within the communities detected by the community detection algorithms.
Cophylogeny and Tip-Association Tests for Bats and Bartonella
Clustering of traits among tips of theBartonellatree (European bat dataset) was tested using the Bayesian Tip-association Significance Testing (BaTS) program (Parker et al., 2008). We assessed the clustering of bat taxonomic traits (species, genera, families, and suborders) and countries sampled. Significance of clustering for each trait was assessed by comparing the calculated
association index (AI) and parsimony score (PS) for 100 posterior samples of theBartonellatree against null distributions generated from 1,000 randomizations of traits to tips along each sampled Bartonellatree.
Phylogenetic trees of bat species andBartonellaOTUs were assessed for evidence of evolutionary codivergence using two algorithms: the Procrustean Approach to Cophylogeny (PACo;
Balbuena et al., 2013) and the ParaFit method (Legendre et al., 2002). Trees were imported into R using the “ape” package (Paradis et al., 2004, 2016) and then rescaled to have a maximum branch length of one by dividing all branch lengths by the longest branch in each tree. A binary association matrix linking bat species toBartonellaOTUs was assembled based onTable S10.
We tested the pattern of codivergence using ParaFit using the
“ParaFit” function in the “ape” package with 999 permutations and stored the P-values for the contributions of individual linkages (known as ParaFitLink1 or F1 statistics). Codivergence was tested in PACo using the “paco” package in R (Balbuena et al., 2016) with 1,000 permutations. PACo residuals and mean jackknife contributions for individual linkages were stored to compare with results from ParaFit. We performed the tests on the maximum clade credibilityBartonellatree and 100 sampled posterior trees to assess the effect of phylogenetic uncertainty in the global fit tests.
Bayesian Prediction of Bartonella Host-Switching Rates
Historical rates of host-switching byBartonellalineages among bat host species were predicted using Bayesian ancestral state reconstruction in BEAST. The host-switching rates discussed here represent a latent biological process (movement of agents between species) that was not observed but can be estimated based on observed host-switching events in the phylogenetic tree. Since we are interested primarily in the process, we chose to look at estimated host-switching rates rather than observed events. With the European batBartonella sequence dataset, we used the GTR+Ŵ+I sequence evolution model and the birth–death speciation model with incomplete sampling and rate partitions for each codon position (see the Supplementary Material for more details). Rates with Bayes factors (BF) > 3 after the stochastic search variable selection were considered well-supported (Lemey et al., 2009). A graph representingBartonellatransitions among bat species was drawn based on well-supported rates using the “arcdiagram” package in R (Sanchez, 2013).
Regression Analyses
Regression analyses centered around two primary response datasets: a dissimilarity matrix calculated from the counts of Bartonella OTUs found in each of the 21 bat species or their associated ectoparasites and the predicted host-switching rates from the ancestral state reconstruction analysis (Figure 1).
Bartonella and ectoparasite dissimilarity were calculated using the binomial and Cao indices (Cao et al., 1997; Anderson and Millar, 2004), which can handle variable sample sizes and can calculate dissimilarity between species that have no shared parasites (Oksanen et al., 2015), and the Spearman rank
correlation, which was subtracted from one to transform it into a dissimilarity measure. These same indices were used to measure ectoparasite dissimilarity. Other indices, specifically Pearson correlation and Bray–Curtis dissimilarity, were explored but were not chosen because they violated assumptions of normality in residuals. Only those host-switching rates with BF>3 were kept for this analysis to be confident in the estimated rate values.
Additional details on data selection for regression can be found in theSupplementary Material.
There were five primary predictors considered in the regression analyses: dissimilarity in ectoparasite sharing between bat species, phylogenetic distance between bat species, bat geographic range overlap, summer roost sharing of bats, and a vector of the least sampled species from the bat–Bartonella association matrix (Figure 1). The phylogenetic distance matrix from Shi and Rabosky (2015) was initially scaled in terms of branch ages (in millions of years); hence, we rescaled the branch lengths to be between zero and one by dividing all branch lengths by the maximum length. The summer roosting patterns of bats are a binary variable indicating whether or not bats share roosts during the summer months. The vector of least sampled species was selected from the bat–Bartonella association matrix as the minimum row sum for each species pair; this was then log-transformed. We only used the vector of least sampled species in the regression of Bartonella host- switching rates because there appeared to be a sampling bias in the predicted rates such that better sampled species tended to have higher median rates (Pearson’sR=0.62,t=4.15, df=28, P=0.00028). Our dissimilarity measures did not appear to have such a bias.
Before performing regressions, we rescaled all the data and predictors to standard normal distributions with the exception of roost sharing, which was retained as a binary predictor.
We performed separate model selection procedures on three global candidate model sets including a global model with all predictors and all subsets of the global model. The first global model set used ectoparasite dissimilarity, host phylogenetic distance, geographic range overlap, and roost sharing to predict Bartonelladissimilarity. The second set used host phylogenetic distance, geographic range overlap, and roost sharing to predict ectoparasite dissimilarity. The third set used the samples from the least sampled host species, ectoparasite dissimilarity, host phylogenetic distance, geographic range overlap, and roost sharing to predictBartonellahost-switching rates. For all models containing Bartonella or ectoparasite dissimilarity as data or predictors, we performed model selection based on regressions using all three dissimilarity indices (Spearman correlation, binomial, and Cao indices). For the host-switching models, we performed model selection on both median and mean host- switching rates.
Models were fit using linear regression with normally distributed errors. We selected models based on iterative testing of predictors in the full model and ranked them according to the Akaike information criterion with a correction for finite sample sizes (AICc) using the “dredge” function in the
“MuMIn” package in R (Barton, 2016). We chose the model with the smallest AICc unless another model was less than
two AICc away from the top model (Burnham and Anderson, 2004), in which case we chose the simplest model based on the principle of parsimony. For both the global and the top models, we recorded adjusted R2, inspected residual plots and quantile–quantile plots, and performed a Shapiro–Wilk test (Shapiro and Wilk, 1965) to confirm normality of residuals.
We recorded standardized main effect coefficients, t statistics, F statistics, and associatedP-values for regression parameters.
To assess model fit, we performedk-fold cross-validation with 10-folds using the “cv.lm” function in the “DAAG” package in R (Maindonald and Braun, 2015). To assess the relative importance of parameters in models, we recorded adjusted partial R2 and relative importance values. Relative importance was calculated with the “calc.relimp” function using the (Lindeman et al., 1980)method in the R package “relimpo” (Groemping and Matthias, 2013). Bootstrap confidence intervals for relative importance values were estimated from 1,000 replicates. Due to potential nonindependence of comparisons between pairs of species, we also used Mantel tests (Mantel, 1967) to examine correlations between responses and predictors. We calculated the Pearson correlation and compared it to a null distribution generated from 999 random combinations of cells from the two matrices.
RESULTS
Bat Ectoparasites
Ectoparasites (n=903) were collected in the Netherlands and Belgium from 268 individual bats belonging to 11 species (E.
serotinus,Ny. noctula,Pi. nathusii,Pi. pipistrellus,Pi. pygmaeus, Pl. auritus, My. bechsteinii, My. dasycneme, My. daubentonii, My. mystacinus, andMy. nattereri). In addition, 170 nycteribiid flies from 169 individual bats (Mn. schreibersii,My. bechsteinii, My. blythii, My. capaccinii, My. daubentonii, My. myotis, My.
nattereri,R. blasii,R. euryale,R. ferrumequinum, andR. mehelyi) derived from a study by Sándor et al. (2018)in Hungary and Romania were included.
A total of 1,073 ectoparasites were collected across the four countries (Figure 2). Morphological and molecular identification revealed 15 ectoparasite species from 7 families: two ticks,Argas vespertilionisandIxodes ariadnae(Ixodida: Argasidae, Ixodidae);
one bat bug,Cimex pipistrelli(Hemiptera: Cimicidae); one bat flea, Ischnopsyllus variabilis (Siphonaptera: Ischnopsyllidae);
seven bat flies,Basilia nana,B. nattereri,Nycteribia kolenatii,Nb.
schmidlii, Penicillidia conspicua, Pn. dufourii, and Phthiridium biarticulatum (Diptera: Hippoboscoidea: Nycteribiidae);
and two bat mites, Spinturnix andegavinus and S. plecotina (Mesostigmata: Spinturnicidae). Additional mite specimens (Mesostigmata: Macronyssidae, Spinturnicidae) that could not be identified to the species level by morphology were delineated as two distinct taxa by COI sequences (Supplementary Material;
Figure S3). Ectoparasite specimen counts collected in the Netherlands, Belgium, Hungary, and Romania from each bat species are summarized in Table S11. Table S12 records individual ectoparasite species identifications,Bartonellatesting results, and sampling sites.
Phylogenetic Relationships Between Bartonella Sequences
In total, 412 gltA sequences were obtained from the 1,073 ectoparasites (38%) collected from European bats in Belgium, Hungary, the Netherlands, and Romania (Table S12). After filtering out sequences that were not Bartonella, these 316 sequences were combined with the 438 reference sequences listed in Table S4, resulting in the full dataset of 754 Bartonella gltA sequences used for phylogenetic analysis and delineation of Bartonella OTUs. The subset of 456 gltA sequences comprising the European bat dataset represents data from nine countries: Belgium, Finland, Georgia, Hungary, the Netherlands, Poland, Romania, Slovenia, and the United Kingdom. The sequences from Finland, Georgia, Poland, Slovenia, and the United Kingdom derive from past observational studies of Bartonella infections in bats and their ectoparasites (Concannon et al., 2005; Morse et al., 2012;
Veikkolainen et al., 2014; Lilley et al., 2015; Urushadze et al., 2017;
Szubert-Kruszynska et al., 2018).
Based on our demarcation of 5% sequence divergence for separating Bartonella species, we observed 49 monophyletic clusters ofgltAsequences identified as OTUs and 39 individual gltAsequences that are distinct from these OTUs out of the 754 gltAsequences analyzed, resulting in an estimate of at least 88 distinctBartonellaspecies found in bats worldwide, 20 of which are found in European bats and ectoparasites (Figure S4). All OTUs had strong posterior support (posterior node probability
>0.9); however, support for nodes connecting OTUs into larger clades decreased significantly for deeper nodes. A general pattern of separation betweenBartonellaOTUs and sequences found in New World bats (colored green inFigure S4) and Old World or European bats (colored blue and red inFigure S4, respectively) was observed, as in a previous analysis by McKee et al. (2016).
Bartonelladiversity varied across European bat species, with a range of one to nine OTUs and a range of 0.44–4.05 for Faith’s PD forE. nilssoniiandMn. schreibersii, respectively (Table 1). Faith’s PD per species was significantly positively correlated with the log number ofgltAsequences obtained for that species (Pearson’sR
=0.88,t=8.04, df=19,P<0.0001) and with the number of BartonellaOTUs observed per species (Pearson’sR=0.88,t = 7.96, df=19,P<0.0001). After accounting for this significant sampling effect onBartonelladiversity, there was no significant correlation between Faith’s PD and the number of ectoparasites associated with each bat species (t=0.6, df=18,P=0.56) or the number of OTUs and ectoparasites (t=0.17, df=18,P=0.87).
Network Analysis and Community Assignment
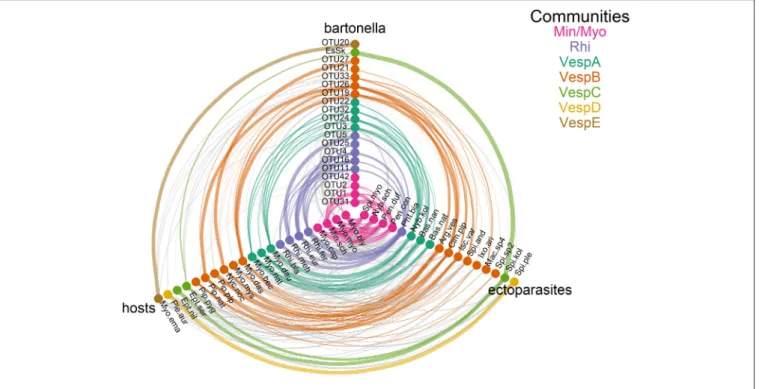
The three community detection algorithms consistently identified seven communities: Min/Myo, VespA–VespE, and Rhi (Figure 4andTable S14). There were only minor inconsistencies in the community assignment of a few species. Two algorithms (information map and spin glass) lumped Pl. auritus and S.
plecotinainto a distinct community, but the Louvain algorithm placed them with community VespC. The Louvain and spin glass algorithms groupedI. ariadnae with community VespB,
whereas the information map algorithm grouped this species with community VespD.
The seven communities are broadly organized based on host phylogeny, geographic overlap, and roost sharing (Figures S1, S2 andTables S1,S2). Min/Myo contains species from two related families of bats (Vespertilionidae and Miniopteridae) that roost together in caves or other cave-like structures predominantly in southern Europe (with the exception of My. myotis, which is more widespread in Europe; Figure S2). Rhi contains only Rhinolophus species that roost together in caves mostly in southern Europe, North Africa, and the Middle East (Figure S2 and Table S2). VespA contains three closely related Myotis species that roost in tree cavities during the summer and swarm at underground sites during autumn and hibernate there in winter.
VespB contains vespertilionid bats that roost in tree cavities, buildings, and caves during the summer and winter, although with little overlap in roosting patterns among species. However, these species do share some other traits in common, including long-distance migration (My. dasycneme, Ny. noctula, andPi.
nathusii) and a relatively northern distribution within Europe.
VespC contains two Eptesicus species that roost in buildings during the summer and winter. Communities VespD and VespE contained single bat species that had highly specific ectoparasite or Bartonella species and were thus segregated from other communities despite having phylogenetic similarity or similar roosting habits to other species in these communities.
For 11 of the Bartonella OTUs in this study, community assignments corresponded well with other sequence data collected from related bats in Africa, Asia, and Europe (Kosoy et al., 2010a; Lin et al., 2012; Morse et al., 2012; Anh et al., 2015; Wilkinson et al., 2016; Han et al., 2017; Lilley et al., 2017;
Stuckey et al., 2017a; Corduneanu et al., 2018). Further details on comparisons between OTUs and other sequences from previous studies can be found in theSupplementary Material.
Fifteen nodes were identified as being influential based on their weighted degree in the bat–ectoparasite–Bartonella association network. Five bats (Mn. schreibersii, My. blythii, My. daubentonii, My. myotis, and R. ferrumequinum), nine ectoparasites (A. vespertilionis, B. nana, C. pipistrelli, Nb.
kolenatii, Nb. schmidlii, Pn. conspicua, Pn. dufourii, Ph.
biarticulatum, andS. myoti), and oneBartonellaOTU (OTU19) were identified as influential because they fell in the top 25th percentile for weighted degree. The ecology of these species may explain their influence in the network.My. daubentoniimales are known to form social colonies and therefore high ectoparasite densities have been observed on both sexes (Encarnação et al., 2012). Mn. schreibersii, My. blythii, My. myotis, and R. ferrumequinum form mixed roosts in caves (Table S2). All nine ectoparasite species are very promiscuous in their host associations (Table S3). We note that C. pipistrelli and A.
vespertilionis are known to bite humans (Jaenson et al., 1994;
Estrada-Peña and Jongejan, 1999; Whyte et al., 2001) and were grouped in the same community as OTU19 and OTU26, which have both been found to infect humans (Veikkolainen et al., 2014; Urushadze et al., 2017). For additional details on the identification of highly influential nodes and their community assignments, see theSupplementary Material.
Cophylogeny and Tip-Association Tests for Bats and Bartonella
Tip-association tests showed significant clustering for all taxonomic levels (species, genera, families, and suborders) and sampled countries with none of the observed AI or PS distributions overlapping with the null distributions (Table S15).
Mean AI and PS values were smaller for genus, family, and suborder compared to the AI and PS values for sampled countries, indicating that the clustering of tips of the tree is better explained by host phylogeny than geography. The cophylogeny global fit analyses both found significant evidence of evolutionary congruence between the bat andBartonellaphylogenies (PACo sum of squared residuals=21.69,P<0.0001; ParaFit sum of squared residuals =21.97, P = 0.001). All PACo and ParaFit tests using sampled posteriorBartonellatrees showed significant congruence, demonstrating that the results are robust with respect to phylogenetic uncertainty in theBartonellatree.
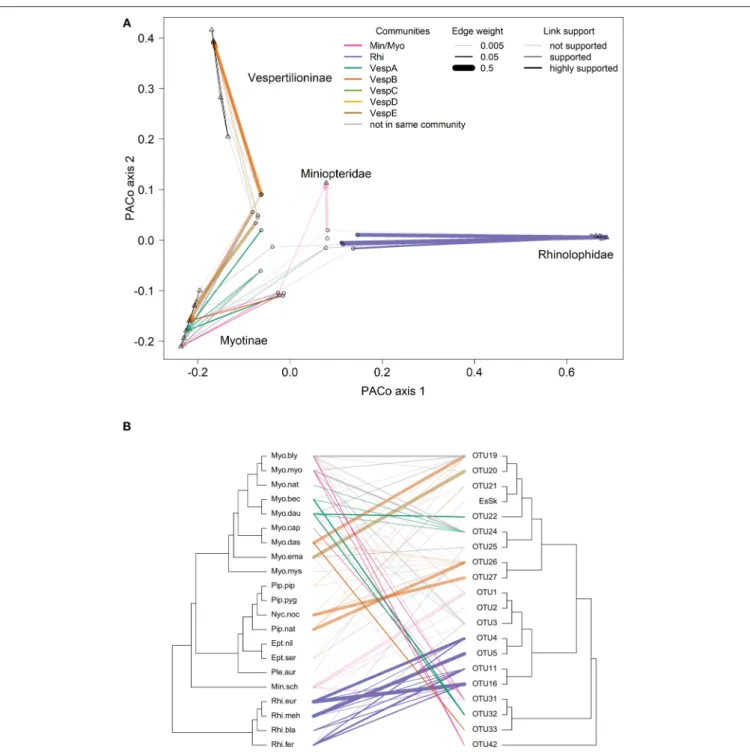
Many of the supported links from the PACo and ParaFit tests are between bat species andBartonellaOTUs in the same community (indicated by line colors inFigure 5) and had high network edge weights (indicated by line width in Figure 5).
Thirty-one out of the 81 (38%) bat–Bartonellalinks were highly supported by either PACo or ParaFit (Figure S5andTable S16).
These links were considered highly supported if the upper limit of the PACo jackknife 95% confidence interval was below the mean of all the squared residuals or if the ParaFit F1 statistic was assigned aP-value<0.01. Of these 31 highly supported links, 22 (71%) were between bat species andBartonellaOTUs identified as being in the same community (Table S16). This proportion of highly supported links in the same community was higher than the proportion of less supported or unsupported links in the same community (χ2=3.23, df=1,P=0.036). Additional details on individual host–parasite links can be found in the Supplementary Material.
Bayesian Prediction of Bartonella Host Transition Rates
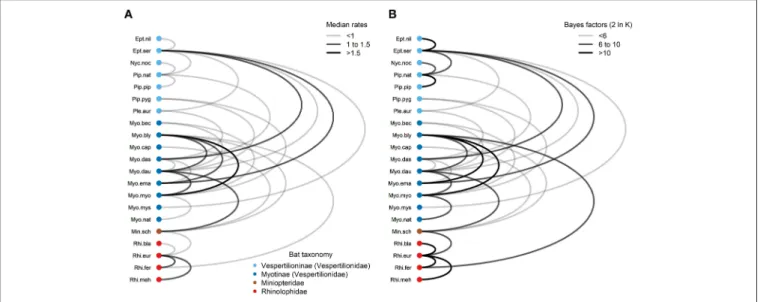
Using the symmetrical rate partition model, only 30 (14%) out of the possible 210 bat host species combinations had significant Bayes factors (BF > 3) from the stochastic search variable selection procedure (Figure 6andTable S17). The median host- switching rates varied from 0.37 forE. nilssoniiandE. serotinus to 1.83 for My. blythii and My. myotis. Large host-switching rates tended to have higher BF support (Pearson’sR=0.52,t
= 3.23, df= 28, P = 0.0032), and rates tended to be biased toward bat species in the same family and subfamily (Figure 6).
Of the 30 rates, 25 (83%) were between bat species in the same family. This is significantly higher than the expected proportion (126/210, 60%) based on the number of possible species combinations that are in the same family (χ2=5.17, df
=1, P =0.012). The majority of host-switching rates (25/30, 90%) have species pairs in the same identified community (11/30, 37%) or in a community containing bats from the same family (16/30, 53%). Fourteen of the 30 host-switching rates (47%) had species pairs that co-roost during summer months (Table S2).
FIGURE 4 |Communities ofBartonellaoperational taxonomic units (OTUs), ectoparasite species, and bat species. Tripartite networks were drawn using separate axes forBartonella, bats, and ectoparasite nodes. Edges connecting nodes were drawn based onTables S3andS10, with edge weights adjusted for sampling intensity. Communities were identified by three detection algorithms (information map, Louvain, and spin glass). Species membership in each community is recorded inTable S14.
Regression Analysis
The top regression model according to AICc (Table S18) for Spearman Bartonella dissimilarity was the model with host phylogenetic distance, geographic range overlap, and roost sharing covariates (AICc=496). The top model for the binomial Bartonelladissimilarity was the model containing only the host phylogenetic distance covariate (AICc=562). The top model for the Cao dissimilarity contained the host phylogenetic distance and roost sharing covariates (AICc=565).
All top models were statistically significant (Table S18) and estimated a statistically significant positive effect of host phylogenetic distance on Bartonella dissimilarity among bat species (Table S19). Since the three candidate models (Spearman, binomial, and Cao) all use different data for regression, we cannot compare themviaAICc. Instead, we compared them according to the proportion of variance inBartonelladissimilarity explained (adjustedR2), the regression mean squared error, and the cross- validation mean squared error. The model using the Spearman correlation explained more variation inBartonelladissimilarity and had lower mean squared error than the binomial and Cao indices (Table S18). From this model, we can infer that bats are more likely to have dissimilar Bartonellaassemblages if they are more distantly related to each other (t = 8.6, df = 206, P < 0.0001), bats have little overlap in their geographic ranges (t = −2.43, df = 206, P = 0.016), and bats do not roost together during the summer (t = −3.81, df = 206,P = 0.00019). Between these three covariates, host phylogenetic distance explains more variation (adjusted partial
R2 = 0.26) than geographic range overlap (adjusted partial R2 = 0.023) or roost sharing (adjusted partial R2 = 0.061).
This difference in explanatory power is significant because the 95% bootstrap confidence intervals for their relative importance do not overlap (Table S19). Individual Mantel tests confirmed that phylogenetic distance had the strongest correlation with Bartonelladissimilarity (Table S20).
The second candidate model set used host phylogenetic distance, geographic range overlap, and roost sharing to predict ectoparasite dissimilarity. The top model chosen for all dissimilarity indices (Spearman, binomial, and Cao) included all covariates. All three models were statistically significant (Table S18) and estimated the effect of host phylogenetic distance to be positive and the effects of geographic range overlap and roost sharing to be negative (Table S19). According to the Spearman model, bats are more likely to have more dissimilar ectoparasite assemblages if they are more distantly related to one another (t =3.85, df=206,P= 0.00016), they have less geographic range overlap (t=3.04, df=206,P=0.0026), and they do not roost together in the summer (t = −3.98, df = 206,P<0.0001). All three covariates explain similar amounts of variation, and they do not significantly differ in their explanatory power since their relative importance confidence intervals overlap (Table S19). Mantel tests confirmed these findings with correlations of similar magnitude across all the three predictors (Table S20). Therefore, since ectoparasite dissimilarity is explained by host phylogenetic distance, geographic range overlap, and roost sharing, we observe no additional effect
FIGURE 5 |Comparisons of bat species and Bartonella OTU phylogenies.(A)Procrustes superimposition plot withBartonellaOTUs (open circles) and bat species (open triangles). In this plot, the axes represent the principle components of the bat species phylogeny. Bat species are projected onto the two main axes explaining the most variation. Names of bat families and subfamilies are indicated for clusters of species. TheBartonellaOTUs are then projected and rotated to fit the bat phylogeny by minimizing the residual distances for each bat-Bartonella association (connected by lines).(B)Cophylogeny plot with the bat species phylogeny on the left side and theBartonellaOTU phylogeny on the right side. Lines in the middle connect bat species toBartonellaOTUs based on sequence data collected from bats or associated ectoparasites. Species abbreviations for bat species are listed inTable 1. In both(A)and(B), bat-Bartonellalinks colored by the community if both the bat species andBartonellawere placed in the same community (as inTable S14). Line widths in both(A)and(B)are proportional to network edge weight and the line transparency depend on the link support from PACo and ParaFit analyses.
of ectoparasite dissimilarity on Bartonella dissimilarity after accounting for these effects.
Finally, the third set of candidate models used the number of gltA sequences from the least sampled bat species plus all
four other covariates. The first covariate was used to account for the observed sampling bias in host-switching rates discussed above. We evaluated models using both mean and median host-switching rates taken from the posterior distributions of
FIGURE 6 |Graph ofBartonellatransition rates among European bat species.(A)Transition rates (median of the posterior distribution) with significant Bayes factors (BF>3) are drawn as edges connecting nodes representing bat species.(B)Bayes factors are plotted as 2 lnK, whereKis the Bayes factor support. Nodes were colored according to bat families/subfamilies. Edge colors were scaled according to median transition rates in(A)or Bayes factor support in(B). Details of transition rates and Bayes factor calculations can be found inTable S17. Species abbreviations for bat species are listed inTable 1.
rates from the Bayesian ancestral state reconstruction analysis.
Following model selection by AICc, both the mean and median host-switching models contained covariates for the least sampled bat species and host phylogenetic distance. Therefore, all the top Spearman, binomial, and Cao models were identical. Both the mean and median models were significant (Table S18) and estimated a positive effect for sampling and a negative effect for host phylogenetic distance (Table S19). The median host- switching model explained more variation and had lower mean squared error than the mean model (Table S19). This model indicates that after accounting for a positive sampling bias (t= 4.59, df=27,P<0.0001),Bartonellainfections are more likely to switch between bat species that are more phylogenetically related (t= −2.32, df=27,P=0.028).
For all top model sets (Spearman Bartonella dissimilarity, Spearman ectoparasite dissimilarity, and median host-switching rates), we confirmed the fit of regression models visually by plotting the standardized data against the standardized partial regression coefficients. The plots for Spearman dissimilarity (Figure S6) confirm the positive effect of host phylogenetic distance and the negative effects of geographic range overlap and roost sharing on both Bartonelladissimilarity and ectoparasite dissimilarity. We also confirm the negative effect of host phylogenetic distance and positive sampling effect onBartonella host-switching rates (Figure S6).
DISCUSSION
Diversity and Structure of
Bat–Ectoparasite–Bartonella Communities
Using a multifaceted analytical approach (Figure 1), we explored the complex nature ofBartonellaassociations with bats and their
ectoparasites in nine European countries. Our first objective was to measure the diversity ofBartonella infections in European bats and their ectoparasites and to analyze the structure of bat–ectoparasite–Bartonella communities. We observed high PD among Bartonella infections in our samples (Table 1), identifying 20 Bartonella OTUs that likely represent distinct species (Figure S4). Network analysis provided support for our hypothesis that associations between bats, ectoparasites, and bacteria could be resolved into identifiable communities. We detected seven distinct bat–ectoparasite–Bartonellacommunities (Figure 4) that separate by bat phylogeny, geographic ranges, and roosting patterns.
However, the separation of parasites amongMyotisspp. bats in our study illustrates the complexity of ecological factors that shape host–parasite associations.Bartonellaspecies found in Myotis spp. bats and their ectoparasites were partitioned into four distinct communities: Min/Myo, VespA, VespB, and VespE (Figure 4andTable S14). All of these communities were separate from theRhinolophus-associated Rhi community. This is notable especially for the Min/Myo community because there is overlap in the geographic range and habitat usage (caves) among the bat species in the Rhi and Min/Myo communities.
This suggests that distinct host–parasite associations can form despite hosts living in sympatry. Community VespA separates from Min/Myo because the hosts roost mainly in trees during the summer and only use caves during the winter. Species in community VespB use a variety of roosts with little overlap; some are long-distance migrants, and others have relatively northern distribution within Europe. The parasite communities of Myotis spp. bats have thus been shaped by a mixture of different factors that reduce exchange of parasites among hosts, providing motivation for analyzing patterns of
Bartonella sharing using a linear regression approach as we have done.
Evolutionary Patterns of Bat–Bartonella Associations
The second objective of our study was to understand the phylogenetic patterns generated from host–parasite associations.
We expected that the phylogeny of Bartonella species would exhibit significant clustering by bat taxonomy and would have significant congruence with the phylogeny of bat species.
As predicted, our tip-association and cophylogeny tests demonstrated that Bartonella lineages strongly cluster by host taxonomy, and the structure of the Bartonella phylogeny is congruent with the host phylogeny. However, these patterns are not entirely consistent with a pattern of strict cospeciation with bats. Rather, Bartonella lineages infecting bats appear to be polyphyletic, suggesting a more complex history of host-switching and possibly multiple introductions from other mammals deeper in the evolutionary tree (McKee et al., 2017;
Urushadze et al., 2017; Frank et al., 2018). Cospeciation of hosts and parasites is a rare phenomenon in general (de Vienne et al., 2013), and several studies of bat viruses have shown that host-switching is the more dominant macroevolutionary force shaping microbial evolution than cospeciation (Cui et al., 2007;
Mélade et al., 2016; Anthony et al., 2017). Previous research on Bartonella associations in bats and rodents showed that host-switching is more common than cospeciation (Lei and Olival, 2014). As we will discuss more below, it is more likely that the observed congruence ofBartonellaand bat phylogenies is driven by phylogenetic bias in microbial host-switching, such that historical host shifts are more likely to happen between closely related species.
Predictors of Bartonella Sharing and Host-Switching Among Bat Species
Our last objective was to identify the ecological and evolutionary constraints that lead to Bartonella host specificity. We hypothesized that host phylogenetic distance, ectoparasite sharing, geographic range overlap, and roost sharing would be predictors of Bartonella sharing and host-switching rates among bat species. Our regression analysis (Figure S6;
Table S18, Table S19) demonstrated that bats that are more phylogenetically related, overlap more in their geographic ranges, and share roosts are more likely to share Bartonella species, with phylogenetic distance being the most important predictor. Ectoparasite sharing between bats had no significant effect on Bartonella sharing after accounting for its own correlation with phylogenetic distance, geographic range overlap, and roost sharing. Finally, our analysis of historical host-switching rates showed that Bartonella lineages are biased to switching between phylogenetically related hosts.
Our regression results explaining variation in Bartonella sharing among bats are in agreement with previous work on bat viruses and other systems.Longdon et al. (2011)demonstrated usingDrosophilasigma viruses that the host phylogeny explains
most of the variation in viral replication among host species.
Primates have more similar parasite communities if they are phylogenetically closely related and inhabit the same region (Davies and Pedersen, 2008).Streicker et al. (2010)found that the frequency of cross-species transmission (CST) of rabies virus between bat species (similar to our measure ofBartonella sharing) increases with decreasing phylogenetic distance and increasing geographic overlap. A later study analyzing these same data confirmed that host phylogenetic distance is a key determinant of rabies CST while other ecological covariates including roost structures, wing aspect ratio, wing loading, and body size were poor predictors (Faria et al., 2013). Luis et al. (2015)found that bat phylogeny and sympatry explained viral sharing in bats, with sympatry being the more important predictor. In addition, viral sharing communities of bats segregated by geographic regions. A recent global analysis of virus sharing in bats showed that after accounting for publication bias, bat species are more likely to share viruses if they have more geographic overlap and they roost in caves (Willoughby et al., 2017). Among cave-roosting bats, species shared viruses more frequently if they overlapped geographically and were documented as sharing roosts. These patterns indicate that host phylogeny and geographic overlap are general predictors of parasite communities in bats. These apparent biases in the arrangement ofBartonellaand ectoparasite species among bat species likely contributed to our ability to identify communities of highly interacting bat, ectoparasite, andBartonellaspecies that tend to cluster by bat family and roosting patterns.
These results demonstrate how key ecological factors constrain the host range ofBartonellaspecies in bats. Yet how do we explain the observed congruence between bat andBartonella phylogenies? As noted above, we believe that this pattern is best explained by a phylogenetic bias in microbial host-switching, where host shifts occur more frequently between closely related species. This bias, if persistent over the evolution ofBartonella lineages, could produce aBartonellatree that is largely congruent with the host tree without the need for strict cospeciation (Charleston and Robertson, 2002; de Vienne et al., 2013). This is in line with ecological fitting, which allows host colonization for ecological specialists prior to the evolution of novel capabilities for host exploitation (Araujo et al., 2015). We observed a negative relationship between historical Bartonella host-switching rates and host phylogenetic distance, but no significant relationship with ectoparasite sharing, geographic overlap, or roost sharing.
These findings are similar to previous research on bat rabies showing that the host phylogeny is the strongest predictor of rabies host shifts (Streicker et al., 2010; Faria et al., 2013).
Thus, biological constraints on parasite shifts among hosts are expected to be the dominant force that shapes host specificity over evolutionary time.
Influence of Ectoparasites on Bartonella Host Specificity
We noted above that ectoparasite sharing failed to explain additional variation inBartonella sharing between bat species after accounting for the effects of host phylogenetic distance,