Characterisation of male breast cancer: a descriptive biomarker study from a large patient series
Matthew P. Humphries
1,*, Sreekumar Sundara Rajan
1,*, Hedieh Honarpisheh
2, Gabor Cserni
3, Jo Dent
4, Laura Fulford
5, Lee B. Jordan
6, J. Louise Jones
7, Rani Kanthan
8, Maria Litwiniuk
9, Anna Di Benedetto
10, Marcella Mottolese
10, Elena Provenzano
11, Sami Shousha
12,
Mark Stephens
13, Janina Kulka
14, Ian O. Ellis
15, Akinwale N. Titloye
16, Andrew M. Hanby
1, Abeer M. Shaaban
17& Valerie Speirs
1Male breast cancer (MBC) is rare. We assembled 446 MBCs on tissue microarrays and assessed
clinicopathological information, together with data from 15 published studies, totalling 1984 cases. By immunohistochemistry we investigated 14 biomarkers (ERα, ERβ1, ERβ2, ERβ5, PR, AR, Bcl-2, HER2, p53, E-cadherin, Ki67, survivin, prolactin, FOXA1) for survival impact. The main histological subtype in our cohort and combined analyses was ductal (81%, 83%), grade 2; (40%, 44%), respectively. Cases were predominantly ERα (84%, 82%) and PR positive (74%, 71%), respectively, with HER2 expression being infrequent (2%, 10%), respectively. In our cohort, advanced age (>67) was the strongest predictor of overall (OS) and disease free survival (DFS) (p = 0.00001; p = 0.01, respectively). Node positivity negatively impacted DFS (p = 0.04). FOXA1 p = 0.005) and AR p = 0.009) were both positively prognostic for DFS, remaining upon multivariate analysis. Network analysis showed ERα, AR and FOXA1 significantly correlated. In summary, the principle phenotype of MBC was luminal A, ductal, grade 2. In ERα+ MBC, only AR had prognostic significance, suggesting AR blockade could be employed therapeutically.
With over 1.6 M cases diagnosed in females in 2012 alone, breast cancer is the most common cancer worldwide for women1. Significant research has been conducted into its biology and natural history over many decades which has helped in our understanding of its biology. Much less studied is male breast cancer (MBC) which accounts for around 1% of all breast cancers diagnosed2. For the UK and US this equates to approximately 350 and 2600 cases annually, respectively3,4. Both the US5 and the UK6 show a gradual increased incidence; 1.0 per 100 000 in the late 1970 s to around 1.2 per 100 000 at the start of this decade7.
The genesis of MBC is yet to be elucidated fully, with many studies suffering from small number of cases available, with published reports on as few 16 cases8. Information derived from these small numbers are at best
1Leeds Institute of Cancer and Pathology, University of Leeds, Leeds, LS9 7TF, UK. 2MD Anderson Cancer Centre, Houston, Texas, TX 77030, USA. 3Department of Pathology, Bács-Kiskun County Teaching Hospital, Nyiri ut 38, H-6000, Kecskemet, Hungary. 4Calderdale Hospital, Halifax, HX3 0PW, UK. 5Surrey & Sussex NHS Trust, Redhill, Surrey, RH1 5RH, UK. 6University of Dundee/NHS Tayside, Dundee, DD1 9SY, UK. 7Barts Cancer Institute, Queen Mary University of London, London EC1M 6BQ, UK. 8Department of Pathology and Laboratory Medicine, University of Saskatchewan, Royal University Hospital, Saskatoon, Saskatchewan S7N 0W8, Canada. 9Poznan University of Medical Sciences, Greater Poland Cancer Centre, Poznan, 02-004, Warsaw Poland. 10Department of Pathology, Regina Elena National Cancer Institute. Via Elio Chianesi 53, 00144 Rome, Italy. 11Department of Histopathology, Addenbrooke’s Hospital, Cambridge, CB2 0QQ, UK. 12Department of Histopathology, Imperial College Healthcare NHS Trust and Imperial College, Charing Cross Hospital, London W6 8RF, UK. 13University Hospital of North Staffordshire, Stoke-on Trent, ST4 6QG, UK. 142nd Department of Pathology, Semmelweis University, Üllői út.
93, Budapest 1091, Hungary. 15Faculty of Medicine & Health Sciences, Nottingham City Hospital. Nottingham, NG5 1PB, UK. 16School of Medical Science, Kwame Nkrumah University of Science and Technology, Kumasi, Ghana. 17Department of Cellular Pathology, Queen Elizabeth Hospital Birmingham and University of Birmingham, Birmingham, B15 2TW, UK. *These authors contributed equally to this work. Correspondence and requests for materials should be addressed to V.S. (email: v.speirs@leeds.ac.uk)
Received: 17 October 2016 Accepted: 23 February 2017 Published: 28 March 2017
OPEN
anecdotal. In the last decade interest in MBC has grown, resulting in accumulation of more substantial numbers of cases allowing study of common biomarkers including estrogen receptor (ER) α , progesterone receptor (PR)9–13) and human epidermal growth factor receptor 2 (HER2)9–13 as well as less frequently evaluated biomarkers such as ERβ 9 androgen receptor (AR)9,10,12–14), Bcl-210,13, p5310,12,13, Ki6710,11,13,15, FOXP114, GCDFP14, NAT116, HLA16, MGB14, COX-217, CD3418 and survivin17. BRCA mutations have also been studied19.
Through international collaboration, we accumulated a series of 446 MBC and evaluated and compared their clinicopathological characteristics with 15 published studies reporting ≥ 30 MBC cases. Using immunohisto- chemistry, we evaluated biomarkers with well-established roles in female breast cancer, represented on tissue microarrays (TMAs). These included ERβ 1, ERβ 2, ERβ 5, PR, AR, Bcl-2, HER2, p53, E-cadherin, Ki67, survivin, prolactin and Forkhead box protein A1 (FOXA1). Our aim was to identify their expression and associate this with known clinical or pathological prognostic variables to determine potential prognostic roles in MBC.
Methods
Patients and ethical approval.
Leeds (West) Research Ethics Committee granted ethical approval (06/Q1205/156). TMAs comprising 446 cases were constructed as previously described9. Between 2008 and 2010, cases from the UK (59%), Italy (11%), Canada (12%), Nigeria (2%), Hungary (9%) and Poland (7%) were collated into nine TMAs. Informed consent was not required as the anonymised material either pre-dated September 2006, or came from a Research Tissue Bank approved by the UK Human Tissue Authority (15/YH/0025). Under the terms of this project-specific ethics (06/Q1206/180), patient identities were not disclosed to the research team, hence specific informed consent was not required. Cases were pseudo-anonymised and data were analysed anonymously. Treatment details were not available for all cases. Where available, the majority received endocrine treatment.
Immunohistochemistry.
The antibody panel, selected given their relevance in female breast cancer, is shown in Table 1, alongside dilution and retrieval methods and cut-offs. Each biomarker was run as a batch with appropriate positive (tissue known to express the biomarker of interest) and negative (no primary anti- body) controls. Immunohistochemistry was conducted as previously described9, employing REMARK crite- ria20. Briefly, heat-mediated epitope retrieval was achieved by pressure-cooking in 10% antigen retrieval Access Revelation 10X solution at 125 °C (Menarini Diagnostics, UK) or using 1% low pH antigen unmasking solution (Vector Laboratories, UK) for 2 minutes. NovolinkTM Polymer Detection System kit was used for visualization of primary antibodies following the manufacturer’s instructions (Leica Biosystems, UK). Slides were washed in TBST and stained in haematoxylin before dehydration in graded ethanol. Slides were mounted in DPX (Fluka, UK). Scoring criteria were selected according to previously reported studies (ER, PR, AR, ERβ 1, ERβ 2, ER β 521, FOXA122, prolactin23, Ki6724, E-cadherin25, p5326, Bcl-225, HER227 and survivin28. TMAs were scanned (× 20;Aperio ScanScope
™
) then manually scored using ImageScope™
viewing software (Aperio) by MPH and SSR, overseen by AMH and AMS, specialised consultant breast histopathologists.Biomarker associations.
A correlation comparison was undertaken to visualise grouping of ERα , PR, AR and FOXA1 using Spearman correlation coefficient calculating pairwise combinations. A dataset containing scores for these biomarkers was uploaded to TMA Navigator29. Dendograms and correlation networks were gen- erated providing abstraction of the relationships between multiple markers. Statistical significance was applied to identify minimum threshold values. (FDR P-value 0.05). Network significance was determined using algorithm AS8930. Benjamini–Yekutieli multiple hypothesis testing was applied.Statistical analysis.
Associations with Disease-free and Overall survival (DFS; from initial diagnosis to the diagnosis of local or distant recurrence, OS; from initial diagnosis to death) were analysed (Kaplan–Meier plots, log rank test). Hazard ratios were determined by Cox regression. Follow up information was at least 10 years andAntibody Clone Dilution Incubation Retrieval Cut-Off
ERα 1D5 1:100 Overnight
High pressure heat retrieval in pressure cooker using 1% low pH
antigen unmasking solution
Allred ≥ 221
FOXA1 ab55718 1:500 Overnight ≥ 422
PR PgR 636 1:200 Overnight Allred ≥ 221
E- cadherin NCH-38 1:100 Overnight > 50%25
Ki67 MIB1 1:100 Overnight > 14%24
p53 DO-7 1:1000 Overnight > 10%26
Bcl-2 124 1:200 Overnight > 10%25
HER2 PN2A 1:25 Overnight 2+ Confirmed by FISH27
Prolactin B6.2 1:3000 Overnight ≥ 323
Survivin D8 1:25 Overnight > 5% (Nuc). ≥ 3 (Cyto)28
AR AR441 1:100 Overnight Allred ≥ 421
ERβ 1 MCA19745 1:20 1 hour
Access revelation
Allred ≥ 321
ERβ 2 MCA 2279 1:20 1 hour Allred ≥ 321
ERβ 5 MCA 46764 A 1:50 1 hour Allred ≥ 321
Table 1. Antibody dilutions and retrieval methods with scoring cut-offs for dichotomisation.
was updated in June 2013 and survival periods calculated. Patients were censored at the last day they were known to be alive. Variables were entered in univariate and multivariate analysis (Cox proportional hazards regression model); these included the biomarker of interest, grade, nodal status and tumour size as is routinely used in anal- ysis of breast cancer datasets. P values reported for univariate and multivariate analysis were calculated using Cox proportional hazards regression model in PASW (v21).
Results
Tumour characteristics.
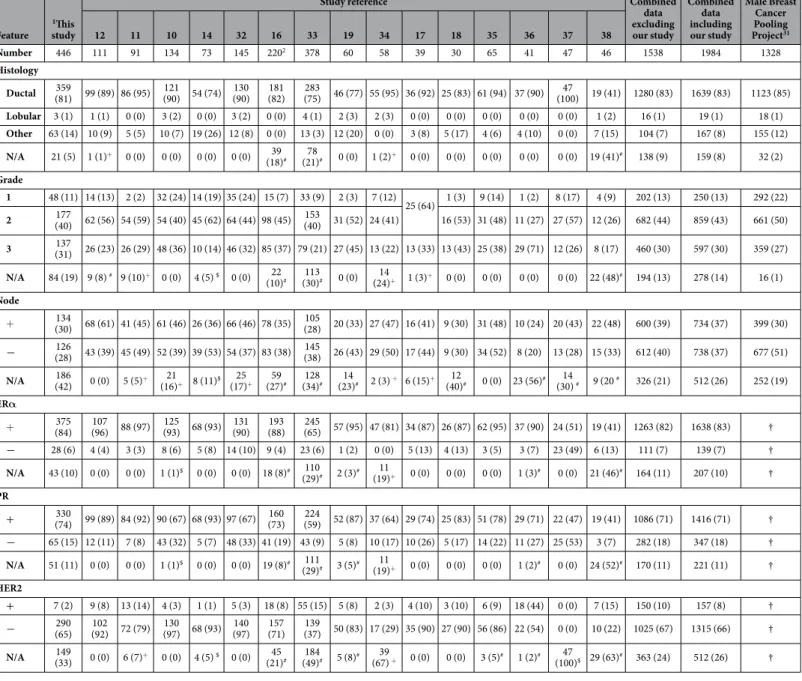
These are illustrated in Table 2, alongside studies published between 1996 and 2017, which have examined > 30 MBCs. This information was collated to establish the spectrum of MBC data reported over the last 2 decades to affirm the representativeness of our cohort, with the combined average of all 1984 cases presented in the penultimate column of Table 2.Comparatively our cohort characteristics are virtually identical to those from the combined data. The main histological subtype in our cohort and in the combined analyses was ductal (81%, 83%), grade 2 (40%, 44%),
Feature
1This study
Study reference Combined
data excluding our study
Combined data including our study
Male Breast Cancer Pooling Project31
12 11 10 14 32 16 33 19 34 17 18 35 36 37 38
Number 446 111 91 134 73 145 2202 378 60 58 39 30 65 41 47 46 1538 1984 1328
Histology Ductal 359
(81) 99 (89) 86 (95) 121
(90) 54 (74) 130 (90) 181
(82) 283
(75) 46 (77) 55 (95) 36 (92) 25 (83) 61 (94) 37 (90) 47
(100) 19 (41) 1280 (83) 1639 (83) 1123 (85) Lobular 3 (1) 1 (1) 0 (0) 3 (2) 0 (0) 3 (2) 0 (0) 4 (1) 2 (3) 2 (3) 0 (0) 0 (0) 0 (0) 0 (0) 0 (0) 1 (2) 16 (1) 19 (1) 18 (1) Other 63 (14) 10 (9) 5 (5) 10 (7) 19 (26) 12 (8) 0 (0) 13 (3) 12 (20) 0 (0) 3 (8) 5 (17) 4 (6) 4 (10) 0 (0) 7 (15) 104 (7) 167 (8) 155 (12) N/A 21 (5) 1 (1)+ 0 (0) 0 (0) 0 (0) 0 (0) 39
(18)# 78
(21)# 0 (0) 1 (2)+ 0 (0) 0 (0) 0 (0) 0 (0) 0 (0) 19 (41)# 138 (9) 159 (8) 32 (2) Grade
1 48 (11) 14 (13) 2 (2) 32 (24) 14 (19) 35 (24) 15 (7) 33 (9) 2 (3) 7 (12)
25 (64) 1 (3) 9 (14) 1 (2) 8 (17) 4 (9) 202 (13) 250 (13) 292 (22)
2 177
(40) 62 (56) 54 (59) 54 (40) 45 (62) 64 (44) 98 (45) 153
(40) 31 (52) 24 (41) 16 (53) 31 (48) 11 (27) 27 (57) 12 (26) 682 (44) 859 (43) 661 (50)
3 137
(31) 26 (23) 26 (29) 48 (36) 10 (14) 46 (32) 85 (37) 79 (21) 27 (45) 13 (22) 13 (33) 13 (43) 25 (38) 29 (71) 12 (26) 8 (17) 460 (30) 597 (30) 359 (27) N/A 84 (19) 9 (8) # 9 (10)+ 0 (0) 4 (5) $ 0 (0) 22
(10)# 113
(30)# 0 (0) 14
(24)+ 1 (3)+ 0 (0) 0 (0) 0 (0) 0 (0) 22 (48)# 194 (13) 278 (14) 16 (1) Node
+ 134
(30) 68 (61) 41 (45) 61 (46) 26 (36) 66 (46) 78 (35) 105
(28) 20 (33) 27 (47) 16 (41) 9 (30) 31 (48) 10 (24) 20 (43) 22 (48) 600 (39) 734 (37) 399 (30)
− 126
(28) 43 (39) 45 (49) 52 (39) 39 (53) 54 (37) 83 (38) 145
(38) 26 (43) 29 (50) 17 (44) 9 (30) 34 (52) 8 (20) 13 (28) 15 (33) 612 (40) 738 (37) 677 (51)
N/A 186
(42) 0 (0) 5 (5)+ 21
(16)+ 8 (11)$ 25 (17)+ 59
(27)# 128 (34)# 14
(23)# 2 (3) + 6 (15)+ 12
(40)# 0 (0) 23 (56)# 14
(30) # 9 (20 # 326 (21) 512 (26) 252 (19) ERα
+ 375
(84) 107
(96) 88 (97) 125
(93) 68 (93) 131 (90) 193
(88) 245
(65) 57 (95) 47 (81) 34 (87) 26 (87) 62 (95) 37 (90) 24 (51) 19 (41) 1263 (82) 1638 (83) †
− 28 (6) 4 (4) 3 (3) 8 (6) 5 (8) 14 (10) 9 (4) 23 (6) 1 (2) 0 (0) 5 (13) 4 (13) 3 (5) 3 (7) 23 (49) 6 (13) 111 (7) 139 (7) † N/A 43 (10) 0 (0) 0 (0) 1 (1)$ 0 (0) 0 (0) 18 (8)# 110
(29)# 2 (3)# 11
(19)+ 0 (0) 0 (0) 0 (0) 1 (3)# 0 (0) 21 (46)# 164 (11) 207 (10) † PR
+ 330
(74) 99 (89) 84 (92) 90 (67) 68 (93) 97 (67) 160 (73) 224
(59) 52 (87) 37 (64) 29 (74) 25 (83) 51 (78) 29 (71) 22 (47) 19 (41) 1086 (71) 1416 (71) †
− 65 (15) 12 (11) 7 (8) 43 (32) 5 (7) 48 (33) 41 (19) 43 (9) 5 (8) 10 (17) 10 (26) 5 (17) 14 (22) 11 (27) 25 (53) 3 (7) 282 (18) 347 (18) † N/A 51 (11) 0 (0) 0 (0) 1 (1)$ 0 (0) 0 (0) 19 (8)# 111
(29)# 3 (5)# 11
(19)+ 0 (0) 0 (0) 0 (0) 1 (2)# 0 (0) 24 (52)# 170 (11) 221 (11) † HER2
+ 7 (2) 9 (8) 13 (14) 4 (3) 1 (1) 5 (3) 18 (8) 55 (15) 5 (8) 2 (3) 4 (10) 3 (10) 6 (9) 18 (44) 0 (0) 7 (15) 150 (10) 157 (8) †
− 290 (65) 102
(92) 72 (79) 130
(97) 68 (93) 140 (97) 157
(71) 139
(37) 50 (83) 17 (29) 35 (90) 27 (90) 56 (86) 22 (54) 0 (0) 10 (22) 1025 (67) 1315 (66) †
N/A 149
(33) 0 (0) 6 (7)+ 0 (0) 4 (5) $ 0 (0) 45 (21)# 184
(49)# 5 (8)# 39
(67) + 0 (0) 0 (0) 3 (5)# 1 (2)# 47
(100)$ 29 (63)# 363 (24) 512 (26) †
Table 2. Comparison of clinicopathological features in MBC studies published since 1996 and examining
>30 cases. 1Includes data from Shaaban et al.9. 2Excludes frozen cases (n = 66). Due to lack of clear definition for grade and/or histological subtypes the analysis excludes refs 13, 15, 50, 51 and 52 which examined 77, 58, 30, 99 and 98 cases, respectively. Numbers in parentheses refer to percentages which were rounded to the nearest whole number. N/A refers to data which was not available#, missing+ or not reported$. †These cases were stratified into molecular subtypes and hormone receptor status was not reported specifically.
respectively. Lobular carcinoma was the second most common histology in both cohorts. The “other” category included cribriform, papillary, intraductal papillary, micropapillary, mucinous and DCIS. Cases were predomi- nantly ER (84%, our cohort; 82% combined) and PR positive (74% our cohort; 71%, combined). HER2 expression was infrequent in our cohort (2%), and seen in 10% of cases from the combined cohort. Grade break down was very similar: grade 1 (11% our cohort; 13% combined), grade 2 (40%, our cohort; 44% combined), grade 3 (31%, our cohort 30%; combined). Despite missing/unavailable for grade (19%), node status (42%) and HER2 (33%) in our cohort, with the possible exception of node status, this was fairly typical of the other studies, illustrating the representativeness of our cohort. While this work was under review, data from the International Male Breast Cancer Pooling Project was reported31 and the characteristics of this cohort are presented for comparison in the final column of Table 2. Excluding missing data, this further emphasises the similarities of the datasets.
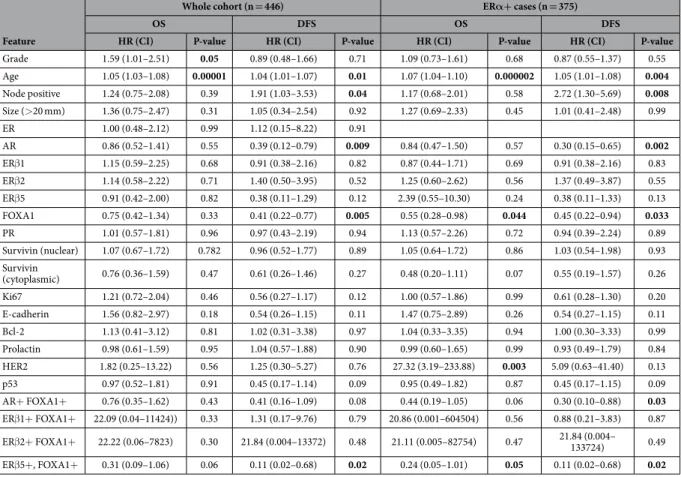
Effect of tumour characteristics and biomarker expression on survival. Tumour characteris- tics. We performed univariate analysis on the whole cohort (n = 446) and in ERα + cases only (n = 375), con- sidering the effects of grade, age, lymph node status and tumour size. This is shown in Table 3. Advanced age, was the strongest predictor of OS and DFS, both in the whole cohort (HR: 1.05 (1.03–1.08), p = 0.00001; HR:
1.04 (1.01–1.07), p = 0.01), respectively and in ERα+ cases only (HR: 1.07 (1.04–1.10), p = 0.000002; HR: 1.05 (1.01–1.08), p = 0.004), respectively. Node positivity was significantly associated with DFS in the whole cohort (HR: 1.91 (1.03–3.53), p = 0.04) and in ERα+ cases (HR: 2.72 (1.30–5.69), p = 0.008).
Biomarkers.
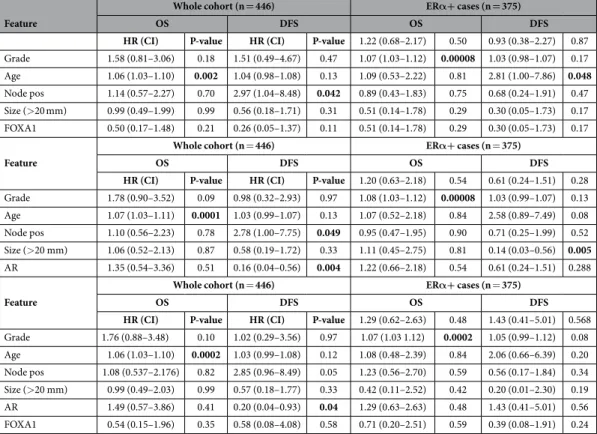
ERα , ERβ 1, ERβ 2, ERβ 5, PR, AR, Bcl-2, HER2, p53, E-cadherin, Ki67, survivin, prolactin and FOXA1 expression were all evaluated (Table 3). In terms of cellular localisation, ERα , ERβ 1, ERβ 2, ERβ 5, PR, AR, Bcl-2, p53, Ki67 and FOXA1 were predominantly nuclear, with characteristic membrane staining seen for HER2 and E-cadherin. Survivin displayed both nuclear and cytoplasmic staining. Examples are shown in Fig. S1.In the ERα+ cohort, Kaplan Meier survival analysis showed that FOXA1 was significantly associated with bet- ter OS and DFS (Fig. 1a and b, Log rank p = 0.04; 0.002, respectively), but did not remain upon multivariate anal- ysis when adjusted for grade, age, size and nodal status (Table 4). AR was significantly associated with improved DFS only (Fig. 1c Log rank p = 0.002), that remained significant with multivariate analysis (Table 4; HR: 0.166 (0.04–0.56), p = 0.004). When evaluated in multivariate analysis with the addition of FOXA1, AR still remained independently significant (Table 4; HR: 0.205 (0.04–0.93), p = 0.04). None of the other biomarkers examined impacted on survival, and, in the case of survivin, was irrespective of its cellular location.
Feature
Whole cohort (n = 446) ERα+ cases (n = 375)
OS DFS OS DFS
HR (CI) P-value HR (CI) P-value HR (CI) P-value HR (CI) P-value
Grade 1.59 (1.01–2.51) 0.05 0.89 (0.48–1.66) 0.71 1.09 (0.73–1.61) 0.68 0.87 (0.55–1.37) 0.55
Age 1.05 (1.03–1.08) 0.00001 1.04 (1.01–1.07) 0.01 1.07 (1.04–1.10) 0.000002 1.05 (1.01–1.08) 0.004 Node positive 1.24 (0.75–2.08) 0.39 1.91 (1.03–3.53) 0.04 1.17 (0.68–2.01) 0.58 2.72 (1.30–5.69) 0.008 Size (> 20 mm) 1.36 (0.75–2.47) 0.31 1.05 (0.34–2.54) 0.92 1.27 (0.69–2.33) 0.45 1.01 (0.41–2.48) 0.99
ER 1.00 (0.48–2.12) 0.99 1.12 (0.15–8.22) 0.91
AR 0.86 (0.52–1.41) 0.55 0.39 (0.12–0.79) 0.009 0.84 (0.47–1.50) 0.57 0.30 (0.15–0.65) 0.002
ERβ 1 1.15 (0.59–2.25) 0.68 0.91 (0.38–2.16) 0.82 0.87 (0.44–1.71) 0.69 0.91 (0.38–2.16) 0.83
ERβ 2 1.14 (0.58–2.22) 0.71 1.40 (0.50–3.95) 0.52 1.25 (0.60–2.62) 0.56 1.37 (0.49–3.87) 0.55
ERβ 5 0.91 (0.42–2.00) 0.82 0.38 (0.11–1.29) 0.12 2.39 (0.55–10.30) 0.24 0.38 (0.11–1.33) 0.13
FOXA1 0.75 (0.42–1.34) 0.33 0.41 (0.22–0.77) 0.005 0.55 (0.28–0.98) 0.044 0.45 (0.22–0.94) 0.033
PR 1.01 (0.57–1.81) 0.96 0.97 (0.43–2.19) 0.94 1.13 (0.57–2.26) 0.72 0.94 (0.39–2.24) 0.89
Survivin (nuclear) 1.07 (0.67–1.72) 0.782 0.96 (0.52–1.77) 0.89 1.05 (0.64–1.72) 0.86 1.03 (0.54–1.98) 0.93 Survivin
(cytoplasmic) 0.76 (0.36–1.59) 0.47 0.61 (0.26–1.46) 0.27 0.48 (0.20–1.11) 0.07 0.55 (0.19–1.57) 0.26
Ki67 1.21 (0.72–2.04) 0.46 0.56 (0.27–1.17) 0.12 1.00 (0.57–1.86) 0.99 0.61 (0.28–1.30) 0.20
E-cadherin 1.56 (0.82–2.97) 0.18 0.54 (0.26–1.15) 0.11 1.47 (0.75–2.89) 0.26 0.54 (0.27–1.15) 0.11
Bcl-2 1.13 (0.41–3.12) 0.81 1.02 (0.31–3.38) 0.97 1.04 (0.33–3.35) 0.94 1.00 (0.30–3.33) 0.99
Prolactin 0.98 (0.61–1.59) 0.95 1.04 (0.57–1.88) 0.90 0.99 (0.60–1.65) 0.99 0.93 (0.49–1.79) 0.84
HER2 1.82 (0.25–13.22) 0.56 1.25 (0.30–5.27) 0.76 27.32 (3.19–233.88) 0.003 5.09 (0.63–41.40) 0.13
p53 0.97 (0.52–1.81) 0.91 0.45 (0.17–1.14) 0.09 0.95 (0.49–1.82) 0.87 0.45 (0.17–1.15) 0.09
AR+ FOXA1+ 0.76 (0.35–1.62) 0.43 0.41 (0.16–1.09) 0.08 0.44 (0.19–1.05) 0.06 0.30 (0.10–0.88) 0.03 ERβ 1+ FOXA1+ 22.09 (0.04–11424)) 0.33 1.31 (0.17–9.76) 0.79 20.86 (0.001–604504) 0.56 0.88 (0.21–3.83) 0.87 ERβ 2+ FOXA1+ 22.22 (0.06–7823) 0.30 21.84 (0.004–13372) 0.48 21.11 (0.005–82754) 0.47 21.84 (0.004–
133724) 0.49
ERβ 5+ , FOXA1+ 0.31 (0.09–1.06) 0.06 0.11 (0.02–0.68) 0.02 0.24 (0.05–1.01) 0.05 0.11 (0.02–0.68) 0.02
Table 3. Univariate analysis of clinicopathological features and biomarkers with respect to ERα status.
Significant P values are in bold. HR = hazard ratio, CI = confidence intervals.
As FOXA1 is emerging as a critical player in breast cancer biology we examined the impact of its co-expression with AR and ERβ isoforms on survival in an ERα+ background. Here, co-expression of AR and FOXA1 (Fig. 1e;
Log rank p = 0.02) was significantly associated with better DFS with a trend towards significance with OS for Figure 1. Kaplan-Meier survival analysis. Kaplan-Meier survival analysis showing the impact of FOXA1 expression on OS (a) and DFS (b), the effect of AR expression on DFS (c) and the impact of AR and FOXA1 co- expression on OS (d) and DFS (e). The number of at risk patients and events over time are displayed under each graph.
AR and FOXA1 (Fig. 1d; Log rank p = 0.06). ERβ 5 and FOXA1 impacted positively on OS (Table 3; HR: 0.24 (0.05–1.01), p = 0.05) and DFS (Table 3; HR: 0.11 (0.02–0.68), p = 0.02). However, this was lost on multivariate analysis (not shown), where age still remained the strongest predictor of survival.
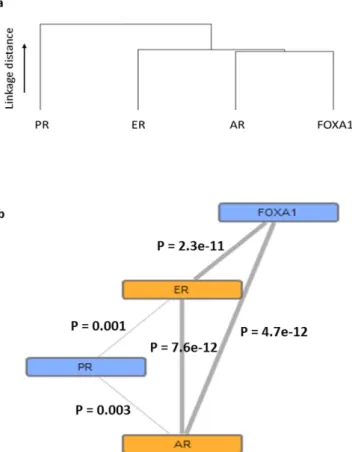
Network inference using TMA Navigator.
Complete scores were available for PR, AR, and FOXA1 in 220 cases. A correlation comparison was undertaken to visualise the grouping of these biomarkers. The dendo- gram (Fig. 2a) demonstrates significant correlation between biomarkers using agglomerative hierarchical clus- tering with complete linkage. This identified ERα , AR and FOXA1 as being significantly correlated within our dataset (Fig. 2b). No association between PR and FOXA1 was observed.Discussion
Efforts towards better understanding the pathobiology of MBC are increasing with a number of groups, including our own, starting to accumulate sufficiently large numbers of cases to extend observations from purely anecdotal towards improving our knowledge of its underlying biology. Our international collaborative effort makes this one of the largest cohorts of MBCs examined to date, examining 446 cases and collating 1540 cases from published studies to identify common features of MBC. We do, however, acknowledge its limitations with regard to missing patient data and treatment information in some of the cases, despite our best efforts to obtain this.
Comparative analysis of clinicopathological data from our cohort with combined data extracted from 15 stud- ies published over the last 21 years, reporting ≥ 30 cases10–12,14,16–19,32–38 was investigated totalling 1984 cases. Key observations from our cohort were that the majority of patients present with ductal histology, grade 2, with high incidence of ER and PR expression, reflective of luminal A phenotype. Nodal positivity was detected in approxi- mately half of cases where this was known, with HER2 expression being much less frequent in all but one study, which reported almost 30% of cases as HER2 positive, which was confirmed by FISH33. Not only were these observations reflected in our cohort but they were also observed in the combined data from other studies exclud- ing our own, which, with the exception of HER2, was very similar to our own cohort, and concurs with recent SEER data39. This highlights the representative nature of our cohort for further study. Furthermore, while this article was under review, the International Male Breast Cancer Program40 reported clinicopathological features of 1328 MBCs, with similar characteristics to our own (Table 2). We acknowledge a weakness of our study is the lack of complete information on node status in 41% of cases, despite out best efforts to obtain this. Nevertheless, missing node status was the most frequently under-represented variable in the studies outlined in Table 2, aver- aging 25% attrition, due to missing, unavailable or unreported data, especially in cohorts in excess of 200 cases, including those from the International Male Breast Cancer Program16,31,33.
The median age of our cohort was 67 years (range 30–97), in concordance with the average age of diagnosis of MBC, which is typically 10 years older than that seen for female breast cancer2. In this respect it is perhaps
Feature
Whole cohort (n = 446) ERα+ cases (n = 375)
OS DFS OS DFS
HR (CI) P-value HR (CI) P-value 1.22 (0.68–2.17) 0.50 0.93 (0.38–2.27) 0.87 Grade 1.58 (0.81–3.06) 0.18 1.51 (0.49–4.67) 0.47 1.07 (1.03–1.12) 0.00008 1.03 (0.98–1.07) 0.17 Age 1.06 (1.03–1.10) 0.002 1.04 (0.98–1.08) 0.13 1.09 (0.53–2.22) 0.81 2.81 (1.00–7.86) 0.048 Node pos 1.14 (0.57–2.27) 0.70 2.97 (1.04–8.48) 0.042 0.89 (0.43–1.83) 0.75 0.68 (0.24–1.91) 0.47 Size (> 20 mm) 0.99 (0.49–1.99) 0.99 0.56 (0.18–1.71) 0.31 0.51 (0.14–1.78) 0.29 0.30 (0.05–1.73) 0.17 FOXA1 0.50 (0.17–1.48) 0.21 0.26 (0.05–1.37) 0.11 0.51 (0.14–1.78) 0.29 0.30 (0.05–1.73) 0.17
Feature
Whole cohort (n = 446) ERα+ cases (n = 375)
OS DFS OS DFS
HR (CI) P-value HR (CI) P-value 1.20 (0.63–2.18) 0.54 0.61 (0.24–1.51) 0.28 Grade 1.78 (0.90–3.52) 0.09 0.98 (0.32–2.93) 0.97 1.08 (1.03–1.12) 0.00008 1.03 (0.99–1.07) 0.13 Age 1.07 (1.03–1.11) 0.0001 1.03 (0.99–1.07) 0.13 1.07 (0.52–2.18) 0.84 2.58 (0.89–7.49) 0.08 Node pos 1.10 (0.56–2.23) 0.78 2.78 (1.00–7.75) 0.049 0.95 (0.47–1.95) 0.90 0.71 (0.25–1.99) 0.52 Size (> 20 mm) 1.06 (0.52–2.13) 0.87 0.58 (0.19–1.72) 0.33 1.11 (0.45–2.75) 0.81 0.14 (0.03–0.56) 0.005 AR 1.35 (0.54–3.36) 0.51 0.16 (0.04–0.56) 0.004 1.22 (0.66–2.18) 0.54 0.61 (0.24–1.51) 0.288 Feature
Whole cohort (n = 446) ERα+ cases (n = 375)
OS DFS OS DFS
HR (CI) P-value HR (CI) P-value 1.29 (0.62–2.63) 0.48 1.43 (0.41–5.01) 0.568 Grade 1.76 (0.88–3.48) 0.10 1.02 (0.29–3.56) 0.97 1.07 (1.03 1.12) 0.0002 1.05 (0.99–1.12) 0.08 Age 1.06 (1.03–1.10) 0.0002 1.03 (0.99–1.08) 0.12 1.08 (0.48–2.39) 0.84 2.06 (0.66–6.39) 0.20 Node pos 1.08 (0.537–2.176) 0.82 2.85 (0.96–8.49) 0.05 1.23 (0.56–2.70) 0.59 0.56 (0.17–1.84) 0.34 Size (> 20 mm) 0.99 (0.49–2.03) 0.99 0.57 (0.18–1.77) 0.33 0.42 (0.11–2.52) 0.42 0.20 (0.01–2.30) 0.19 AR 1.49 (0.57–3.86) 0.41 0.20 (0.04–0.93) 0.04 1.29 (0.63–2.63) 0.48 1.43 (0.41–5.01) 0.56 FOXA1 0.54 (0.15–1.96) 0.35 0.58 (0.08–4.08) 0.58 0.71 (0.20–2.51) 0.59 0.39 (0.08–1.91) 0.24
Table 4. Multivariate analysis of clinicopathological features and biomarkers with respect to ERα status.
Significant P values are in bold. HR = hazard ratio, CI = confidence intervals.
unsurprising that our analysis showed that advanced age was the strongest predictor of outcome, as reported in female breast cancer where those over 80 years of age had poorer survival, independent of their stage at diagnosis or the diagnostic period41. Nodal positivity and AR positivity were negatively prognostic for recurrence, in line with other works9.
As MBC is characteristically predominantly ERα -positive we evaluated the effect on outcome in ERα -positive cases only (84% of our cohort), investigating several biomarkers for their impact on survival. We found FOXA1 expression was positively prognostic for both OS and DFS. Often described as a pioneer factor, FOXA1 is emerg- ing as a critical player in hormone dependent cancer, including breast42 and, in a meta-analysis, has been found to be significantly associated with ERα status in female patients43. FOXA1 correlates with survival duration in female breast cancer, where cases with high expression had significantly better survival44. Our results corroborate these findings for DFS in MBC. Although, this is the first time FOXA1 has been shown to positively impact sur- vival duration in MBC, this was lost on multivariate analysis.
FOXA1 has the ability to bind to compacted chromatin, making these regions more accessible to other tran- scription factors, notably ERα and AR45. Since FOXA1 is a major determinant of ERα activity42, we assessed the impact of co-expression of FOXA1 with AR and ERβ isoforms. FOXA1 alone and AR expression alone was significantly associated with better DFS than ERβ 5 alone. We have previously demonstrated the impact of ERβ 5 in FBC survival46. While ERβ isoforms have been reported previously in MBC9, these did not impact on survival9. Interestingly, ERβ 5 and FOXA1 co-expression showed a significant impact on DFS duration in MBC and showed a trend towards significance for OS.
FOXA1 typically works in cooperation with another transcription factor, GATA3. While we did not evaluate GATA3 in our work, a previous study has shown GATA3 positivity in only 6 out of 19 MBC (32%), compared to 82% of female breast cancer47. Furthermore GATA3 expression did not impact on survival in MBC, unlike FBC, where significantly increased mortality was observed. This suggests that the role of GATA3 may not be as important a transcription factor in MBC compared with female breast cancer, but further validation is required.
In the current study and previous work (which included 251 of the 446 cases evaluated in this study), AR expression was associated with better outcome in MBC9, for DFS but not OS, and this association remained upon multivariate analysis. AR is expressed across the main molecular subtypes of breast cancer and is gradually becoming recognised as a potential target for therapy in both genders48. Our results confirm these findings and could indicate potential use of anti-androgen therapy to treat MBC as demonstrated successfully in a recent report49.
Figure 2. Correlative biomarker relationships. Dendrogram showing biomarker correlations using agglomerative hierarchical clustering with complete linkage (a) with an example protein network (b) showing significant correlation relationships indicated by the thickness of line connections. Nodes range from blue to orange, indicating low to high degree of significance, respectively. P values are displayed on the image.
We also identified a significant correlation of ERα , AR and FOXA1 expression using hierarchical clustering and correlation network analysis, with weaker, although still statistically significant, association with PR. We previously identified that ERα clustered with AR and ERβ in male but not female breast cancer which clustered with ERα and PR9.
In line with our findings, a previous study examining survivin in MBC showed no effect on survival, irrespec- tive of its cell location17. However, none of the other biomarkers examined influenced outcome in MBC, despite showing significance in female breast cancer. This agrees partially with Kornegoor who showed no effect of Bcl2 on MBC survival but reported that p53 and HER2 were associated with poor survival10. Such disparity could be a reflection of cohort size, or potentially may suggest further differences in underlying biology between genders which is starting to be illuminated9.
In conclusion, the majority of MBC are luminal A, ductal grade 2 with nodal positivity in approximately half of all cases with HER2 expression being rare. While MBC expresses many of the same biomarkers as female breast cancer, of those examined, we found only AR remained significant upon multivariate analysis, providing potential for AR blockade to be employed therapeutically.
References
1. Ferlay, J. et al. Cancer incidence and mortality worldwide: sources, methods and major patterns in GLOBOCAN 2012. International journal of cancer. Journal international du cancer 136, E359–386, doi: 10.1002/ijc.29210 (2015).
2. Giordano, S., Cohen, D., Buzdar, A., Perkins, G. & Hortobagyi, G. Breast carcinoma in men: a population-based study. Cancer 101, 51–57 (2004).
3. CRUK. Breast cancer incidence in males. Available: http://www.cancerresearchuk.org/health-professional/cancer-statistics/
statistics-by-cancer-type/breast-cancer/incidence-invasive Accessed: 18 Aug 2016 (2014).
4. American Cancer Society: Cancer Facts and Figures 2014. Atlanta, Ga: Avaliable from: http://www.cancer.org/acs/groups/content/@
research/documents/webcontent/acspc-042151.pdf Accessed 19 Aug 2016. (American Cancer Society 2014).
5. Stang, A. & Thomssen, C. Decline in breast cancer incidence in the United States: what about male breast cancer? Breast cancer research and treatment 112, 595–596, doi: 10.1007/s10549-007-9882-3 (2008).
6. White, J. et al. Male breast carcinoma: increased awareness needed. Breast cancer research: BCR 13, 219, doi: 10.1186/bcr2930 (2011).
7. Humphries, M. P., Jordan, V. C. & Speirs, V. Obesity and male breast cancer: provocative parallels? BMC Med 13, 134, doi: 10.1186/
s12916-015-0380-x (2015).
8. Clark, J. L., Nguyen, P. L., Jaszcz, W. B., Jatoi, A. & Niehans, G. A. Prognostic variables in male breast cancer. The American surgeon 66, 502–511 (2000).
9. Shaaban, A. M. et al. A comparative biomarker study of 514 matched cases of male and female breast cancer reveals gender-specific biological differences. Breast cancer research and treatment 133, 949–958, doi: 10.1007/s10549-011-1856-9 (2012).
10. Kornegoor, R. et al. Immunophenotyping of male breast cancer. Histopathology 61, 1145–1155, doi:
10.1111/j.1365-2559.2012.04330.x (2012).
11. Masci, G. et al. Clinicopathological and Immunohistochemical Characteristics in Male Breast Cancer: A Retrospective Case Series.
The oncologist 20, 586–592, doi: 10.1634/theoncologist.2014-0243 (2015).
12. Abreu, M. H. et al. Male breast cancer: Looking for better prognostic subgroups. The Breast 26, 18–24, doi: http://dx.doi.
org/10.1016/j.breast.2015.12.001 (2016).
13. Rayson, D. et al. Molecular markers in male breast carcinoma. Cancer 83, 1947–1955 (1998).
14. Zhou, R. et al. Male breast carcinoma: a clinicopathological and immunohistochemical characterization study. International journal of clinical and experimental pathology 7, 6852–6861 (2014).
15. Pinero, A. et al. Positive progesterone receptors and cell proliferation index: an independent association with breast cancer in males.
Breast (Edinburgh, Scotland) 19, 133–136, doi: 10.1016/j.breast.2010.01.001 (2010).
16. Johansson, I. et al. Gene expression profiling of primary male breast cancers reveals two unique subgroups and identifies N-acetyltransferase-1 (NAT1) as a novel prognostic biomarker. Breast cancer research: BCR 14, R31, doi: 10.1186/bcr3116 (2012).
17. Younis, T. et al. Survivin and COX-2 expression in male breast carcinoma. Breast (Edinburgh, Scotland) 18, 228–232, doi: 10.1016/j.
breast.2009.06.003 (2009).
18. Milias, S. et al. Immunohistochemical investigation of CD34 antigen in male breast carcinoma. Clinical and Experimental Medicine 7, 122–126, doi: 10.1007/s10238-007-0133-z (2007).
19. Deb, S., Jene, N. & Fox, S. B. Genotypic and phenotypic analysis of familial male breast cancer shows under representation of the HER2 and basal subtypes in BRCA-associated carcinomas. BMC cancer 12, 510, doi: 10.1186/1471-2407-12-510 (2012).
20. McShane, L. M. et al. REporting recommendations for tumour MARKer prognostic studies (REMARK). British journal of cancer 93, 387–391, doi: 10.1038/sj.bjc.6602678 (2005).
21. Allred, D. C., Harvey, J. M., Berardo, M. & Clark, G. M. Prognostic and predictive factors in breast cancer by immunohistochemical analysis. Mod Pathol 11, 155–168 (1998).
22. Badve, S. et al. FOXA1 Expression in Breast Cancer–Correlation with Luminal Subtype A and Survival. American Association for Cancer Research 13, 4415–4421, doi: 10.1158/1078-0432.ccr-07-0122 (2007).
23. Gill, S., Peston, D., Vonderhaar, B. & Shousha, S. Expression of prolactin receptors in normal, benign, and malignant breast tissue:
an immunohistological study. Journal of clinical pathology 54, 956–960 (2001).
24. Dowsett, M. et al. Assessment of Ki67 in breast cancer: recommendations from the International Ki67 in Breast Cancer working group. J Natl Cancer Inst 103, 1656–1664, doi: 10.1093/jnci/djr393 (2011).
25. Callagy, G. M. et al. Bcl-2 is a prognostic marker in breast cancer independently of the Nottingham Prognostic Index. Clin Cancer Res 12, 2468–2475, doi: 10.1158/1078-0432.ccr-05-2719 (2006).
26. Plesan, D. M., Georgescu, C. V., Patrana, N., Plesan, C. & Stoica, D. Immunohistochemical study of p53 and Ki67 in a group of patients with mammary carcinoma. Romanian journal of morphology and embryology= Revue roumaine de morphologie et embryologie 51, 459–465 (2010).
27. Wolff, A. C. et al. American Society of Clinical Oncology/College of American Pathologists guideline recommendations for human epidermal growth factor receptor 2 testing in breast cancer. Journal of clinical oncology: official journal of the American Society of Clinical Oncology 25, 118–145, doi: 10.1200/jco.2006.09.2775 (2007).
28. Al-Joudi, F. S., Iskandar, Z. A. & Imran, A. K. Correlations in survivin expression with the expression of p53 and bcl-2 in invasive ductal carcinoma of the breast. The Southeast Asian journal of tropical medicine and public health 38, 904–910 (2007).
29. Lubbock, A. L. R., Katz, E., Harrison, D. J. & Overton, I. M. TMA Navigator: network inference, patient stratification and survival analysis with tissue microarray data. Nucleic Acids Research 41, W562–W568, doi: 10.1093/nar/gkt529 (2013).
30. Best, D. J. & Roberts, D. E. Algorithm AS 89: The Upper Tail Probabilities of Spearman’s Rho. Journal of the Royal Statistical Society.
Series C (Applied Statistics) 24, 377–379, doi: 10.2307/2347111 (1975).
31. Doebar, S. C. et al. Male breast cancer precursor lesions: analysis of the EORTC 10085/TBCRC/BIG/NABCG International Male Breast Cancer Program. Mod Pathol, doi: 10.1038/modpathol.2016.229 (2017).
32. Lacle, M. M. et al. Analysis of copy number changes on chromosome 16q in male breast cancer by multiplex ligation-dependent probe amplification. Mod Pathol 26, 1461–1467, doi: 10.1038/modpathol.2013.94 (2013).
33. Ottini, L. et al. Clinical and pathologic characteristics of BRCA-positive and BRCA-negative male breast cancer patients: results from a collaborative multicenter study in Italy. Breast cancer research and treatment 134, 411–418, doi: 10.1007/s10549-012-2062-0 (2012).
34. Liukkonen, S., Saarto, T., Maenpaa, H. & Sjostrom-Mattson, J. Male breast cancer: a survey at the Helsinki University Central Hospital during 1981-2006. Acta oncologica (Stockholm, Sweden) 49, 322–327, doi: 10.3109/02841861003591723 (2010).
35. Wang-Rodriguez, J. et al. Male breast carcinoma: correlation of ER, PR, Ki-67, Her2-Neu, and p53 with treatment and survival, a study of 65 cases. Mod Pathol 15, 853–861, doi: 10.1097/01.mp.0000022251.61944.1d (2002).
36. Willsher, P. et al. Male breast cancer: pathological and immunohistochemical features. Anticancer Res 17, 2335 –2338 (1997).
37. Pich, A., Margaria, E., Chiusa, L., Candelaresi, G. & Dal Canton, O. Androgen receptor expression in male breast carcinoma: lack of clinicopathological association. British journal of cancer 79, 959–964, doi: 10.1038/sj.bjc.6690153 (1999).
38. Joshi, M. G. et al. Male breast carcinoma: an evaluation of prognostic factors contributing to a poorer outcome. Cancer 77, 490–498, doi: 10.1002/(sici)1097-0142(19960201)77:3< 490::aid-cncr10> 3.0.co;2-# (1996).
39. Leone, J. P. et al. Prognostic factors in male breast cancer: a population-based study. Breast cancer research and treatment 156, 539–548, doi: 10.1007/s10549-016-3768-1 (2016).
40. Korde, L. A. et al. Multidisciplinary meeting on male breast cancer: summary and research recommendations. Journal of clinical oncology: official journal of the American Society of Clinical Oncology 28, doi: 10.1200/jco.2009.25.5729 (2010).
41. Brandt, J., Garne, J. P., Tengrup, I. & Manjer, J. Age at diagnosis in relation to survival following breast cancer: a cohort study. World journal of surgical oncology 13, 33, doi: 10.1186/s12957-014-0429-x (2015).
42. Hurtado, A., Holmes, K. A., Ross-Innes, C. S., Schmidt, D. & Carroll, J. S. FOXA1 is a key determinant of estrogen receptor function and endocrine response. Nature genetics 43, 27–33, doi: 10.1038/ng.730 (2011).
43. He, K. et al. Clinicopathological significance of forkhead box protein A1 in breast cancer: A meta-analysis. Experimental and Therapeutic Medicine 11, 2525–2530, doi: 10.3892/etm.2016.3229 (2016).
44. Albergaria, A. et al. Expression of FOXA1 and GATA-3 in breast cancer: the prognostic significance in hormone receptor-negative tumours. Breast Cancer Research 11, 1–15, doi: 10.1186/bcr2327 (2009).
45. Zaret, K. S. & Carroll, J. S. Pioneer transcription factors: establishing competence for gene expression. Genes & Development 25, 2227–2241, doi: 10.1101/gad.176826.111 (2011).
46. Shaaban, A. M. et al. Nuclear and Cytoplasmic Expression of ERβ 1, ERβ 2, and ERβ 5 Identifies Distinct Prognostic Outcome for Breast Cancer Patients. Clinical Cancer Research 14, 5228–5235, doi: 10.1158/1078-0432.ccr-07-4528 (2008).
47. Gonzalez, R. S. et al. GATA-3 expression in male and female breast cancers: comparison of clinicopathologic parameters and prognostic relevance. Human pathology 44, 1065–1070, doi: 10.1016/j.humpath.2012.09.010 (2013).
48. Di Lauro, L. et al. Androgen receptor and antiandrogen therapy in male breast cancer. Cancer letters 368, 20–25, doi: http://dx.doi.
org/10.1016/j.canlet.2015.07.040 (2015).
49. Zhu, J., Davis, C. T., Silberman, S., Spector, N. & Zhang, T. A role for the androgen receptor in the treatment of male breast cancer.
Critical Reviews in Oncology/Hematology 98, 358–363, doi: http://dx.doi.org/10.1016/j.critrevonc.2015.11.013 (2016).
50. Ferreira, M., Mesquita, M., Quaresma, M. & Andre, S. Prolactin receptor expression in gynaecomastia and male breast carcinoma.
Histopathology 53, 56–61, doi: 10.1111/j.1365-2559.2008.03059.x (2008).
51. Rudlowski, C. et al. Her-2/neu gene amplification and protein expression in primary male breast cancer. Breast cancer research and treatment 84, 215–223 (2004).
52. Andres, S. A., Smolenkova, I. A. & Wittliff, J. L. Gender-associated expression of tumor markers and a small gene set in breast carcinoma. The Breast 23, 226–233, doi: http://dx.doi.org/10.1016/j.breast.2014.02.007 (2014).
Acknowledgements
This study was funded by Yorkshire Cancer Research (grant L378). Breast Cancer Now (formerly Breast Cancer Campaign, grant 2007 MayPR02) provided funding for the accrual and construction of TMAs. Thanks to Prof Rosemary Walker and Dr Margaret Jefferies for kindly donating tissue samples.
Author Contributions
Designed study (V.S.); Conducted experiments (M.P.H., S.S.R., H.H.); Scored samples (M.P.H., S.S.R., H.H., A.M.H., A.M.S.); Contributed samples and/or data (H.H., G.C., A.d.B., J.D., L.F., L.J., J.L.J., R.K., M.L., M.M., E.P., S.S., M.S., R.A.W., J.K., I.E., A.N.T., A.M.H.); Analysed data (M.P.H., S.S.R., V.S.); Wrote manuscript (M.P.H., V.S.); Commented on manuscript and approved final draft (all). Contributed to the manuscript equally (M.P.H., S.S.R.).
Additional Information
Supplementary information accompanies this paper at http://www.nature.com/srep Competing Interests: The authors declare no competing financial interests.
How to cite this article: Humphries, M. P. et al. Characterisation of male breast cancer: a descriptive biomarker study from a large patient series. Sci. Rep. 7, 45293; doi: 10.1038/srep45293 (2017).
Publisher's note: Springer Nature remains neutral with regard to jurisdictional claims in published maps and institutional affiliations.
This work is licensed under a Creative Commons Attribution 4.0 International License. The images or other third party material in this article are included in the article’s Creative Commons license, unless indicated otherwise in the credit line; if the material is not included under the Creative Commons license, users will need to obtain permission from the license holder to reproduce the material. To view a copy of this license, visit http://creativecommons.org/licenses/by/4.0/
© The Author(s) 2017