SZÉKFOGLALÓ ELŐADÁSOK A MAGYAR TUDOMÁNYOS AKADÉMIÁN
Bernhard Heck
POTENTIAL OF GEODETIc APPROAcHES TO THE DETERMINATION OF
REcENT cRUSTAL MOvEMENTS
AND DEFORMATIONS
Bernhard Heck
POTENTIAL OF GEODETIC APPROACHES TO THE DETERMINATION OF RECENT CRUSTAL
MOVEMENTS AND DEFORMATIONS
SZÉKFOGLALÓK
A MAGYAR TUDOMÁNYOS AKADÉMIÁN INAUGURAL LECTURES
AT THE HUNGARIAN ACADEMY OF SCIENCES A 2013. május 6-án megválasztott
akadémikusok székfoglalói Inaugural lectures by new members
elected on 6 May, 2013.
Bernhard Heck
POTENTIAL OF GEODETIC APPROACHES TO THE
DETERMINATION OF RECENT CRUSTAL MOVEMENTS AND
DEFORMATIONS
Magyar Tudományos Akadémia • 2014
Az előadás elhangzott 2013. szeptember 19-én Delivered on 19 September, 2013.
Sorozatszerkesztő • Series editor: Bertók, Krisztina
Angol nyelvi lektor • English reader: Torkos, Béla
Borító és tipográfi a • Cover and typography: Auri Grafi ka
ISSN 1419-8959 ISBN 978-963-508-724-2
© Bernhard Heck
Kiadja a Magyar Tudományos Akadémia • Published by the Hungarian Academy of Sciences Kiadásért felel • Person in charge of publication: Lovász, László, az MTA elnöke • President of HAS
Felelős szerkesztő • Editor-in-chief: Kindert, Judit Nyomdai munkálatok • Printed by: Kódex Könyvgyártó Kft.
SUMMARY
Repeated geodetic observations relating to points of the Earth’s surface have become an indispensible tool in geodynamics for delivering precise values of recent crustal movements. Besides terrestrial geodetic observations, like spatial distances, horizontal angles and levelled height increments along levelling lines, satellite observations have become more and more feasible within the past de- cades. In particular, positioning procedures using GNSS (Global Navigation Satellite Systems) and radar interferometry have reached a very high level of precision.
In the paper, an analysis of the properties and error sources affecting the most commonly used geodetic observation procedures such as levelling, GNSS positioning, and InSAR (Interferometric Synthetic Aperture Radar), is pre- sented. While every geodetic approach possesses its own spatial and temporal characteristics, the optimal information content in the various types of obser- vations can be extracted by combining these approaches in regions where all data types are available. In this way, the advantages of every observation pro- cedure can be used, while the disadvantages are mitigated. As a result, highly precise and more or less continuous displacement fi elds in time and space can be produced, which provide an ideal basis for further geodynamic studies, where the geodetic results are used as boundary data and restrictions for geodynamic modelling.
PREFACE
I am very happy and proud to have been elected as honorary member of the Hungarian Academy of Sciences, and I appreciate very much the recognition of my scientifi c work by my Hungarian colleagues.
For my inaugural lecture I have chosen a topic which has kept me busy and raised my interest from the very fi rst days of my scientifi c life: the detec- tion and monitoring of motions and deformations of the Earth’s crust. It is also a topic which provided the major scientifi c relations to my Hungarian colleagues from geodesy:
First, to the late Prof. Dr. Ákos Detrekői; already at the end of the sev- enties we cooperated within an international group working in statistical ap- proaches to the analysis of deformation measurements. Later, it was Prof. Dr.
Péter Bíró; we collaborated in investigating the impact of the gravity fi eld on the analysis of deformations of the Earth’s surface. Finally, with Prof. Dr.
József Ádám we have had various projects in studying the potential of satel- lite navigation systems for detecting deformations in small-scale geodynamic networks.
As a result of these bilateral efforts, a number of joint papers have been published in peer-reviewed journals. In my presentation and the related paper, I have tried to point out some new developments and trends in this fi eld and to demonstrate the respective challenges by some recent projects worked on at my institute.
1. INTRODUCTION
Recent deformations of the Earth’s surface, detectable by precise geodetic observations, are a consequence of geodynamic processes driven by external
and internal forces acting inside and on the Earth. These deformations cause displacements of geodetic benchmarks, which can be detected by repeated geodetic observations, realized either by campaign measurements or by per- manent monitoring. In this way uplift/subsidence and deformation rates can be quantifi ed, providing constraints for modelling ongoing geodynamic pro- cesses. Recently, these geodynamic models have become an indispensable tool in practical applications, such as design of underground nuclear waste deposi- tory, geothermal energy production or CO2 sequestration.
In Chapter 2 three geodetic procedures for monitoring deformations of the Earth’s surface – repeated precise geometric levelling, permanent GNSS observations, and interferometric SAR – are considered in detail, presenting their intrinsic properties, advantages and drawbacks. The practical examples are mostly taken from projects elaborated within the recent years by the work- ing groups at the chair of Physical and Satellite Geodesy at KIT. Most of the case studies refer to the tri-national region of the Upper Rhine Graben, one of the seismically most active regions in Central Europe, situated in the sur- roundings of Karlsruhe. As a synthesis, in Chapter 3, a multi-sensor fusion approach is proposed for exploiting and combining the strengths of the single- sensor solutions and avoiding their disadvantages. Finally, the specifi c challeng- es in creating a rigorous, consistent, unifi ed evaluation model are pointed out.
2. GEODETIC PROCEDURES FOR MONITORING DEFORMATIONS
Geodetic observations on the Earth’s surface have been performed over vari- ous decades or even centuries. Sometimes they were dedicated to the purpose of land surveying, systematically collected by state surveying authorities. Clas- sical terrestrial geodetic measurements often have been combined into geodetic networks; due to the principle of over-determination these networks have been
evaluated by least squares adjustment in order to take into account random ob- servation errors. In this way, some “snapshot” of the geometry of the Earth’s surface is obtained, related to a well-defi ned time instant, called “epoch”. In forming networks and attributing them to specifi ed epochs it is presupposed that there are no deformations of the Earth’s surface within the time period needed for performing the measurements. If the observed region is rather large and it takes a long time to complete a network, or if there are comparably fast motions in the region under survey, this basic assumption is no longer valid.
In this case, the classical procedure of comparing networks at various epochs (“static” deformation analysis) has to be replaced by a kinematic evaluation procedure, considering the geodetic observations scattered in space and time.
Similar principles are also valid for modern space geodetic techniques covering large areas and producing very large data sets.
2.1 Repeated terrestrial levelling
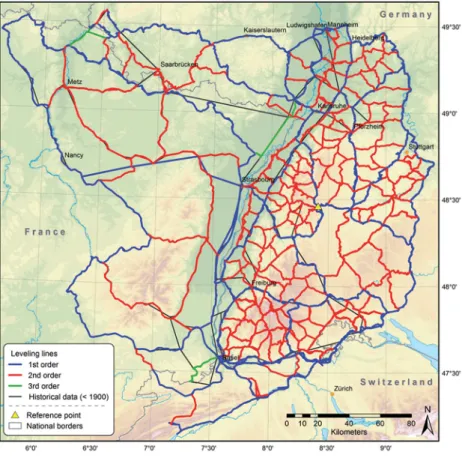
The principle of geometric levelling is very simple: a horizontal sight is pro- duced by the instrument horizon of a levelling instrument, enabling readings at two level rods in backsight and foresight – the difference of these readings is the local height difference between both standpoints of the level rods. Sum- ming up these local height differences observed between any two benchmarks levelling lines are formed, which can be combined to closed loops and fi nally, to levelling networks. An adjustment of these over-determined sets of observa- tions according to the least squares method, founded by C.F. Gauß, is then applied for error control. Considering the precision of the measurements, it is usual to discriminate between levelling lines of 1st to 3rd order. For the region of the Upper Rhine Graben (URG), repeated historical and recent precise levelling data - recorded by the national surveying authorities in South-West Germany, Switzerland, and France - have been merged into a regional network covering a time span of more than 80 years (Fig. 1). This offers the possibility
of detecting small secular, and episodic vertical movements of the Earth’s sur- face with high precision. As the data are measured by different surveying agen- cies and varying instrumentation, they are inhomogeneous in space and time.
It should be stressed that levelling is strongly related to the direction of the vertical, and thus to the Earth’s gravity fi eld. Therefore, the results depend in some way on local and regional variations of the gravity fi eld, producing
Fig. 1: Merged tri-national levelling network in the Upper Rhine Graben region (Fuhrmann et al., 2014)
some kind of non-uniqueness; this non-uniqueness can be eliminated by form- ing geopotential numbers, combining the levelling results with gravity obser- vations along the levelling lines, and performing the least squares adjustment in terms of geopotential numbers (Heck 2003, 281).
Although geometric levelling is one of the most precise geodetic obser- vation procedures, reaching accuracies of 0.2 – 0.5 mm per km double-run levelling, it is subject to various systematic error sources if it is performed over larger areas. These error sources comprise e.g. mislevelling of the instrument, magnetic effects on the compensator, rod graduation and inclination errors, temperature effects on the equipment, Earth tides effects, vertical movements of instrument and rods during the observation, and, in particular, vertical re- fraction.
Due to the long time span of more than 80 years and considering the fact that motions of the order of only about 0.5 mm/year are expected in the URG area, the levelling observations have to be considered as scattered in space and time and cannot be attributed to fi xed epochs. Therefore, a kinematic adjust- ment approach has to be applied to the data in order to extract vertical displace- ment rates. In the kinematic adjustment, any benchmark height is modelled as a time-dependent polynomial of low degree, related to its elevation at a chosen reference epoch and linear, accelerated and higher order terms (Zippelt 1988).
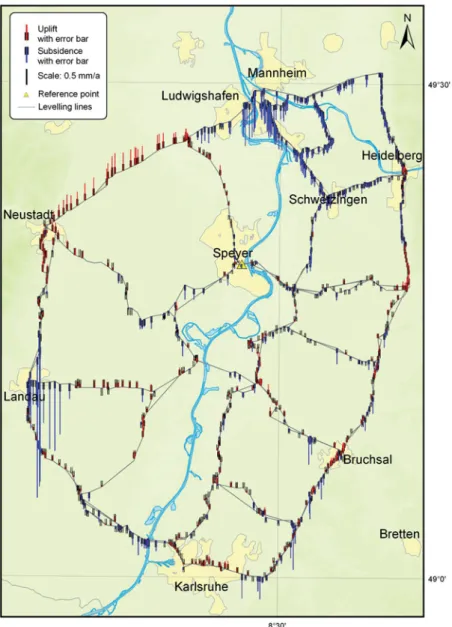
After performing a quality check of the original observations, the respective polynomial coeffi cients have been estimated by an adjustment procedure based on a Gauß-Markov model (Fuhrmann et al. 2013a). Since levelling is a relative observation procedure, resulting in height differences, some stable reference benchmark has to be selected, assuming that no motion takes place at that point. As a result, maps of line-wise vertical displacement rates are produced, which can be transferred to surface models by some extrapolation procedure.
In Fig. 2 an example covering part of the northern URG network is illustrated.
Most of the displacement rates are small, concluding that the area behaves stable in general. A small tectonic uplift, amounting to about 0.3 mm/year, is visible in the northwest of the URG, while the subsidence in the Mannheim/
Ludwigshafen and Landau regions is of anthropogenic origin. Possibly the subsidence in the region of Mannheim is caused by groundwater withdrawal, while the strong subsidence signal of up to 4 mm/year near the city of Landau is due to oil extraction (Fuhrmann et al. 2013c).
In conclusion, the characteristics of repeated geodetic levelling as a pro- cedure for the determination of recent crustal motions can be summarized as follows: results are available only along the levelling lines, due to line-wise registration of displacements, and only the vertical components are observable.
In many regions, the data sets comprise a long time basis of several decades, up to nearly one century. In the evaluation of levelling data, the fact has to be con- sidered that, in general, no fi xed observation epoch exists, the measurements being scattered over time. For this reason, kinematic evaluation models have to be applied. Furthermore, it has to be kept in mind that uplift/subsidence rates are only available along the levelling lines, while no information exists within the levelling loops. Since levelling is a relative procedure, a stable refer- ence point has to be selected showing no motions over the period of evaluation.
Still challenging is the choice of the stochastic model within the least-squares adjustment; this problem can be solved e.g. by variance component estimation (Fuhrmann et al. 2014).
2.2 Permanent GNSS observations
Positioning by the aid of the electromagnetic signals transmitted by satellites of Global Navigation Satellite Systems (GNSS) has become an indispensable tool for about two decades for many applications in science and practical life.
Present-day GNSS are based on the ranging principle, i.e. the propagation time between the transmission of the microwave signal at the satellite and the recep-
Fig. 2: Levelling results in the test network Speyer, in the northwestern part of the URG
tion time measured at the antenna of the user/receiver on the Earth’s surface (or on ships, airplanes, or satellites) is the principal quantity. Multiplication of the observed propagation time with the velocity of light provides the distance between the positions of the satellite and the ground station; if the positions of three simultaneously observed satellites with respect to some well-defi ned reference system are available, the position of the user can be derived in the same reference frame, in principle. Due to the fact that the atomic clocks in the satellites and the quartz crystal clocks in the receivers work independently, another simultaneous observation of a fourth satellite is necessary to solve for the synchronisation unknown (Xu 2007).
Besides the propagation time measurements, providing the three-dimen- sional position of the user with meter to sub-meter precision, also the phase of the microwave carrier can be observed after reconstruction of the original sig- nal. In order to exploit the high accuracy of phase measurements, the so-called phase ambiguity, corresponding to the full integer number of wavelengths within the distance to the satellite at the initialisation of the measurements, has to be resolved. By this procedure relative positions with respect to some refer- ence point can be derived with centimetre to millimetre precision (Hofmann- Wellenhof et al. 2008), allowing multiple applications in geodynamic research.
The fi rst GNSS with full operational capability was the US NAVSTAR- GPS (Navigation with Time and Ranging – Global Positioning System), fol- lowed by the Russian GLONASS. At present, some more GNSS arise, like the European Galileo and the Chinese Beidou/Compass systems. Some of these systems or parts of them are compatible and can be jointly used in future (Hof- mann-Wellenhof et al., 2008).
GNSS in general are composed of three segments (Kaplan 1996; Seeber 2003): The space segment consists of the satellites orbiting the Earth and trans- mitting coded microwave signals. The control segment is built up by a number
of permanently observing sites on the Earth’s surface, receiving and process- ing all satellite signals; these observations are used to calculate and predict the orbits of the satellites and to transmit this and other information to the users via the satellite message. Finally, the user segment consists of the receiver, an- tenna and further equipment of the user for determining his position.
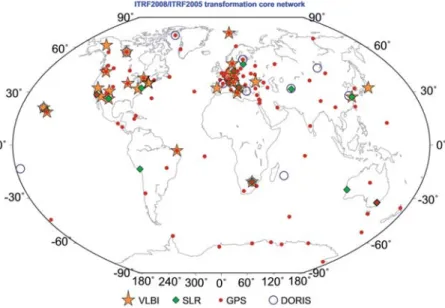
Of utmost importance for the determination of a precise position is an ultra-precise reference frame accessible to the user. A global reference frame with centimetre precision is provided by the International Earth Rotation and Reference Systems Service (IERS), operated by the International Union of Geodesy and Geophysics (IUGG) and the International Astronomical Union (IAU). The primary results of IERS are celestial and terrestrial refer- ence frames, as well as transformation parameters depending on the Earth’s rotation. The latest issue of the International Terrestrial Reference Frame (ITRF) is ITRF2008 (Altamimi et al. 2011), based on GPS observations and other geodetic space methods like Very Long Baseline Interferometry (VLBI), Satellite Laser Ranging (SLR) and DORIS (Doppler Orbitography and Radio Positioning Integrated by Satellite). Any of these space geodetic procedures is managed by a respective service operated by the International Association of Geodesy (IAG), being part of the IUGG. For an overview of the sites contrib- uting to ITRF2008, see Fig. 3.
Another important aspect of precise GNSS positioning is the effect of the Earth’s atmosphere on the propagation of the microwave signal. Two re- gions in the atmosphere have to be discriminated: The ionosphere consists of electrically charged particles and extends from about 50 km to 1500 km above the Earth. For microwave frequencies above 30 MHz the ionosphere behaves as a dispersive medium, producing frequency-dependent effects in code and carrier phase observations. This phenomenon is exploited in order to experi- mentally derive the fi rst order ionospheric refraction effects by using two car-
rier frequencies in the transmitted signal, providing a possibility to reduce the observations for the ionospheric effects. The second part of the atmosphere, the electrically neutral neutrosphere, covers the troposphere and parts of the stratosphere and extends from the Earth’s surface to about 50 km. The re- fractivity within the neutrosphere depends on the meteorological parameters of temperature, air pressure, and humidity and is described by neutrospheric models. While the “dry” part of neutrospheric refraction is rather stable in time and produces effects in the distance between receiver and satellite of about 2.6 metres in vertical direction, the water vapour contribution amounts only to about 60 centimetres, but is strongly variable in space and time (Hofmann- Wellenhof et al. 2008). The “wet” component in the neutrospheric delay can
Fig. 3: Site distribution of the ITRF2008 global network highlighting VLBI, SLR and DORIS sites co-located with GPS (Altamimi et al. 2011)
be exploited for deriving the integrated water vapour content in the atmo- sphere (Mayer 2006; Luo et al. 2007; Fuhrmann et al. 2010).
GNSS positioning at various epochs with respect to a stable global refer- ence frame such as ITRF2008 provides the opportunity to detect displacements of geodetic benchmarks caused by geodynamic processes or anthropogenic ac- tivities. Until about the year 2000, when suffi cient receiver equipment was not available, it was usual to perform campaign measurements of local or regional GNSS networks connected to a few reference stations (Rózsa et al. 2005a, b).
This procedure was applied e.g. in a joint Hungarian-German endeavour to de- rive displacements and deformations in the geodynamic test network of Sóskút in the Buda mountains near Budapest (Ádám et al. 2003). As an effect of vari- ous error sources the precision of these campaign measurements was not high enough to detect small motions and deformation rates such as those occurring in the Sóskút network or in the URG area, although advanced-level statisti- cal analysis procedures had been developed and used (Heck 1989). This situ- ation changed with the installation and operation of permanent GNSS sites, enabling to derive and analyse time series of coordinates and displacements.
In the framework of a cooperation between the Geodetic Institute of KIT Karlsruhe and Institut de Physique du Globe, Ecole et Observatoire des Sciences de la Terre (EOST) of the University of Strasbourg, France, and fur- ther partners, the data of permanent GNSS stations in the area of the URG are collected and evaluated on a regular basis (Knöpfl er et al. 2010; Mayer et al.
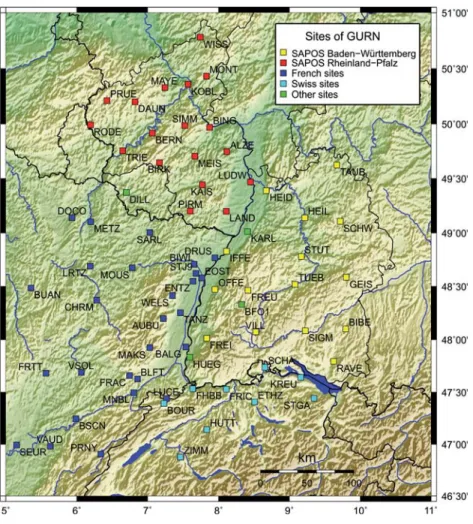
2012; Fuhrmann et al., 2013a). The respective GURN (GNSS Upper Rhine Graben Network) network comprises actually about 80 GNSS sites situated in South-West Germany, France and Switzerland; the data series reach back to 2002, partially also to earlier years (Fig. 4). The data sets are made avail- able by various institutions and are automatically downloaded once per day, providing daily coordinate solutions of all network points by the aid of the
Bernese GNSS Software (Dach et al. 2007). A further extension of GURN to the north is planned.
Fig. 4: Site map of GURN (GNSS Upper Rhine Graben Network)
As a consequence of the observation geometry and the effect of tro- pospheric refraction, the precision of the vertical displacement component is worse than the horizontal components by a factor of about two. The fi rst re- sults of the time series of daily solutions reveal interesting details about the short- and long-term behaviour of the sites (Fig. 5). In some cases, changes of equipment such as GNSS antennae, can be detected in the time series of dis- placements (e.g. site RAVE, red lines), while the effect of snow cover on the an- tenna is clearly visible in the time series of some sites in the mountains (e.g. site AUBU in the Vosges mountains, see Fig. 5). Annual variations, in particular in the height component, may be due to the foundation of the sites and antennas.
Fig. 5: GNSS Upper Rhine Graben Network, fi rst results of coordinate time series
Using different software and independent analysis at EOST and KIT in the processing of GNSS observations, a comparison of the results enables get- ting insight into the external precision of the derived velocity estimates. Pre- liminary results show that the GNSS data are sensitive to resolve small surface displacement rates down to an order of magnitude of 0.4 mm/year (Fuhrmann et al. 2013a). Apart from some minor inconsistencies between the EOST and KIT solutions, the preliminary results concerning the strain fi eld in general fi t well into the overall recent tectonic picture. Some refi nements related to the processing of the GURN data, such as the use of stacking procedures for the mitigation of some error components, are being tested for further improve- ment.
In conclusion, GNSS approaches for determining recent crustal motions are characterized by point-wise registration of the site displacements with re- spect to a global precise reference frame, providing three-dimensional time series of coordinate variations; the precision of the vertical displacement rates is worse than the horizontal components by a factor of two. The discrete displace- ment fi eld given in the vertices of a geodetic GNSS network can be interpo- lated, e.g. by linear prediction within triangular meshes, allowing to calculate local strain and strain rates on a regional basis (Heck 1989), in particular when permanent GNSS sites are involved. In order to consider and mitigate the in- fl uence of small systematic disturbances, a consistent scientifi c evaluation and analysis of the observation data is necessary, sometimes requiring a complete re-processing of the total multi-year data set. Either differential GNSS po- sitioning based on the evaluation of baselines, or the method of precise point positioning (PPP) is applied to the observed carrier phases. Still challenging is the selection of a stochastic model for the adequate statistical description of the precision of the measurements; the rather simple models applied in most pro- cessing software have to be replaced by advanced stochastic models considering spatial and temporal correlations of the phase observations (Luo 2013).
It should be noted that as a side product valuable information about the atmospheric water vapour content can be extracted from the evaluation of pre- cise GNSS carrier phase observations collected in a dense network of perma- nent sites (Fuhrmann et al. 2010; Alshawaf 2014).
2.3 Interferometric SAR
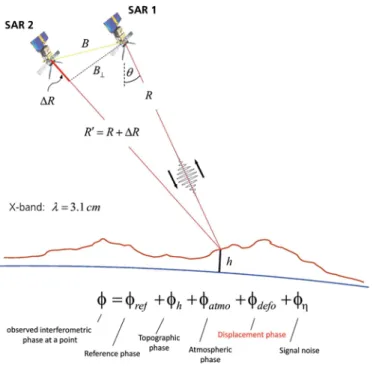
Synthetic Aperture Radar (SAR) is an imaging radar technique using frequen- cy modulated microwave pulses transmitted in slant direction to the ground from an antenna carried by a satellite, fl ying at a typical altitude of about 800 km above the Earth’s surface. E.g. for the ERS-1/2 remote sensing satellites the altitude is 785 km, the look angle is fi xed to 23°, the swath width is 52 km, and the frequency (wavelength) of the transmitted signal is 5.3 GHz (5.66 cm). An analysis of the back-scattered echoes, received by the same antenna, allows determining the amplitudes and – in the interferometric mode – the phases of these electromagnetic signals (Hanssen 2001; Cumming and Wong 2005). SAR interferometry (InSAR) is based on phase differences between im- ages related to repeated tracks of the satellite. For so-called persistent scatterers (Hooper et al. 2007), i.e. permanently coherent resolution cells, this analysis can be performed point- resp. pixel-wise, if some larger number of SAR images covering the same region are available and a time series approach is feasible.
The observed interferometric phase is composed of several contributions, a reference phase, a component induced by topography (look angle error), the atmospheric contribution, the effect of any displacement having occurred be- tween the recordings of the SAR images, and some stochastic noise, see Fig. 6.
For previous missions like ERS-1/2 also the orbit error plays a major role. In order to split the deformation signal from the other components, additional information is required, in particular, a precise digital elevation model for sub- tracting the topographic phase contribution. Atmospheric effects can be aver- aged out if stacks of some 15 or more scenes taken at different atmospheric
conditions are available (Hooper et al. 2007). Furthermore, since the phase measurements are ambiguous with respect to the number of full wavelengths within the distance between the SAR antenna and the ground, the integer number of phase ambiguities has to be resolved by phase unwrapping (Chen and Zebker 2001).
Due to the fact that the radar signal is emitted in a single direction, just a one-dimensional component of the three-dimensional displacement of a reso- lution cell or pixel on the Earth’s surface, namely in the direction of the line of sight (LOS) between the satellite and ground, can be detected. Using images of
Fig. 6: SAR interferometry geometry and decomposition of the interferometric phase (according to Bamler et al., 2008)
the same region taken on ascending and descending orbits helps to mitigate this defi ciency, but complete information on the three-dimensional displacement is only available by a fusion with other external types of observation, e.g. results from repeated levellings or permanent GNSS observations (Hu et al. 2011).
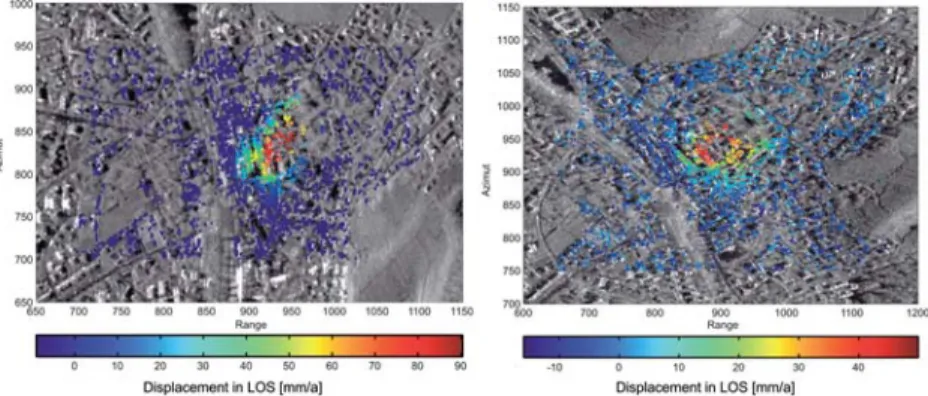
The Persistent Scatterer InSAR (PS-InSAR, PSI) approach has been ap- plied to the detection of motions in the city of Staufen near Freiburg/South Germany. The realisation of a new heating system for the historical city hall based on geothermal energy was accompanied by a leakage in a drill-hole, so that groundwater infi ltrated into a subsurface anhydrite layer causing a volume growth of that layer and uplift of the Earth’s surface. Before the groundwater infi ltration was stopped, the ground in the city centre was uplifted by a rate of 1 cm per month; even two years after the infi ltration process was stopped, the uplift rate is as large as 5 cm per year in the centre of motion. In the meantime more than 200 houses in the city centre show cracks and major damages. For the analysis, a stack of more than 40 radar images from the TerraSAR-X mission covering the period between January 2008 and July 2010, have been acquired. Due to the use of electromagnetic signals in the X-band (TerraSAR- X radar frequency 9.65 GHz) and the respective small wavelength (3.1 cm) the derived LOS displacements are very precise. A major number of persistent scatterers, which can be identifi ed as roofs of houses, streets, etc., are available in the centre of the city. In addition to the PSI-analysis based on ascending and descending orbits, also the results of repeated levellings have been made available, allowing a comparison of these techniques for selected scatterers in the vicinity of levelling benchmarks. The levellings have been performed on a regular basis, every two weeks. Fig. 7 shows the stacked linear LOS displace- ments for the ascending and descending orbits, indicating a signifi cant differ- ence in the magnitude of the displacement signals.
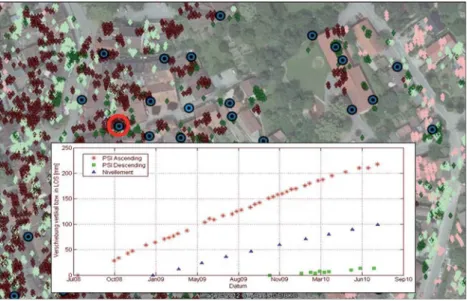
Furthermore, Fig. 8 illustrates the LOS displacements for ascending and descending orbits for a specifi c PS-point, jointly with the results of levelling of a close benchmark. The discrepancies between the three time series can easily be explained by the fact that the total displacement consists of horizontal and vertical components, but the observation geometry is different for the three measurement series. While repeated levellings provide the vertical component of motion, the projection of the spatial displacement on the respective lines of sight for ascending and descending orbits provides different views: as a result of the different observation geometry the LOS displacements derived from descending orbits are much smaller than those obtained from ascending orbits (Schenk and Westerhaus 2012).
On a larger scale, the potential of the PS-InSAR approach has also been investigated in the URG region, based on ERS-1/2 and Envisat data from as- cending and descending orbits. These data, covering a period from 1992 to 2000 and 2002 to 2010, respectively, have been processed by the StaMPS (Stanford Method for Persistent Scatterers) software package (Hooper et al.
2007). As expected, the majority of PS points are located in urban areas. As the
Fig. 7: Results of PSI processing of SAR images for the city of Staufen related to ascending and descending orbits (Schenk and Westerhaus, 2012)
displacements in the URG area are rather small and the analysed SAR data cover a large area, the separation of atmospheric and orbit errors plays an im- portant role (Fuhrmann et al. 2013b). These investigations are still going on;
for the future, the use of TerraSAR-X and Sentinel data is envisaged.
In conclusion, the Persistent Scatterer InSAR approach provides one- dimensional displacement components in the LOS direction for permanently scattering resolution cells in the form of time series. A complete detection of three-dimensional displacements requires analysing data from ascending and descending orbits, as well as including further external information. The total time basis of this approach amounts to 1 – 2 decades, depending on the availabil- ity of respective SAR satellite missions. The temporal resolution of the InSAR technique is comparably low, being equivalent to the repeat orbit rate, which
Fig. 8: Line of sight displacements in the city of Staufen resulting from ascending and descending TerraSAR-X orbits, and levelling results (Schenk and Westerhaus, 2012)
is e.g. 35 days for ERS-1/2 and Envisat, and 11 days for TerraSAR-X orbits.
Since the InSAR technique is based on phase measurements, the problem of correct integer phase unwrapping has to be solved. Being a relative procedure, a reference point has to be selected, for which the hypothesis of no motion should hold. Varying vegetation produces problems due to loss of coherence;
this property makes its application problematic in densely populated regions and intensive farming areas. While the precision of the calculated orbits is practically suffi cient for recent missions, the elimination of atmospheric ef- fects is still a challenging topic in repeat track SAR missions (Alshawaf 2014).
3. MULTI-SENSOR FUSION
As a general result from the presentation and discussion of the various proce- dures for the determination of recent crustal motions and deformations, it can be concluded that the space-time properties of the single-sensor approaches are strongly different. Displacements derived from continuous GNSS phase obser- vations are obtained at single points on the Earth’s surface, yet in three space dimensions, which can be decomposed in horizontal and vertical components.
Based on daily solutions the precision of relative positioning in the horizontal direction is about 1 mm (standard deviation), while for the vertical component it is about 2.5 mm, due to peculiarities of error propagation. The total available time basis for GNSS observations covers a few decades; for the GURN net- work in the URG area it amounts to about 10 years for most sites.
Repeated levelling provides displacement components in the vertical di- rection only, referring to benchmarks along the levelling lines. A precision of the displacement rates of 0.2 mm/year can be achieved. Based on historical measurements, carried out by the national surveying authorities every 20 to 30 years, the total time span covered by precise levellings may reach up to 100 years.
In contrast, InSAR is a relatively new satellite-based approach, covering a time span of up to 20 years only. Depending on the back-scattering properties of the Earth’s surface in the region, displacements of a large number of surface points can be simultaneously detected, producing a good spatial distribution.
The temporal resolution of the InSAR measurements depends on the repeti- tion rate of the satellite orbits and amounts to 11 days for the TerraSAR-X mis- sion and 35 days for the ERS-1/2 and Envisat missions. Only one-dimensional displacements in the LOS direction can be detected, achieving a precision of about 2 mm/year with the PS-InSAR technique if at least 15 radar scenes of the considered region are available.
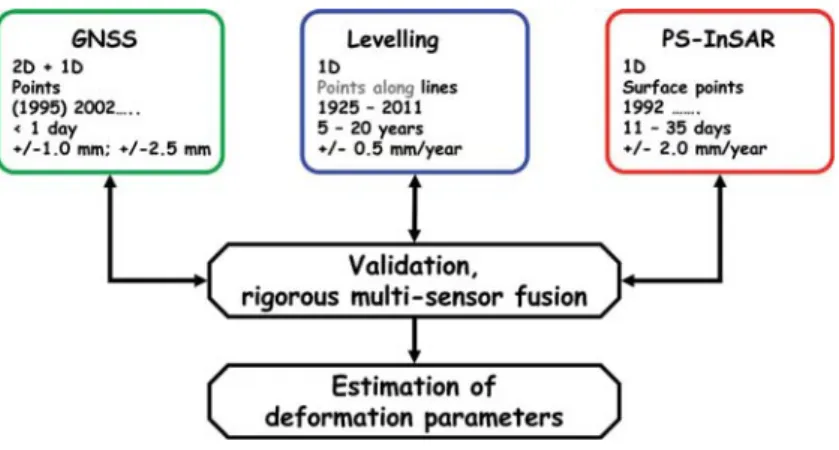
In order to exploit the positive characteristics and to mitigate the negative properties of the various geodetic approaches it will be advantageous to merge all types of data in regions where these are available. Multi-sensor fusion with- in a rigorous mathematical concept will allow fi rst of all cross-validating the results of the single-sensor solutions, before exploiting the space-time informa- tion content in an optimal way for the estimation of deformation parameters (for the situation in the URG area see Fig. 9). For this purpose, suitable space- time representations and interpolation procedures have to be developed and investigated, forming the functional part of a unifi ed, consistent evaluation model; potential candidates are approaches based on Kriging procedures (Stein 1999). The functional model part of this synergistic approach has to be com- pleted by a suitable stochastic model, describing the stochastic properties of the observables. The ultimate product of this endeavour will be a homogeneous, highly precise and more or less continuous displacement and deformation fi eld in time and space, which forms an ideal basis for further geodynamic studies, the geodetic results acting as boundary data and restrictions for geodynamic modelling.
4. CONCLUSIONS AND OUTLOOK
Repeated geodetic observations form an important basis for the determination of recent crustal motions and deformations. The considerations about various geodetic approaches such as precise levelling, continuous GNSS observations and InSAR have revealed that every procedure possesses its own space-time characteristics and sensitivity concerning the impact of random and systematic errors. Still challenging is the task of developing a unifi ed evaluation model for multi-sensor fusion, delivering an optimal displacement fi eld in space and time on the one hand, and separating signal and error components in an optimal way on the other hand.
Since geodetic space observations make use of electromagnetic signals propagated through the Earth’s atmosphere, the observables are affected also by atmospheric effects, in particular by the water vapour in the troposphere.
Thus, a natural extension of the unifi ed approach for the determination of dis- placement and deformation fi elds consists in a simultaneous estimation of at-
Fig. 9: Synergistic approach to the estimation of deformation parameters by multi-sensor fusion
mospheric parameters. The fi rst steps in this direction, yet restricting to the derivation of integrated water vapour for improvement of weather prediction and climatological studies, have been undertaken in the past years by vari- ous groups, e.g. in Hungary (Rózsa et al. 2013) and Germany (Fuhrmann et al. 2010; Alshawaf et al. 2012; Alshawaf 2014). A cooperation project between the chairs of Higher Geodesy at the Budapest University of Technology and Economics (BUTE) and Karlsruhe Institute of Technology (KIT) has been formulated and started for the further development of this interesting and im- portant research topic. In this way, the close relationships with the Hungarian colleagues from Geodesy and Earth Sciences will be continued and strength- ened once more within the next years.
ACKNOWLEDGEMENTS
First of all, I would like to thank the members of the Earth Sciences Section of the Hungarian Academy of Sciences for electing me as Honorary Member.
In particular, I am grateful to my Hungarian friends and colleagues from the fi eld of Geodesy, Prof. Dr. József Ádám, Prof. Dr. Péter Bíró, Prof. Dr. Ákos Detrekői (†2012), and Dr. Szabolcs Rózsa. The contributions of the members of the PSG Working Group and collaborators at my chair, MSc Fadwa Alshawaf, Dipl.-Ing. Thomas Fuhrmann, Dipl.-Ing. Andreas Knöpfl er, Dipl.-Geogr. Ju- lia Kubanek, Dr.-Ing. Xiaoguang Luo, Dr.-Ing. Michael Mayer, Dipl.-Ing.
Andreas Schenk, Dr.-Ing. Kurt Seitz, and Dr. Malte Westerhaus are gratefully acknowledged. This research work has partly been funded by the German Research Foundation (DFG) within the project He1433/17-1/2.
REFERENCES
Ádám J., Dede K., Heck B., Kutterer H., Mayer M., Seitz K., Szűcs L. (2003): GPS deformation measurements in the geodynamic test network Sóskút. Periodica Polytechnica, Ser. Civil Engineering, 46(2), 169–177.
Altamimi Z., Collilieux X., Métivier L. (2011): ITRF2008: an improved solution of the interna- tional terrestrial reference frame. Journal of Geodesy 85(8), 457–473.
Alshawaf F. (2014): Constructing water vapor maps by fusing InSAR, GNSS and WRF data. PhD thesis, publication in progress.
Alshawaf F., Fuhrmann T., Heck B., Hinz S., Knöpfl er A., Luo X., Mayer M., Schenk A., Thiele A., Westerhaus M. (2012): Integration of InSAR and GNSS observations for the determination of atmospheric water vapor. In: Krisp J. M. et al. (eds.): Earth Observation of Global Changes (EOGC). Proceedings of EOGC2011, Munich, Germany, April 13-15, 2011, Lecture Notes in Geoinformation and Cartography. Springer, 147–162.
Bamler R., Ádám N., Hinz S., Eineder M. (2008): SAR-Interferometrie für geodätische Anwen- dungen. Allgemeine Vermessungs-Nachrichten 7/2008, 243-252.
Chen C. W., Zebker H. A. (2001): Two-dimensional phase unwrapping with use of statistical models for cost functions in nonlinear optimization. J Opt Soc Am A 18(2), 338–351.
Cumming I. G., Wong F. H. (2005): Digital signal processing of synthetic aperture radar data : algo- rithms & implementation. Artech House, Boston.
Dach R., Hugentobler U., Fridez P., Meindl M. (2007): User manual of the Bernese GPS Software Version 5.0. Astronomical Institute, University of Bern, Stämpfl i Publications AG, Bern.
Fuhrmann T., Knöpfl er A., Luo X., Mayer M., Heck B. (2010): Zur GNSS-basierten Bestimmung des atmosphärischen Wasserdampfgehalts mittels Precise Point Positioning. KIT Scientifi c Re- ports 7561, KIT Scientifi c Publishing.
Fuhrmann T., Heck B., Knöpfl er A., Masson F., Mayer M., Ulrich P., Westerhaus M., Zip- pelt K. (2013a): Recent surface displacements in the Upper Rhine Graben – Preliminary results from geodetic networks. Tectonophysics 602(0), 300–315.
Fuhrmann T., Knöpfl er A., Mayer M., Schenk A., Westerhaus M., Zippelt K., Heck B. (2013b):
An Inventory of Surface Movements in the Upper Rhine Graben area, Southwest Ger- many, from a Fusion of SAR-Interferometry, GNSS and Precise Levelling. In: Proceedings of IAG Scientifi c Assembly 2013 (submitted).
Fuhrmann T., Knöpfl er A., Mayer M., Schenk A., Westerhaus M., Zippelt K., Heck B. (2013c):
Towards a Fusion of SAR-Interferometry, GNSS and Precise Levelling in the Upper Rhine Graben Area, Southwest Germany. In: Proceedings of ESA Living Planet Symposium 2013 (submitted).
Fuhrmann T., Westerhaus M., Zippelt K., Heck B. (2014): Vertical displacement rates in the Upper Rhine Graben area derived from precise levelling. Journal of Geodesy (submitted).
Hanssen R. F. (2001): Radar interferometry - data interpretation and error analysis. Kluwer, Dordrecht.
Heck B. (1989): Geodätische Methoden zur Bestimmung rezenter Krustenbewegungen im lokalen und regionalen Bereich. In: Welsch W. (ed.): Beiträge zum Seminar über rezente Krustenbe- wegungen, Institut für Geodäsie, Universität der Bundeswehr, Munich, 8.-9.6.1989. Universität der Bundeswehr, Munich, Vol 39, 143–170.
Heck B. (2003): Rechenverfahren und Auswertemodelle der Landesvermessung - Klassische und moderne Methoden. 3. Aufl ., Wichmann, Heidelberg.
Hofmann-Wellenhof B., Lichtenegger H., Wasle E. (2008): GNSS – Global Navigation Satellite Systems. Springer, Vienna.
Hooper A., Segall P., Zebker H. (2007): Persistent scatterer interferometric synthetic aperture radar for crustal deformation analysis, with application to Volcán Alcedo, Galápagos.
Journal of Geophysical Research: Solid Earth 112(B7).
Hu J., Zhu J. J., Li Z. W., Ding X. L.,Wang C. C., Sun Q. (2011): Robust Estimating Three- Dimensional Ground Motions from Fusion of InSAR and GPS Measurements. In: Inter- national Symposium on Image and Data Fusion (ISIDF). Tengchong, China.
Kaplan E. D. (ed.) (1996): Understanding GPS – Principles and Applications. Artech House Public., Boston, London.
Knöpfl er A., Mayer M., Heck B., Masson F., Ulrich P. (2010): GURN (GNSS Upper Rhine Graben Network) - status and fi rst results. FIG Congress 2010 - Facing the Challenges - Building the Capacity, 11.-16. April 2010, Sydney. Online: http://www.Fig.net/pub/fi g2010/papers/
ts03c%5Cts03c_knoepfl er_masson_et_al_4380.pdf.
Luo X., Mayer M., Heck B. (2007): Erweiterte Modellbildung zur Erzeugung von hochaufl ösen- den Wasserdampffeldern. Allgemeine Vermessungs-Nachrichten (AVN) 114(5), 179–189.
Luo X. (2013): GPS Stochastic Modelling - Signal Quality Measures and ARMA Processes. Springer Theses: Recognizing Outstanding Ph.D. Research, Springer, Berlin–Heidelberg.
Mayer, M. (2006): Modellbildung für die Auswertung von GPS-Messungen im Bereich der Antark- tischen Halbinsel. Deutsche Geodätische Kommission Vol. C597, Munich.
Mayer M., Knöpfl er A., Masson F., Ulrich P., Ferhat G., Heck B. (2012): GURN (GNSS Upper Rhine Graben Network) - Research goals and fi rst results of a transnational geo-scientifi c network. In: Kenyon S., Pacino M. C., Marti U. (eds.): Proceedings of the 2009 IAG Sympo- sium. Buenos Aires, Argentina, 2009, Springer IAG Symposia, Vol. 136, 673–682.
Rózsa S., Mayer M., Westerhaus M., Seitz K., Heck B. (2005a): Towards the determination of displacements in the Upper Rhine Graben area using GPS measurements and precise antenna modelling. Quaternary Science Reviews 24, 425–438.
Rózsa S., Heck B., Mayer M., Seitz K., Westerhaus M., Zippelt K. (2005b): Determination of displacements in the Upper Rhine Graben Area from GPS and leveling data. International Journal of Earth Sciences 94, 538–549.
Rózsa S., Kenyeres A., Weidinger T., Gyöngyösi A. Z. (2012): Near Real Time Estimation of Integrated Water Vapour from GNSS Observations in Hungary. In: Rizos C., Willis P.
(eds.): Earth on the Edge: Science for a Sustainable Planet. Proceedings of the IAG General As- sembly, Melbourne, Australia, 2011, Springer IAG Symposia, Vol. 139, 31–40.
Schenk A., Westerhaus M. (2012): SAR-Interferometrie zur Bestimmung des vollständigen Bewe- gungsvektors - Möglichkeiten und Grenzen, In: Niemeier W. et al. (eds.). GeoMonitoring.
2012, 207–218.
Seeber G. (2003): Satellite Geodesy. 2nd ed., de Gruyter, Berlin–New York.
Stein M. L. (1999): Interpolation of spatial data: Some theory for Kriging. Springer, New York.
Zippelt K. (1988): Modellbildung, Berechnungsstrategie und Beurteilung von Vertikalbewegungen un- ter Verwendung von Präzisionsnivellements. Deutsche Geodätische Kommission, Vol. C343, Munich
Xu G. (2007): GPS: Theory, Algorithms and Applications. Springer, Heidelberg.