Implementation of a Distributed Genetic
Algorithm for Parameter Optimization in a Cell Nuclei Detection Project
Sándor Szénási, Zoltán Vámossy
Óbuda University, Bécsi 96/B, H-1034 Budapest, Hungary szenasi.sandor@nik.uni-obuda.hu
vamossy.zoltan@nik.uni-obuda.hu
Abstract: The processing of microscopic tissue images and especially the detection of cell nuclei is nowadays done more and more using digital imagery and special immunodiagnostic software products. One of the most promising image segmentation methods is region growing, but this algorithm is very sensitive to the appropriate setting of different parameters, and the long runtime due to its high computing demand reduces its practical usability. As a result of our research, we managed to develop a data-parallel region growing algorithm that is two or three times faster than the original sequential version. The paper summarizes our results: the development of an evolution-based algorithm that was used to successfully determine a set of parameters that could be used to achieve significantly better accuracy than the already existing parameters.
Keywords: tissue image segmentation; data parallel algorithm; GPGPU, genetic algorithm; distributed system
1 Introduction
Nowadays the digital microscope is becoming a more and more popular device among pathologists. In addition to several improvements of the up-to-date devices (good quality, focused photos, the possibilities for objective measurements, etc.) it is worth mentioning that in addition to the suitable IT background, the images gained this way can be subjected to numerous other processes, in addition to simply viewing them once, which can promote later consultation (distribution, categorization [1], remote access, etc.) and can provide for preliminary or post processing of tissue samples.
This kind of processing offers a very promising way of using different segmentation processes with the images received, and in this way the different components of the tissues can be well separated. Appropriately precise recognition
components) can provide a safe background for automated status analysis of the examined patients, or at least it can aid the work of the pathologists with this pre- processing. By means of separating the sick and the healthy tissue parts, the Labeling Index of immunohistochemical reactions used for examining the structures and the evaluation (Scoring) parameters in figures can be given more accurately.
In the course of our research we have analyzed tissue samples taken from haematoxylin-eosin stained colonic tissue samples (Figure 1). The most important structures in these cases that are worth separation are the following: cell nuclei, glands and epithelium [2]. Of course there are a lot of methods for their recognition, but most of them begin with the precise determination of the position of cell nuclei and, on this basis, then attempt to state the position of the other components. There are several alternative methods of searching for cell nuclei; we have improved one of the most promising solutions, namely region growing.
1.1. GPGPU-based Region Growing Algorithm
The process of region growing has already been well proven in practice. It is quite accurate: however, the long runtime due to its high computing demand reduces its practical usability. At the first stage, this could be improved by the development of a new algorithm running in a parallel environment that is implemented on data- parallel GPGPU, resulting in a 3-to-4-fold rate increase [3], which can be naturally further raised by using more GPUs.
The first step in region growing is to select a set of seed points, which requires some idea about the pixels of the required region (we assume that nuclei are usually darker than their environment). In the next step, the neighboring pixels of the initial seed points are examined and it is determined whether the pixel neighbors should be added to the region or not (by minimizing a cost function).
This process is iterated until some exit condition is met.
1.1.1. Searching for Seed Points
The search for seed points is a nicely parallelizable task, since our aim is to find the point with the highest intensity that complies with some rules (it cannot be inside a previously found region, etc.). When running a sequential algorithm on the CPU, this means a single point, but in the case of the GPU, this can result in multiple points, because it is possible to execute multiple cell nucleus searches in multiple blocks. In the latter case, the adjacent seed points can cause problems, since the parallelized search of those can result in overlapping cell nuclei, which would require a lot of computational time to administer.
Figure 1
The selected tissue samples (masked)
Luckily enough, we know what the maximum radius of a cell nucleus can be in an image with a given zoom; so we can presume that the searches started from two seed points (that are at least four times further apart than this known distance) can be considered as independent searches; so they can be launched in a parallelized way. The iteration is continued until the thread runs out of possible seed points, or the required amount of points is gathered for the starting of the efficient region growing.
1.1.2. Parallel Region Growing
Region growing itself consists of the following consecutive steps [3], which depend on each other: first comes the search for possible new contour expanding points; the next step is the evaluation of the available points; then comes the selection of the best valued point; and the last step is the expansion of the area with the selected point. These steps can be very well parallelized on their own, but every operation needs the output of the previous step, so we definitely need the
tissue samples a) B2007_02857_ES_01 b) B2007_02508_PR_01c) B2007_02224_PR_01 d) B2007_02857_ES_02e) B2007_03019_PR_01 f) B2007_03381_PR_01g) B2007_03381_ES_01 h) B2007_02819_ES_01i) B2007_02167_ES_01 j) B2007_00259_PR_02 k) B2007_00259_ES_02
introduction of synchronization points. This significantly reduces the count of the possible solutions, since when using the CUDA environment, we can achieve synchronization methods only within one single block. Thus, it seems practical to assign a single block to the processing of one single cell nucleus.
Region growing itself iterates three consecutive steps until one of the stop conditions is met [3]: (1) It examines the possible directions in which the contour can be expanded. The full four-neighborhood inspection is evidently only required around the last accepted contour point (when starting the kernel, this means the starting seed point). Since the examinations of the neighboring points do not depend on each other, this can be parallelized as well. (2) The various different contour points must be evaluated to decide in which direction the known region should be expanded. For this, a cost function [4] must be calculated for every point that uses more parameters (intensity of the neighbors, average intensity of the region, distance of the point from the seed, etc.). As the values change at the insertion of every new point, they have to be re-calculated at every iteration for every point. This is however a typical data parallelized calculation, so it can be very well parallelized on the GPU. Every thread counts the cost of a single contour point. (3) The contour point with the smallest cost must be selected.
After every iteration, a fitness function is evaluated that reflects the intensity differences between the region’s inner and outer contour, and the region’s circularity. The process continues until the region reaches the maximum size (in pixels or in radius), and its result is the state where the maximum fitness was reached.
For the case when two cell nuclei intersect each other, another stop condition is inserted into the algorithm. According to our experience, the overgrowing of a region into another nucleus can be detected from the intensity changes; the constantly decreasing intensity suddenly starts to increase. Due to this phenomenon, we calculate the time differential of the intensity-differences, and if the resulting function passes a given value, then we stop the region growing.
1.2. Parameter Optimization
However, the region growing algorithm prepared this way has several parameters (parameters of the different filters, parameters of intensity-contrast-dimensions, etc.) the fine tuning of which is as important as the previously mentioned speed increase. Due to the large number of parameters and their reasonably large target set, defining the values manually seems hopeless, so we had to develop an optimization algorithm.
The basis of optimization is the comparison of test results gained with the help of the parameter sets and using the region growing algorithm with the reference results approved as good and then making conclusions from the difference in the two samples as to the appropriateness of the tested parameter set. We have, as a
reference, 41 pieces of tissue samples, processed by trained pathologists; they marked the precise position of the cell nuclei (later we will refer to them as “gold standards”). The test samples are generated on the basis of the given raw tissue sample with the help of the previously developed region growing algorithm. A detailed description of the genetic algorithm managing the populations, including the individual parameter sets, is included in another paper; here we only wish to detail how searching of the parameters could be accelerated. However, it was immediately revealed in practice that the parameter range to be tested is quite large (27 different, independent parameters), and testing of the individual parameter sets is rather time-consuming (because the region growing must be run on the tissue sample, then the gained results have to be compared to the reference result given by the pathologists), consequently the solution that can be run with the classic sequential 1 processor would not give results within a reasonable period of time, in practice. Due to the fact that time-consuming parts (region growing and comparison) are given, and the genetic operators themselves do not demand considerable time, so the reduction of runtime can only be achieved by means of making the genetic algorithm and the evaluations parallel.
2 The Evolutionary Algorithm for Parameter Optimization
2.1. Initial Generation
The initial generation is usually built up using randomly generated instances. If we need to further refine some previously tested parameters, then we have the possibility to place them into the initial generation, but in our case we usually want to start a completely new search. Table 1 shows some of the parameters that have known bounds [5] with a standard distribution. With some technical parameters, it is not possible to perform such preliminary tests; in these cases, the initial values of the parameters are distributed using the currently known best set of parameters.
2.2. Evaluation of Generations
After we create a new generation, we have to evaluate all instances. Since in our case the fitness value of a given instance is determined based on how well the given parameter set stored in the genes performs with the region growing cell nuclei detector algorithm, this means that we need two steps to determine this fitness value:
Table 1
Bounds for some initial parameter
1. First, we must execute the region growing cell nuclei detector algorithm with the given set of parameters on several slides.
2. After this, the results produced by the algorithm with the given parameter set (test result) must be compared with the manual annotations of the Gold Standard slides (the reference result). By averaging the results of the comparisons (for all slides) we get the fitness value for the given parameter set. This value can be used to evaluate the fitness of the given chromosome.
To compare the test and reference results of cell nuclei search methods, we have already developed an evaluation algorithm [6]. There are several approaches of accuracy calculation (e.g. some fuzzy models [7]). Our method is based on the very often used confusion matrix [8] that can be constructed using a comparison of the two result sets. The matrix (assuming we have two possible outcomes) contains the number of true positive (TP), true negative (TN), false negative (FN) and false positive (FP). The accuracy of the region growing is simply the ratio of sum the true values and the sums of all cases.
2.3. Accuracy of One Parameter Set
Our measurement number does not only reflect a pixel-by-pixel comparison;
instead it starts by matching the cell nuclei together in the reference results and in the test results. One cell nucleus from the reference result set can only have one matching cell nucleus in the test result set, and this is true the other way around too: one cell nucleus from the test result set can only have one matching cell nucleus in the reference result set. After the matching of the cell nuclei, the next step is the similarity comparison between the paired elements.
The very critical point of the evaluation is how the cell nuclei are matched against each other in the reference and the test result sets, because obviously this greatly affects the final result. Since this pairing can be done in several ways (due to the overlapping cell nuclei), it is important that from the several possible pair combinations we have to use the optimal: the one that gets the highest final score.
Name lower bound upper bound
Cell nuclei size 34 882
Cell nuclei radius 4 23
Cell nuclei circularity 27.66 97.1
Cell nuclei average intensity (RGB avg.) 36.59 205.01
Seed point intensity (RGB avg.) 0 251
During the practical analysis of the results, we found that on areas where cells are located very densely, we have to loop through a very long chain of overlapped cells, which results in groups that contain very many cell nuclei from the test and from the reference sets as well. Since increasing the number of elements in a group exponentially increases the processing time of the group, it is practical to find some efficient algorithm for the matching; we use a modified backtracking [9] search algorithm, which searches and returns the optimal pairing of a group containing test and reference cell nuclei.
The algorithm above should be executed for every group, and in this way the optimally paired elements can be located (including the elements that are alone in their group and the elements that cannot be paired at all). Evaluating every pair (and single element), and summing up the values, we can determine the weighted total TP, FP, FN pixel numbers that represent the whole solution. These can be interpreted on their own or in a simple way using the aforementioned accuracy equation. For the genetic algorithm, this will be the fitness value of the parameter set represented by the given instance.
2.4. Apply Genetic Operators
2.4.1. Selection of Parents and Survivors
To select the parents and the survivors, we use the so-called roulette wheel selection method [10]. After the evaluation of the current generation, we know the fitness values for all the instances. Knowing these, and Pi: the probability to select the instance #i, Fi: the fitness value for the instance #i, Min(F): the smallest fitness value for the current generation. We have developed the following formula:
(1) Due to the large number of parameters, the search space is reasonably large, so the occasionally occurring instances with exceptionally high fitness value can easily disappear in the next generation due to the obligatory random crossovers. For this reason (similar to elitism [11]) the instances with the highest fitness values are carried along (without crossovers or mutations) into the next generation (not only the single best instance, but the top 30 instances, so 10% of the generation is selected this way). This slightly decreases the number of trial runs per generation, but in this way we guarantee that the best chromosomes are kept and their genes remain constant. A side effect of this is that we get a monotonically increasing series of fitness values for the best instances.
2.4.2. Crossover
It is hard to determine the most effective crossover method in advance. It is advised to use the two-point crossover in the case of a large population, the uniform crossover in the case of a smaller population, less cut points in the case of short chromosomes, and more cut points in the case of large chromosomes. In our case, the size of the population can be considered as reasonably small (because the evaluation of the single instances can be very time consuming, and so we cannot use a large population), while the chromosomes are considered to be reasonably large (27 parameters, several hundred bits altogether). Because of these, we clearly need to use the uniform crossover method.
In our case, it is not feasible to perform the uniform crossover for any bit, because there are some parameters that have to comply with some additional rules (e.g.
divisibility), and the bitwise mixture of those can easily lead us to values that do not belong to the target set. For these reasons, during the crossover we only combine whole genes; for every gene of a new chromosome we use a random number to determine which parent’s gene is inherited. To converge faster, the parent’s gene that belongs to the parent with the greater fitness value has bigger priority. Knowing the probability (Pa) that the gene of parent A is inherited, the probability (Pb:) that the gene of parent B is inherited, the fitness value (Fa) for parent A, the fitness value (Fb) for parent B, and min(F) is the smallest fitness value for the current generation, for every gene. We have developed the following formula used to determine which parent’s gene is used:
(2)
(3) We have already tried another crossover method (where Pa = Pb = 0.5) but it caused significantly slower convergence.
2.4.3. Mutation
It is feasible to use the same type of mutations with genetic algorithms as are used in nature. This is especially important if, after many generations, the changes are reasonably small, and the various parameters have settled around some values. We have defined the mutation arbitrarily (based on the initial test runs) according to the following rules:
The probability of a mutation is separately 10% in every new generation for every parameter.
The size of the mutation is random: there is a 60% chance for a small, a 30%
probability for a medium-sized, and a 10% probability for a large mutation.
2.5. Implementation
The actual implementation was done according to the following criteria:
We are searching for the values of 27 parameters.
The initial generation has 3,000 chromosomes.
Every following generation has 300 chromosomes.
Every parameter set (every instance) is tested against 11 representative tissue samples (Figure 1).
3 Distributed Genetic Algorithms
We can find in the professional literature several methods of making genetic algorithms parallel. The most fundamental of them are [12] and [13]:
A. Systems based on one population: in these cases the genetic algorithm itself is actually not different from the classic sequential solutions. It is only that implementation is attempted to be modified so that the individual genetic procedures can be performed with the same results, but with a shorter runtime.
1. Compiler based automatic parallelism: Parallelization is implemented in this case at a quite low level; here we try to utilize the possibilities of the hardware. In view of the fact that this is mainly a technical possibility, here we can rely on the help of the different compilers in most of the cases because they automatically perform different optimizations in time of compiling [14].
2. One population - parallel evaluation/crossover/mutation: Parallelism is implemented at a higher level in this case. We try to parallelize not only the individual elementary operations themselves, but larger tasks are considered as atomic and they are solved independently of each other.
This coarser granularity makes it possible to extend parallel processing to multi-processor or multi-node systems as well [15].
B. Systems based on several populations: in these cases we do not work necessarily with a global population, but we can manage the development of several, independent populations at the same time. Of course different kinds of relations may be constructed among them, and they can communicate and the results can be compared at the end of processing. Granularity in the names of the two methods is nothing else but the ratio of computations and communication. When this value is high, then we can speak about a coarse grain algorithm; when it is low, then the algorithm is fine-grained.
1. Coarse grain PGAs: The classic case of a coarse grain is when each executing unit is running its own genetic algorithm in the distributed system on an independent population with all of its operations (selection, crossing, mutation). This can be mutually exclusive, if the independent units are completely isolated from each other. Or it can be non mutually exclusive, when there is communication at some level among the populations (typically they distribute the chromosomes with best results among each other). Several other implementations can be imagined. The main point is that the principle of the genetic algorithm does not change, and sequential algorithms run again, but in many populations at the same time [16].
2. Fine grain PGAs: While we often imagine completely separated populations (islands) in the case of coarse granularity, the typical example of fine grain can be a large-sized global population, whose elements are organized in a grid and every element can communicate only with its neighbors (of course with parallelization at the level of the individual instances). Depending on the size of the executing units and of the population, this can be implemented technically in several ways; the arrangement itself and communication with the neighbors demand individual design in each case [17], [18].
3.1. Methods Working on a Global Population
Methods A.1 and A.2 are fundamentally based on the same principles as the traditional sequential genetic algorithms; however they promise quicker implementation depending on the architecture. Due to the fact that all of the executing units work on the same population, this raises several problems (closures, communication, time loss due to waiting for each other), these losses must be considered by all means before making decision. Based on the recommendations of the professional literature [14], it is clear that they only have raison d’être if the operations with the individual instances are computationally demanding and time consuming.
This is typically true in our case, since full region growing must be run for each set of parameters, and then the evaluation of the gained results must be performed (because we need fairly exact scoring here, it takes longer than region growing itself) and it should be done not only for one but for several tissue samples after each other. As compared to the costs of these operations, the resource demand of the different genetic operators (parent selection, crossing, mutation) themselves are negligible, so it is practically worth choosing from the A versions.
A.2 offers more possibilities for us because local optimization provided by the compilers gives fairly limited possibilities, and here we would like to accelerate
not the genetic operators but the evaluation of the fitness function of the individual elements. The master-slave method offers a well-implementable solution for this;
it can appropriately and efficiently utilize our available resources. In addition, we have found several where it lives up to the promises [19], [20], [21], [22].
3.2. Methods Working on Several Populations
Method B.1 is very popular, too, though it has several limits [21]:
Perfect utilization of the processing units demand more attention when dimensioning the populations.
Certain steps of evolution can be reproduced only with difficulty due to asynchronous nature of population processing and migration.
Communication among the independent islands makes the model much more complicated.
And even if the benefits are undoubted in certain cases, they are less dominant for us because, due to the above mentioned difficult fitness evaluation, it is clear that scarcity of the resources does not enable us to process a fairly large volume of instances. And because the size of the population will be the bottleneck for the genetic algorithm, maintaining further populations will not give us an advantage.
In the same way, we cannot utilize the benefits of method B.2. It is clear that in our task the evaluation of the fitness function demands the most resources; the other operations (selection, crossing, mutation) are negligible in this respect.
However, in this case, the fine-grained method does not show benefit as compared to the client-server implementation, but it involves fairly many limitations. The greatest problem is loss of liberty in parent selection. Since it is evident that when using the traditional sequential methods any two elements of the full population can be chosen as parents, then in the case of the coarse-grained method, we can choose only from the instances of the given sub-population, and in the case of fine-grained method even stricter limitations must be accepted, since we can choose only from the direct neighbors here [23].
Based on the above, although algorithms working with more populations are more popular, their use in our case does not seem to be practical. One of their great benefits (reduction in communication) does not mean essential development, because it has negligible demand of resource besides evaluation of the fitness function on the one hand; and due to the same difficult evaluation our target is to find the quickest result and this can be probably achieved if we can freely choose from every member of the full global population in the course of crossings.
3.3. Hybrid Solutions
Based on the first experiments it is practical to develop a hybrid system [24] later on. Namely it became clear during the first runs that the processing time of certain instances can importantly differ from each other, and with given combinations of the parameters the runtime of region growing can be either multiple of the average value. Consequently, sometimes such an unfavorable condition may occur that, although each instance of the generation with one exception was processed, the parallel slaves are forced to wait for the result of the last processing. These idle times could be surmounted if the waiting clients would be assigned to processing the instances of another population.
3.4. Master-Slave Implementation
Even though there are numerous advantages of master-slave (simple implementation; the principle is practically the same as the sequential genetic algorithms so it can be simply adapted; it provides very good performance in many cases), one of the biggest problems is fairly high communication demand.
That is why it is practical to undertake preliminary examinations whether it is a real alternative.
Execution time of a master-slave GA is made up of two components:
Time spent on computation: in this case it includes evaluation of the fitness function in the first place. Based on processing of the available 1,550,318 instances the below average value was measured: 1498 ms is the time of region growing run on one image; 8,249 ms is the average time of the following processing. The time of the different genetic operators is practically negligible (0.16 ms in the case of one instance). In the case of the population chosen by us, it is 50 ms per generation.
Time spent on communication: we can speak about communication in master-slave system, when the master distributes the tasks among the clients and when they return the fitness values computed by them. This value depends on the different hardware devices used (network, interfaces) on the one hand, and on the protocol used for communication on the other hand. In this case we can quite well reduce the time of communication with this latter, since only a minimum volume of data needs to be transferred between the master and the slave. At the time of distributing the tasks, the master transmits the required parameters of the region growing, which is (even in a not very economical plain text format) 70.67 bytes on average. Sending of the results means only the transmission of some numerical values; in case of 11 images, it is 539.32 bytes on average.
4 Development of the Distributed System
In addition to principle implementation we can find several other possibilities in professional literature in respect to the master-slave model; we developed our own model after having studied them.
There are several standardized techniques available today for developing the distributed system, including very complex ones suitable for industrial applications, too [25], [26], [27] (cloud, grid, etc.). Although they could have provided a very fashionable and elegant solution for running of the genetic algorithm, their use would involve disproportionally great extra resources, which is unreasonable in the present experimental phase. The implementation of the genetic algorithm under development could be modified according to the above aspects, but we would have to adapt to the already existing external modules.
These, however, would require important alterations for the purpose of cooperation with the above-mentioned standard systems (the region growing algorithm, the evaluation algorithm), and in certain cases this seems to be unfeasible (the GPU-based region growing algorithm).
The emerging special problems demand specialized solutions, and therefore it is worth returning again to the solutions previously applied for the distributed systems. Although they require a bit more work (the framework is not ready, and it has to be established), as a result, the final achievement will meet the demands in every respect.
During our search, we were able to use infrastructure of the Óbuda University and the resources of some remote computers; however, they raise some special demands, which are all supported by the newly developed system:
The most important aspect is the fact that how many clients can be started changes dynamically over time (we can use for searching only the currently free resources, but they should be completely used if it is possible). The system must support the entering of new clients at optional times, as well as the exiting of the available clients. The system is based on the classical master-worker model [28].
It is essential that the system should use only the possible simplest and usual communication modes (protocols, ports) since it is possible that some of the clients will try to access the server from behind a fire wall.
The installation of the required programs must be as easy as possible for the individual clients; or ideally, no installation should be required. In addition, the possibility of automatic updating should be possible without separate, manual access to the individual work stations.
4.1. Communication between the Genetic Base and the Communication Layer
It was an essential aspect when developing the system that it should be flexible thus enabling simple development of further genetic operators (for the genetic algorithm itself) or protocols (which ensure master-slave communication) later on.
The genetic operations can be located practically within one component in optional implementation; the system only requires the realization of the bellow interface (where type Genom includes the data of one chromosome, mainly in the form of a vector including integers):
Genom CreateRootItem() - It creates a new instance with random parameters. It is called only in case of creating the instances of the initial, randomly created generation.
SelectParents(out Genom g1, out Genom g2) – It chooses two parents (g1 and g2) randomly from the list of the stored instances. Select operator can be implemented by realization of this in compliance with the condition of how we would prefer the instances with better fitness function.
Genom CreateChild(Genom p1, Genom p2)- Based on two parents transferred as parameters it establishes a third instance and then returns it.
Actually it corresponds to the cross operator, and we can determine here which genes should the new instance get from the parents.
Mutation(Genom gen) - Properties of the unit transferred as the parameter can be optionally changed. It complies with the mutation operator usual in genetic algorithms, and implementation is completely optional.
PrepareParentSelector() - It is an auxiliary technical method that runs exactly once before the above methods. It is practical to implement different initializations here (e.g. in the case of choosing the roulette wheel method, the wheel itself has to be created and initialized).
CONST_GENOM_ROOT_CNT – Size of generation #0.
CONST_GENOM_CNT – Size of all generations excluding generation #0.
CONST_ELITISM_PRCNT – Percentage value of elitism. The best instance from each generation that complies with this will automatically be passed to the next generation.
Having implemented the above abstract methods the framework is suitable for development of the initial generation and application of the genetic operator needed later on. Thanks to the above abstraction, the technical details have been well separated from the genetic operations, and thus their complex development becomes possible, e.g. the implementation of the already mentioned distributed operation during evaluation of the fitness function.
Figure 2
Main steps of our distributed genetic algorithm
4.2. Implementation of the Master-Slave Protocol
The operating framework executes the required genetic operators and also manages the evaluation of the fitness function. This latter is executed in distributed mode (Figure 2) and this provides for determination of the protocol to be used. This is important because the operation can be customized in this way depending on how the master-slave settings have been implemented: among processes within one computer (communication actually does not need a network, and it is more practical to use process-level communication supported by the operating system) or among several computers in a local network or among remote computers (it involves significant limits if these computers are behind different firewalls).
Communication between the two sides is realized by an interim component which provides for services with the implementation of the below interface (among others), both towards the master and the slave sides:
Methods to be called from the master side:
ProcessNextGeneration(generationID, List of genoms): master transfers identification of the next generation as well as the list of instances included
Build initial population Execute genetic operations (selection, crossover, mutation)
Create chromosomes and distribute jobs to slaves
Region growing Evaluation Region growing Evaluation Region growing Evaluation Region growing Evaluation Region growing Evaluation Region growing Evaluation
Collect fitness values
Stop criteria? end
start
mastermasterparallel slaves
fitness function evaluation for each of the chromosome received as parameters.
ContinueGeneration(generationID): due to technical reasons, the continuation of an already finished generation or one just under processing may become necessary; the master can initiate this by calling this method.
Methods to be called from the slave side:
LoadWaitingPackets(generationID): a slave can indicate through this method if it would like to join the processing of the given generation.
Genom LockNextProcessable(): it reserves and loads the data of the instance to be evaluated next. Its return value is a Genom structure that includes all of the genes (in the present case, the parameters of region growing).
FinishAndSaveScore(Genom, List of score): after evaluation of the fitness function, the slave can reload the results by this method. Due to the fact that each parameter set has to be run for several tissue samples, the result will be a vector consisting of floating point numbers.
Thanks to the object-oriented approach, the above interface can be implemented in optional form, depending on the condition of how we want to solve actual communication. There are several communication tools to implement parallel genetic algorithms [13]. First, we implemented a version based on FTP protocol [29]. It uses, in fact, a third level for communication, since the server uploads the data on the chromosomes to be processed to a FTP server, the clients download the elements to be processed for themselves and then they upload the results back to the same place.
It has the advantage that no direct contact between the master and slave computers is required; the only key point is that an interim FTP server must be used that is visible from everywhere. Usually FTP protocol itself is allowed on firewalls, so a new client can fairly easily be initiated, if required.
4.3. Ensuring Robustness
During operation of the system robustness is of key importance. Being a distributed system, hundreds of clients can work at the same time, so possibly emerging errors cannot be monitored or repaired manually during runtime; the system should manage every problem. It must be done in such as way that the basic operation will not be affected, but running of the system with the best utilization enjoys priority.
Elimination of the most fundamental problems is simply a task of programming technique. Problems can emerge at any time during operation, e.g. network related errors (network cannot be accessed, server cannot be accessed, etc.) or the outage of hardware devices for shorter or longer periods (e.g. the server is down, certain
clients shut down, power failure, etc.). These problems can be eliminated mainly with a well-developed application architecture; the system is prepared for faulty external network (sending of data from the network, receiving of data from the network) or errors in starting further processes (starting of region growing application), so (depending on the nature of the error) it restarts the operation or perhaps tries to repair it.
Inappropriately selected parameters can cause trouble, too, which makes the region growing and the operation of the evaluation algorithm impossible, or make them more difficult (slowing all down). Because we do not know the relations between the parameters, these problematic parameter sets can emerge at any time and the errors caused by them must be prepared for: empty result, error in program run, increased runtime, etc.
4.3.1. Empty Result
Because we try continuously to alter a fairly large number of parameters in loose relation with each other, parameter sets which are inappropriate for the region growing algorithm frequently emerge (e.g. when the minimum region size given as a parameter is larger than the maximum region size as a parameter). Of course parameter hierarchy and their effect on each other is much more complicated in reality than this, so the involvement of a complex, preliminary control system that will filter out all of the practically meaningless parameters would demand a lot of time (if it could be implemented at all).
We applied in practice the following method: we run the region growing for each generated parameter set; in cases when the parameters are in contradiction, then some kind of faulty response is expected as a final result (typically a response that the program did not find any cell nucleus). Although these evaluations also demand resources, they do not affect the path leading to the result, because the false results coming from the faulty parameters are given rather bad scores during evaluation, so these chromosomes will screen themselves out in the next generations.
4.3.2. Error in Program Run
The inappropriate selection of certain parameters will lead to even more critical results; it can cause a shutdown or a complete freeze of the program. Parameters of the different filters are typical, and they can be rather variable, e.g. they can determine certain ratio in case of the window sizes, or width of the window can be only an even number (in case of some filters), etc. In the ideal case, these are already revealed before the running of the algorithm during preliminary checking;
sometimes, however, these are revealed only during running and then subsequent freezing of the program (because region growing uses external components such as different filters, which can behave completely unpredictably in case of faulty data, so freezing cannot be prevented in every case.)
Diagram 1
Number of invalid chromosomes by generation
That is why a special control has been built in; should the program stop with an error code when evaluating any image, or should it freeze during operation of the region growing application, then the client automatically considers it as 0% result, finishes processing, does not continue with the next image belonging to this parameter set, and invalidates the results of the previous images. It is clear that, because we would not like to deal with a set of parameters later that is not capable of completely processing each image, irrespective of the fact what result has been received with the images where no errors emerged. Although a complex pre- filtering module could be done here that would examine the correctness of the input parameters, we followed here the method that we let the genetic algorithm filter out the faulty parameters themselves.
It works and it is well seen from the post-statistics that while a fairly large part of the components in some first generation stored unusable set of parameters (but do not forget that the initial generation has been actually created with random numbers in certain given intervals, so it is evident that too many contradicting parameters have been made), they have been rapidly cleared out in the later generations; after the 5th generation, these kind of parameters were created only rarely (of course they will never disappear due to mutations and crossings without control, but thanks to the above treatment method they will never get into the next generation). This is shown well by Diagram 1.
4.3.3. Increased Runtime
Chromosomes that do not cause any trouble but importantly do increase the resource demand of processing result in a much greater problem than the above problems. The processing of one image took about 10 seconds in practice, and this value can increase many times with certain settings. This would not cause any problem in itself, because the clients work irrespective of each other; the problem
occurs because each result of the previous generation must be summarized for starting every generation. That is, if a client gets a relatively long-lasting processing, then the other clients (having finished processing each elements of the given generation, lacking other possibilities) are must only wait. In this period, naturally we can use only a fraction of the available resources, so this idle time must be minimized by any means possible, even if certain inaccuracy occurs.
These kind of extremely long processes are worth stopping. In experiments, we limited this time to 1 minute.
Every stoppage due to the time limit involves a negligence of the rules of genetic algorithms. However, it is worth considering that no accuracy is the strength of GA implementation anyway; the more detailed the analysis is, the more important it is that more generations be created and that the parameters which seem to be viable be combined as many ways as is possible. This is fairly resource demanding, so it seems to be practical to try many hundreds of new combinations by using all of our resources, instead of letting the complete system wait for minutes because of the precise evaluation of a single chromosome.
Although the present article speaks only of searching for the ideal parameters, which usually means the set of parameters offering the most accurate result possible, it is worth of considering the fact that region growing is a rather computationally-demanding algorithm, so the incorrect selection of the parameters can either result in a practically unusable algorithm. Considering this aspect, stopping those evaluations that involve unacceptable processing times is even more justified, since they could not be used in practice, irrespective of accuracy.
And although it is not the primary aim of this project, one favorable side effect of this method is that it allows for the filtering out of parameters resulting in very bad runtime as well as the elements supplying poor accuracy.
4.4. Cutting in the Evaluation Algorithm
In addition to region growing, the algorithm evaluating the results has a long runtime in certain cases. In the case that too many elements have to be processed (the number of cell nuclei in the original reference slide or found by region growing are too high) and they have the less than a one-to-one overlap, then more trials will be needed by the backtrack search of the evaluation algorithm. Taking into consideration the above aspects, we use an acceleration technique here, too.
The backtrack algorithm described in our previous article [6] was combined with an extra cutting operation: before the search starts for the ideal pairing, it calculates how many combinations exist (although it will not know how many of them will be actually examined by backtrack) and if the number is more than 1,000,000 then it searches the points where evaluation can be simplified without significantly affecting the final result.
1. In practice this means that it investigates the partial tasks of backtrack individually and finds the solution that brings the greatest fitness value in the case of the individual tasks.
2. Based on these local maximum values, it selects the global maximum of reference and the test cell nucleus pairings that show the greatest overlap irrespective of the other pairing possibilities.
3. This paring will be recorded (just as will be done by the backtrack algorithm at the end of the searching).
4. Because the backtrack algorithm does not have anything to do in this partial task, it clears the full partial task. In the case that the partial task would have required examination of K pieces of paring possibilities, then the full size of the problem space to be overlapped by the backtrack algorithm would reduce to the K-th part.
5. Should the number of the possible combinations still be too high, it restarts this operation, beginning from Step 1.
This method significantly reduced waiting time (since searching time exponentially increases with the number of the possible pairings, and therefore some unfortunately selected pairings would result in drastic waiting time for the whole system). Of course the disadvantage is that the accuracy of evaluation reduces, but thanks to the above method, there is no random element in simplification, so the evaluation process can be repeated at any time and it will give the same result.
5 Assessment of Our Results
5.1. Examination of the Best Results for Every Generation
Due to the used elitism technique, the instances with the best fitness values are automatically carried along into the following generation as well. For this reason, the best fitness values give us a monotonically increasing series of numbers. By examining these values, we can make assumptions about the speed of our optimization.
As a comparison, we can use the parameter set used in [4]. After executing the analysis of the representative 11 tissue samples, the usual evaluation gave us the average accuracy of 78.1%. Currently this can be considered as the basis result and this is compared later with our result. Surpassing this value by any extent can clearly be considered as an improvement.
Diagram 2
Distribution of accuracy by generations
Diagram 2 shows the distribution of the different instances within the various generations. For every generation (horizontal axis) we display the accuracy levels (vertical axis) for every instance, using grey dots. Obviously the dark areas represent many chromosomes with similar results.
It is visible that in the first few generations the instances are usually well below the aforementioned 78.1% value, but after some generations the majority of the population had chromosomes that yielded a better result than this value. By generation #273, the best accuracy was reached at 83.6%; this means an improvement of 5.5% compared to the previous best result. We kept the algorithm running for even more time, but until we stopped it (at generation #440) it produced no generation that had better accuracy than this.
5.2. The Convergence of the Generations
The first few populations (until generation #4 - #5) mostly contained chromosomes with weaker results, which did not even reach the previously known best value (though there were always a few that surpassed this level). This number then quickly increased during consecutive generations. For the first few generations there is a darker grey “patch” around the 70% level; this is because there were chromosomes that were technically viable, but the region growing found no cell nuclei (these are the instances that yielded empty results); and those chromosomes got an average accuracy value of 70% (maybe it is strange, but it is
not a mistake; most pixels of the tissue images are not parts of any cell nuclei, and therefore a blank result is decidedly better than a result with a lot of false positive hits). The first few generations contained a lot of chromosomes like this, and this is why the darker grey patch appears.
The weak results of first few populations were followed by a dynamic growth phase (until generation #100) where the genes that belonged to the instances with good fitness values start to spread, and so the results improve greatly. It is visible that it took a reasonably small amount of time until almost all instances surpassed the critical 78.1% level. This part shows a process that is expected from a genetic algorithm: the chromosomes that started from a broad spectrum gradually converge towards each other, and since they converge mostly to the chromosomes that yield the best results, this means that their average result is increased as well.
This was followed by the last stage, where this dynamic improvement significantly slows down. For a while the program still found better results, partly because of the crossovers, but later most probably it was only because of the mutations. No improvement was made after generation #273, although it can be noted that even after this point there are many different chromosomes present, and they cover a wide range of the search space; but after this point the search process can be more considered as a simple random search rather than a genetic algorithm.
An interesting pattern appeared in the distribution of the results, which can be described as the following:
The algorithm uses the elitism method, so the top 30 instances of every generation are automatically carried into the next generation. As is visible, after generation #200 the instances are so close to each other that on the figure they are displayed as a dark horizontal line (where there are a lot of very similar instances in one place). This does not mean that the top 30 elements are totally identical (there are smaller differences in the various genes), but the evaluation yields the same result for all of them.
Below this line there is a wide light gray strip that contains the newly created instances that (after the crossovers and mutations) yield variously different results. This wide strip is virtually the same during the consecutive generations, and this is true despite the fact that we would expect the crossovers to converge towards some kind of optimum; on the other hand, the mutations are totally random and are more dominant than the crossovers.
It is worth mentioning the light pale strip below the gray strip, which is the result of a single parameter having a special value that degrades the accuracy of the given chromosome by about 2%. The light strip contains only the instances with this special value (this is clearly shown because if we do not display elements with that value, then this light strip disappears).
Diagram 3
Distribution of accuracy by generations
We also need to examine our results considering the aspect of how long the algorithm should run. As we stated above, we do not have any expected final results at which point the processing should stop; but there could still be some conditions where the search should be terminated. One such condition could be if the consecutive generations contain instances that have genes that are so close to each other that the crossovers make no substantial changes.
For a better view, it is practical to examine the variance of the accuracy values for the various instances (Diagram 3). As is expected, the variance is pretty high in the beginning for the randomly generated instances and in the first few generations, but as the more viable instances spread, this is quickly decreased.
Then, after a while, this drop of variance stops and the variance remains stable.
Although we would expect that with a genetic algorithm the variance would keep dropping (because the elements get more and more closer to an optimal result and to each other), this did not happen in our case. The reason behind this is that we set the size and the probability of the mutations to a pretty high value, because we have a reasonably large search space, and we tried to make the search process faster using a quite high ratio of mutations. But the many mutations prevent the genes from settling at an ideal value, so the variance cannot decrease any more.
And even though the variance is high, our results show that the search gradually continued in a good direction, and the elitism method made sure that it did not change course.
It is however clearly visible that we cannot set a stopping condition based on the distances of the chromosome from each other, because due to the mutations we cannot set such a limit. For this reason, we stopped the search when no
improvement was shown for 200 generations. Of course, because of the mutations we cannot say that there will be no improvement from the achieved maximum accuracy, but it is probably more practical to use our resources for a new search that is based on our final results used as an initial population.
Diagram 3 shows a curiosity: the variation increases only once, when stepping from the first to the second generation. After examination of every instance it became clear that this happens because of the many non-viable instances in the first generation; and because of the chromosomes that give empty results after the region growing algorithm. The many similar instances (even though their results cannot be considered as usable results) gave us the lower variance value.
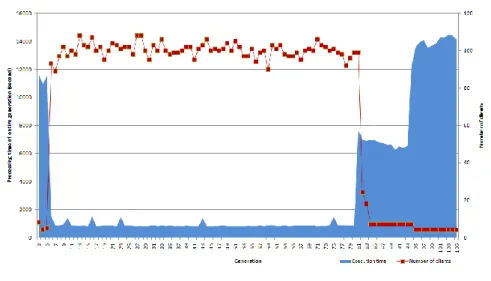
5.3. Examination of the Processing Speed
Examination of processing speed is not one of the primary goals of our research (and we could access the required resources for a limited amount of time only, so our aim was to get the best possible performance and not to measure the different performance levels). We performed no separate speed tests, but by subsequently analyzing the log files of the clients we were able to draw some conclusions on this topic as well. During the regular operation of the system, various clients dynamically connected and disconnected, so in this way we could obtain data about how the number of clients affects the processing time required for one generation.
This is shown in Diagram 4, where the horizontal axis represents the generations, the blue area in the background represents the total processing time required for a generation, and the red dots represent the number of clients that took part in the processing of that generation.
Diagram 4
Execution time and number of clients by generations
It is clearly visible that by increasing the number of clients the required processing time immediately decreased, while during the last generations (as some clients were disconnected) the required time started to increase again. As the individual task units are almost totally independent from each other, and as the processing units are totally independent from each other, we would expect that by increasing the number of clients, the execution time required for a generation would linearly decrease.
This did not happen because we could technically use only 27 workstations, so the only way that we could use more than 100 clients was that the client program was executed in multiple instances; in this way we tried to utilize the full potential of those computers (the computers had quad-core CPUs, an thus according to this, we used 4 instances per workstation).
This slightly increased the processing performance, because the evaluation algorithm only utilizes a single CPU core, so by executing four instances, we did manage to better utilize the available resources during the evaluation phase. As for the cell nuclei detection algorithm this made no changes, because the region growing algorithm was already optimized for a multi-core environment (especially through the intensively used OpenCV function calls), so using multiple instances meant absolutely no benefits in this case.
The linear growth as such cannot be reached in itself for the single reason that the processing time required for the different task units can vary a lot, so there is always a few-minute-long hiatus when one of the clients is still working on the last task unit while all the others are already finished and thus are waiting for the start of the next generation (to execute the genetic operators, the complete results of every task units are required). For this reason, a further improvement could be to estimate the processing time required for the task units (based on the parameters), and in this way it could be possible to implement a more sophisticated scheduler.
Conclusions
As a result of our research, we managed to develop a data-parallel region growing algorithm that is equally as accurate as the sequential version, but its speed is two or three times faster than the original one. The algorithm was implemented on Nvidia Fermi GPU.
The next step was to set the values of the considerably high number of parameters that are required for both the old sequential and the new parallelized versions of the region growing algorithm. We have developed a genetic algorithm for this purpose and implement the framework being in compliance with the above. In addition to the basic classes, a component implementing a communication protocol (applying the already mentioned FTP transmission) has been developed.
As mentioned above, we ran the evaluation for 11 only tissue samples, instead of
control group. According to this, we executed the evaluation for all of these images: the average accuracy was 76.83% (using the old parameters) and now was 81.15% (using the parameters found by the genetic algorithm).
The genetic algorithm successfully determines a set of parameters that can be used to achieve 81.15% accuracy on the pre-existing reference slides. This, compared to the results with the previously known best set of parameters, means an improvement of 4.32%.
We have already developed a distributed framework for the execution of the genetic algorithm. The framework has lived up to our expectations, and the execution time of 440 generations was fully acceptable.
At present the server gives the tasks for the clients in batches; one batch actually means the complete examination of one chromosome (the running of region growing and the evaluation for the selected images and summary of the results).
However, it became clear in practice that further distribution of the batches would be practical (that is, in the case that the evaluation has to be done for several images, then it could be done by different clients); namely it is fairly frequent that several hundred clients are waiting for the next generation while one client is still working with the large-volume job assigned to it.
Due to technical reasons the clients and the server communicate through a FTP server in compliance with the rules of the FTP protocol. This solution was selected because we worked with rather limited instruments and this protocol allowed us simple and problem-free coordination of the remote devices behind different firewalls. However, it became evident in practice that in the case of larger loading (hundreds of clients at a time, concurrent access to the same files) the examined FTP server implementations proved to be bottlenecks, and therefore communication should be practically re-planned with a protocol especially developed for this purpose.
References
[1] K. Palágyi, J. K. Udupa, “Medical Image Registration Based on Fuzzy Objects”, Summer Workshop on Computational Modeling Imaging and Visualization in Biosciences, Sopron, 29-31 Aug. 1996
[2] A. Reményi, S. Szénási, I. Bándi, Z. Vámossy, G. Valcz, P. Bogdanov, Sz.
Sergyán, M. Kozlovszky, “Parallel Biomedical Image Processing with GPGPUs in Cancer Research”, 3rd IEEE International Symposium on Logistics and Industrial Informatics (LINDI), 2011, Budapest, 25-27 Aug.
2011, ISBN: 9781457718403, pp. 245-248
[3] S. Szenasi, Z. Vamossy, M. Kozlovszky, “GPGPU-based Data Parallel Region Growing Algorithm for Cell Nuclei Detection“, 2011 IEEE 12th International Symposium on Computational Intelligence and Informatics (CINTI), 21-22 Nov. 2011, pp. 493-499
[4] Pannon University, “Algoritmus- és forráskódleírás a 3DHistech Kft.
számára készített sejtmag-szegmentáló eljáráshoz”, 2009
[5] S. Szenasi, Z. Vamossy, M. Kozlovszky, "Preparing Initial Population of Genetic Algorithm for Region Growing Parameter Optimization", 4th IEEE International Symposium on Logistics and Industrial Informatics (LINDI), 2012, 5-7 Sept. 2012, pp. 47-54
[6] S. Szenasi, Z. Vamossy, M. Kozlovszky, “Evaluation and Comparison of Cell Nuclei Detection Algorithms“, IEEE 16th International Conference on Intelligent Engineering Systems (INES), 13-15 June 2012, pp. 469-475 [7] R. E. Precup, S. Preitl S, J. K. Tar, M. L. Tomescu, M. Takács, P. Korondi,
P. Baranyi, “Fuzzy Control System Performance Enhancement by Iterative Learning Control”, IEEE Transactions on Industrial Electronics, 2008, pp.
3461-3475
[8] R. Kohavi, F. Provost, “Glossary of Terms”, Machine Learning, Vol. 30, No. 2, Springer Netherlands, 1998, pp. 271-274., ISSN: 08856125
[9] M. T. Goodrich, R. Tamassia, “Algorithm Design: Foundations, Analysis, and Internet Examples Algorithm Design”, John Wiley & Sons Inc., 2002, ISBN: 0471383651
[10] M. Mitchell, “An Introduction to Genetic Algorithms”, Bradfork Book The MIT Press, Cambridge, 1999, ISBN: 0262133164
[11] D. Gupta, S. Ghafir, “An Overview of Methods Maintaining Diversity in Genetic Algorithms”, International Journal of Emerging Technology and Advanced Engineering, Vol. 2, No. 5, May 2012, ISSN: 22502459, pp. 56- 60
[12] R. Murphy, “A Generic Parallel Genetic Algorithm”, M.Sc. Thesis in High Performance Computing, University of Dublin, Department of Mathematics [13] E. Alba, M. Tomassini, “Parallelism and Evolutionary Algorithms”, IEEE Transactions on Evolutionary Computation, Vol. 6, No. 5, Oct. 2002, pp.
443-462
[14] E. Alba, J. M. Troya, “A Survey of Parallel Distributed Genetic Algorithms”, Complexity, Vol. 4, No. 4, John Wiley & Sons Inc., March/April 1999, pp. 31-52
[15] M. Nowostawski, R. Poli, “Parallel Genetic Algorithm Taxonomy”, Third International Conference Knowledge-based Intelligent Information Engineering Systems, Dec. 1999, pp. 88-92
[16] P. Adamidis, “Parallel Evolutionary Algorithms: A Review”, 4th Hellenic- European Conference on Computer Mathematics and its Applications, 1998