REPRESENTING THE FOREST MANAGEMENT DILEMMAS IN THE ECOLOGICAL FOOTPRINT INDICATOR
TABI,A.* –CSUTORA,M.
Corvinus University of Budapest, Dept. of Environmental Economics and Technology 1093 Budapest, Fővám tér 8., Hungary
*Corresponding author e-mail: andrea.tabi@uni-corvinus.hu
(Received 7th November 2011; accepted 20th December 2011)
Abstract. Over the last decade the ecological footprint (EF) methodology has become widely used for estimating the biocapacity and the impact of human consumption in terms of global hectares. Although it represents a very impressive method for calculating the EF and biocapacity of an area, problems can arise regarding the incorporation of ecological factors into the calculation process. In this study we point out some problematic issues with use of the current EF methodology from an ecological point of view, taking as our focus forest biocapacity in Hungary. The EF concept ignores the differences in productivity of different species and forest types and their associated ecological values as well. We argue that the ecological ‘quality’ of different kinds of forests and tree species should be reflected in EF calculations in order to obtain a more accurate estimation of biocapacity. The presence of invasive and non-local species may reduce biodiversity and crowd out native tree species. As a result we distinguish between three main forest types (natural, cultural and energy forests) and additionally suggest the introduction of an additional parameter which refers to the ‘naturalness’ of the specified forest types. Results show a 15%
increase in forest biocapacity when incorporating the naturalness factor.
Keywords: ecological footprint, biocapacity, forest footprint, yield factor
Introduction
The use of the Ecological Footprint (hereafter, EF) methodology that was introduced by Wackernagel and Rees (1996) has become more widespread in the literature as a defining measure of sustainability over the last decade. Ecological Footprint accounting has been designed to measure actual human demands for biological resources and the generation of wastes in terms of land area, which is then compared to the productive capacity of the land area in a given year (Kitzes et al., 2009). Despite the numerous advantages of the EF indicator, criticism has arisen concerning the evaluation methods on both the input and output sides (i.e. human demand on ecosystems and biocapacity).
The EF concept is basically a static measurement; it does not incorporate the long term impacts of different technologies or biodiversity or soil conservation measures.
The most problematic issue with the EF indicator is that it does not capture land degradation (van Kooten et al., 2000). The footprint cannot take into account the harmful effects caused by intensive agricultural practices on soil, and so using it for comparisons of biocapacity is liable to generate erroneous results. In summary, the EF does not distinguish between sustainable and unsustainable land use (Fiala, 2008; van Kooten and Bulte, 2000; Bergh and Verbruggen, 1999; Kitzes et al., 2009; Mozner et al., 2011), and by not doing so, it fails to be of use in the calculation of one of the most important factors for sustainability.
The EF indicator very strong correlates with GHG-emission calculations, not surprisingly, as carbon uptake accounts for 50% or more of the entire footprint
(Fiala, 2008; van Kooten et al., 2000). This indicates that EF largely accounts for CO2
emissions and does not include other crucial ecological factors.
In this paper we focus on the current use and methodology of the EF, which in turn creates a dilemma about sustainability in the case of forest footprint and biocapacity.
We argue that the forest biocapacity calculations ignore differences in the productivity of different species and forest types and their ecological values, too. Ecological values of different kinds of forests and tree species should be reflected in the EF calculation so as to obtain accurate estimates of the biocapacity of an area - which should also reflect carrying capacity which is influenced by different forest management practices. An assumption is made that the current EF method does not represent the actual ecological value of a forested land area, and thus is not an appropriate sustainability indicator for using in forest management.
Calculating forest biocapacity and forest footprint
According to the methodology specified by Kitzes et al. (2008) there are only three factors required to calculate national forest biocapacity: the given forest area in national hectares, the yield factor and an equivalence factor for forests:
Biocapacity (gha) = Area (nha) * YF (wha/nha) * EQF (gha/wha) (Eq.1) Biocapacity, as well as forest footprint, is accounted for in global hectares (gha) which are a hypothetical measure used to facilitate comparison of the environmental deficit/surplus of different nations. The yield factor (YF) and equivalence factor (EQF) are the most crucial points in the calculation methodology. The yield factor expresses the relative productivity of national hectares (nha) compared to world average hectares (wha). This proportion is calculated every year for each land type. Forest yield factor identifies the roundwood equivalent produced.
The equivalence factor measures the relative productivity of world average hectares of different land types, which as a constant variable does not change over time and is the same for all countries. The equivalence factor is the ratio of the average suitability index for a given land type divided by the average suitability index for all land types.
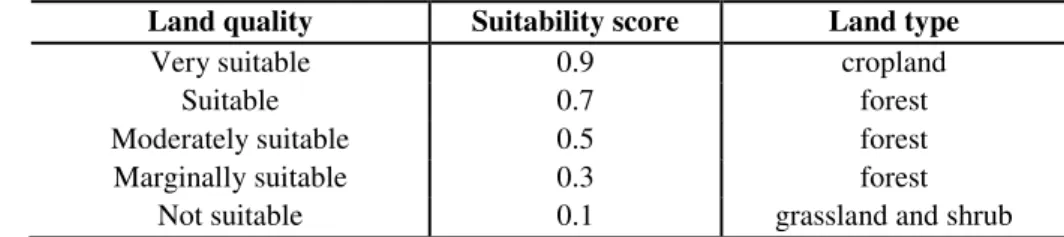
For the concrete measurement of different land types, suitability indexes are derived from data from Global Agro-Ecological Zones combined with the information available at FAOSTAT. Five categories are used to evaluate the quality of cropland, forest and grasslands (Table 1).
Table 1. Land ranking by suitability (source: Kitzes et al., 2008)
Land quality Suitability score Land type
Very suitable 0.9 cropland
Suitable 0.7 forest
Moderately suitable 0.5 forest
Marginally suitable 0.3 forest
Not suitable 0.1 grassland and shrub
Behind the idea of EQF a very clear assumption is made; namely that the most productive land must be used in the most productive way. In this context the most
‘productive use’ is agricultural. Forests may only be ranked as being either ‘suitable’ or
‘marginally suitable’ land areas, according to the specifications.
The forest footprint explained by the Global Footprint Network (GFN) guidelines (Kitzes et al., 2008) embraces the human usage of different wood products as raw materials for primary products, which include fuels and also secondary timber products.
The final forest footprint area indicator is supposed to represent the world average forest land area needed to meet demand for wood.
To calculate the forest footprint the annual amount of harvested wood is compared with the net annual growth rate of the world’s forests and is then multiplied by the equivalence factor, as shown below:
(Eq.2) Where:
EF Ecological Footprint associated with product or waste (gha) P amount of product extracted or waste generated (t/yr) EQF equivalence factor for given land type (gha/wha)
YW world-average yield for product extraction or waste absorption (t/wha/yr).
The GFN calculation (Kitzes et al., 2008) of global and country specific forest yields (i.e. net annual increments) rely on data from the FAO Temperate and Boreal Forest Resource Assessment, FAO’s Global Fibre Supply Model, and on IPCC accounting methodology.
Issues with the calculation method
Although at first glance EF methodology delivers a very impressive tool for calculating the ecological production load of in terms of physical indicators (using an obvious and comparable unit suitable for use even in decision-making processes), some problematic issues arise concerning calculated biocapacity.
Estimating the ecological footprint basically means collecting data on production, import and exports of roundwood or its equivalent. Assessing biocapacity at the national level is more challenging because the impact of biocapacity on humans and entire ecological networks has not been defined. The indirect impacts of ecosystems on our lives are not taken into account, and by ignoring them a lot of additional benefits may go uncounted. Apart from this caveat, there are some problematic methodological concerns with the current method of calculating biocapacity:
1. The EQF suggests that the conversion of forest area into agricultural land would be more favourable because it would increase biocapacity in the calculation
2. The calculation method using the yield factor favours fast-growing invasive species which can outcompete slower growing native tree species
3. EQF does not take into account the ecological value of a forest area
4. The yield factor does not reflect yields derivable from different forest types (e.g. energy forest versus natural forests).
Issue 1
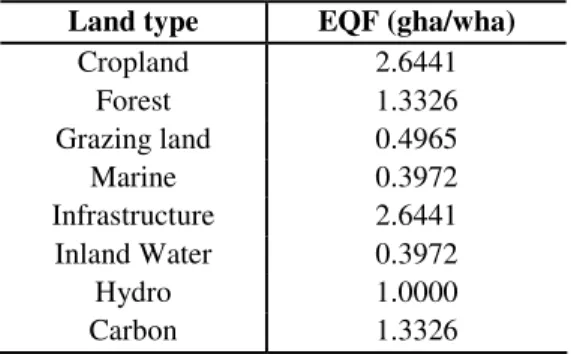
The equivalence factors used in the calculations of EF for Hungary are shown in Table 2. It can be observed that the biocapacity of cropland is twice as high as for forest land, which suggests that if all forest areas were converted into cropland biocapacity
would be two times as high. This outcome is a logical extension of the initial assumption; namely that the ‘most suitable’ land areas should be used to produce food.
Table 2. Equivalence factors for different land types (source: Kitzes et al., 2008)
Land type EQF (gha/wha)
Cropland 2.6441
Forest 1.3326
Grazing land 0.4965
Marine 0.3972
Infrastructure 2.6441
Inland Water 0.3972
Hydro 1.0000
Carbon 1.3326
Issue 2
The yield factor compares the national yield to the average world yield of roundwood, which practically implies that tree species with a short growing period are preferable for their use in industry. This technical implication also suggests that the presence of invasive species has a favourable effect on biocapacity. According to calculations the logging of alien species increases biocapacity more than natural native species. Several studies have shown that invasive species have a negative impact on native ecosystems by decreasing biodiversity and changing soil nutrient cycling processes (Koutika, 2011).
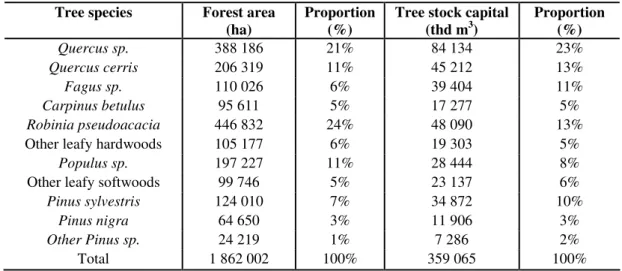
The main native tree species in Hungary such as oaks (Quercus petraea, Quercus robur, Quercus pubescens), beech (Fagus sylvatica), elm (Ulmus sp.), maple (Acer sp.), ash (Fraxinus sp.), and hornbeam (Carpinus betulus) have been already outcompeted by alien species such as Prunus serotina, Robinia pseudacacia, Ailanthus altissima, Impatiens glandulifera, Asclepias syriaca, Ambrosia artemisiifolia, Fallopia×bohemica, F. japonica, F. sachalinensis, etc. In Hungary, approximately the one fourth of woodland area is now composed of non-native Robinia pseudoacacia, which has become one of the most critical ecological problems. This North American species was introduced into Hungary as a planted tree for use in hedgerows, shelter belts, etc. in the first half of the 18th century. After a while it became widespread in lowland sandy and loess soil regions exposed to wind and rain erosion. Unfortunately, the areas occupied by Robinia have continuously increased, and nowadays Robinia takes the largest share of woodland area in Hungary (Table 3), thus the black locust is also the most widespread tree species in Hungary (Balogh, 2008).
In most cases Robinia occupies ‘suitable’ land as well, crowding out native tree species. Reversion of these areas to a pre-Robinia state is difficult due to financial constraints. Species like Robinia essentially change the characteristic features of the conquered community or landscape through changing the structure of the soil. For instance, Robinia and Ailanthus have nitrogen-fixing bacteria on their root systems thus they can easily grow on poor soils and spread quite quickly, thereby increasing the rate at which other nitrogen loving plants (mainly weeds) can grown as well.
Table 3. The spread of different tree species in Hungary (source: KSH, 2011)
Tree species Forest area (ha)
Proportion (%)
Tree stock capital (thd m3)
Proportion (%)
Quercus sp. 388 186 21% 84 134 23%
Quercus cerris 206 319 11% 45 212 13%
Fagus sp. 110 026 6% 39 404 11%
Carpinus betulus 95 611 5% 17 277 5%
Robinia pseudoacacia 446 832 24% 48 090 13%
Other leafy hardwoods 105 177 6% 19 303 5%
Populus sp. 197 227 11% 28 444 8%
Other leafy softwoods 99 746 5% 23 137 6%
Pinus sylvestris 124 010 7% 34 872 10%
Pinus nigra 64 650 3% 11 906 3%
Other Pinus sp. 24 219 1% 7 286 2%
Total 1 862 002 100% 359 065 100%
Issue 3
The value of protected forests is not represented in calculations because they are not used for roundwood production. In Hungary in 2010 about 20% of forest land was under protection (KSH, 2011). These forests are not used for roundwood production; in other words, these areas are ignored in EF and biocapacity calculations. Nevertheless they are very valuable from an ecological perspective (as biodiversity refugia).
Biodiversity is also not included in any part of the footprint or biocapacity calculations which is another failure of the EF concept. According to a recent mapping of natural habitats in Hungary conducted by the Hungarian Academy of Sciences, the NCI (Natural Capital Index) of the country (which indicates the land area covered by natural or semi-natural vegetation) amounts to 17%. The remaining 83% land area is covered by agricultural fields, forestry plantations and settlements (Czúcz et al., 2008).
Issue 4
As a result of the intensive afforestation efforts of the last 50 years in Hungary, newly introduced species such as the black locust, scots pine, and improved poplars were widely planted and forest area increased by 50% (Szepesi, 1998). For this reason, one should distinguish between native and alien forest types because from an ecological perspective as well as from an industrial (wood as raw material) perspective they do not provide equivalent yields. As yields in fact change for different forest types, in order to improve the current EF calculation method we consider 3 forest types:
• naturally developed mixed-age forests, with mostly native tree species
• culture forests, with mostly non-native or site-foreign tree species
• forest plantations or energy forests, planted to produce fuel (biomass).
Not ecological, but rather forest management considerations are reflected in this grouping of forest types which clearly differ from each other. The average yield of an energy plant depends on several factors (such as cutting age and the density of plantation) but average annual yields are 3-4 as much as for naturally developed, mixed- age forests where average annual yields are between 3-4 t/ha. Culture forests consist of mainly invasive or site-foreign tree species. They are often dominated by one tree species which is contemporaneous, tree stock capital which has outcompeted the native
tree species. The original flora is entirely or substantially altered; often the habitat has changes over the long term (Ódor, 2011).
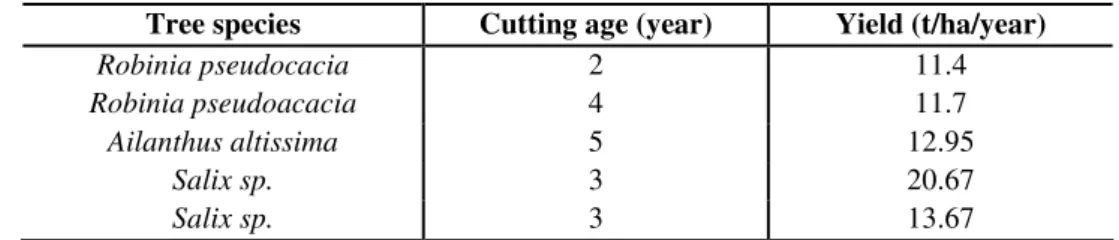
Forest plantations are grown primarily for roundwood production. Energy forests are also special targeted short rotation forests which are grown mainly for biomass production (Table 4). Traditional forest management cannot deliver an equivalently high energy yield (15-20 GJ/ha/year). Energy forests are planted with a higher density of trees (8-15 thousand trees/ha) which are cut at 3-4 years of age. The lifetime of such an energy forest is about 20 years, with a total energy yield of 150-250 GJ/ha/year (Marosvölgyi, 2004). Energy forests are mostly planted on floodplains or non-usable agricultural areas.
Table 4. Typical yields of short rotation energy forests in Hungary (source: Bai et al., 2006)
Tree species Cutting age (year) Yield (t/ha/year)
Robinia pseudocacia 2 11.4
Robinia pseudoacacia 4 11.7
Ailanthus altissima 5 12.95
Salix sp. 3 20.67
Salix sp. 3 13.67
In Hungary, natural forests usually contain 5-15 main tree species of which the most important and widespread are the Quercus and Fagus species. In the wood industry beeches and oaks provide the most suitable hardwood materials. The age of cutting of beech and oaks under natural circumstances would be 80-150 years, depending on the trees state of health and habitat.
Recommendation
The average afforestation level at the European Union level is about 40%; in Hungary it is 22%, falling in at 22nd place among EU countries in 2010 (Eurostat, 2011). As mentioned in the previous chapter, one should remember that this does not imply that the proportion of afforested area is equivalent to the ecologically valuable land area, or in other words, to the quality of forest area.
In Hungary the ‘naturalness’ of forests, according to a survey conducted in 2005, is estimated at being 57.6% of all woodlands. Naturalness of forests is defined using two main features:
• the degree of nativity,
• the site-nativity of tree species.
The proportion of site-foreign, but native forests in Hungary is 51% and alien forests 38.7% of total forest area (Bartha et al., 2005). In order to calculate the actual national yield we have to take into consideration the difference between forest types in roundwood yield and their ecological value. Almost half of all wooded areas are under private ownership, the proportion of state-owned forests is 55.6% and only 40% of them are under protection (KSH, 2010). In our domestic forests approximately 13 million m3 of roundwood per year is produced (through natural renewal) and about 10 million m3 (about 7.5 million tones) can be produced in a sustainable way. In the last decade logging accounted for 7 million m3 per year (about 5.3 million tones) (Magyar Agrárkamara, 2011). The sustainable rate of logging should not exceed 4.027 t/ha. The
actual logging rate for Hungary (for all tree types) was only about 2.84 t/ha over the last decade, which is regarded as being considerably less than the sustainable forest management limit. Table 5 shows the average roundwood yield by tree type produced in all naturally or semi-naturally developed forest area, divided by forest land area.
Table 5. Roundwood yields(t/ha) by tree type (source: KSH, 2011)
Tree species 2004 2005 2006 2007 2008 2009 2010
Quercus sp. 2.157 2.238 2.146 1.973 2.097 1.883 1.958 Quercus cerris 3.519 3.375 3.289 2.834 3.155 3.153 3.143
Fagus sp. 4.643 4.526 4.099 4.095 4.322 4.618 5.661
Carpinus betulus 2.536 2.568 2.494 2.251 2.325 2.348 1.984 Robinia pseudoacacia 2.850 2.662 2.513 2.149 2.511 2.570 2.805 Other leafy hardwoods 1.564 1.556 1.612 1.376 1.388 1.397 1.422 Populus sp. 2.906 2.853 2.600 2.397 2.385 2.217 2.249 Other leafy softwoods 1.200 1.105 1.164 1.113 1.099 1.091 1.052
Pinus sp. 1.702 1.534 1.607 1.631 1.748 2.191 2.214
Since the naturally and semi-naturally developed, mixed-age forests mostly contain oaks, beech, hornbeam and some other alien species, we consider the yield of natural forest to be about 4 t/ha per annum, which is also the limit of sustainable forest management in Hungary.
For forest plantations and energy forests the annual yield cannot be unambiguously defined because it depends on the age of cutting of the tree and other external factors as well. Thus we calculate using the average amount of roundwood produced, which is approximately 12 t/ha per annum.
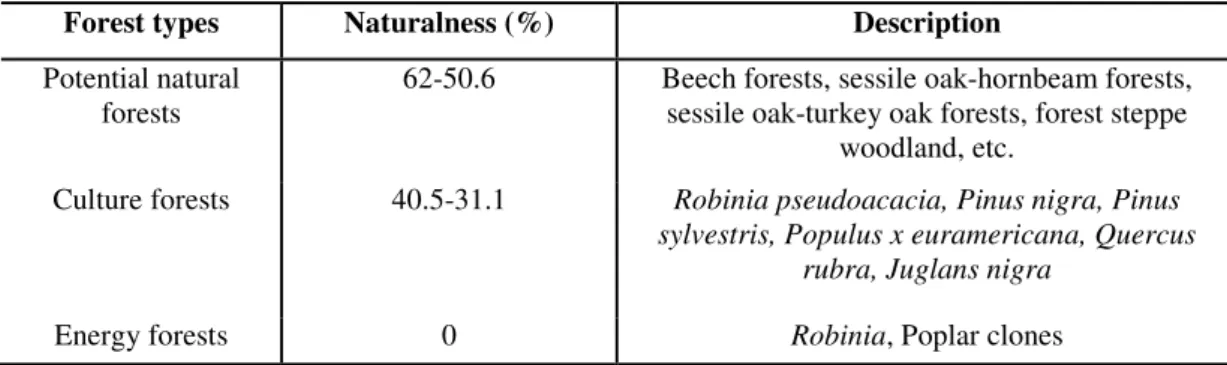
Table 6 shows the naturalness of forest land by the six main geographical regions of Hungary.
Table 6. Naturalness of forests by forest type (source: Bartha et al., 2005)
Forest types Naturalness (%) Description
Potential natural
forests 62-50.6 Beech forests, sessile oak-hornbeam forests, sessile oak-turkey oak forests, forest steppe
woodland, etc.
Culture forests 40.5-31.1 Robinia pseudoacacia, Pinus nigra, Pinus sylvestris, Populus x euramericana, Quercus
rubra, Juglans nigra
Energy forests 0 Robinia, Poplar clones
These data are based on the results of forest mapping conducted in Hungary in 2005.
The degree of naturalness refers to the content of tree species and their nativity and site- nativity as well. In our calculations we used the average value of each forest type and introduced a naturalness factor in order to reflect the quality of forests from an ecological point of view. We set the range of naturalness at between 1 and 2, where the highest value of naturalness would effectively double the amount of biocapacity. The value is 1 when the forest makes no real ecological contribution to habitat (so a designation of ‘1’ does not change the final outcome).
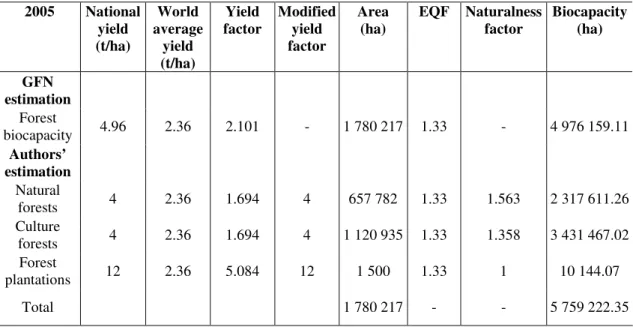
Table 7 shows two estimations of forest biocapacity; the first was carried out by GFN and the second one is the authors’ estimation using a modified yield factor and naturalness factor by forest type.
Table 7. Estimation of biocapacity for Hungary, 2005 (source: Kitzes et al., 2008; Bartha et al., 2005)
2005 National yield (t/ha)
World average
yield (t/ha)
Yield factor
Modified yield factor
Area (ha)
EQF Naturalness factor
Biocapacity (ha)
GFN estimation
Forest
biocapacity 4.96 2.36 2.101 - 1 780 217 1.33 - 4 976 159.11 Authors’
estimation Natural
forests 4 2.36 1.694 4 657 782 1.33 1.563 2 317 611.26
Culture
forests 4 2.36 1.694 4 1 120 935 1.33 1.358 3 431 467.02 Forest
plantations 12 2.36 5.084 12 1 500 1.33 1 10 144.07
Total 1 780 217 - - 5 759 222.35
So far, only about 1500 hectares of land have been occupied by energy forests, but according to calculations 100 000 hectares area could be used for producing fuel.
Introducing the new factors has increased forest biocapacity by 15% in Hungary.
Summary
The EF concept and calculation procedure are open to criticism and it can be concluded that the EF should not be used as a comprehensive sustainability indicator, especially from an ecological point of view. The current method fails to capture a number of important sustainability issues, mostly because it captures natural resources in a static snapshot and does not pay attention to the dynamics of natural processes.
Ecological aspects are not reflected in calculations of biocapacity at all. If we aggregate roundwood production and divide this by the entire wooded area, both the source of the roundwood and also the ecological values of the separate elements of the forest are lost, and by doing so, the measurement of sustainability fails.
In this piece of research the introduction of a new factor is suggested as an additional parameter required capturing the ecological values of different forest types. We consider that the naturalness of forests should be incorporated into EF calculations so that one of the most important ecological factors is incorporated in the calculation. However, further research needs to be done on other important factors (e.g. quality of forest soils) which influence the ecological quality of forests in order to obtain a more sophisticated – and accurate – estimation of forest biocapacity.
Acknowledgements. The research described herein was financed by TÁMOP-4.2.1/B-09/1/KMR-2010- 0005 project.
REFERENCES
[1] Bai, A., Ivelics, R., Marosvölgyi, B. (2006): A rövid vágásfordulójú nemesnyárból előállított apríték gazdasági vonatkozásai – In: Az alternatív energiaforrások hasznosításának gazdasági kérdései. Sopron, Nyugat-magyarországi Egyetem Közgazdaságtudományi Kar
[2] Balogh, L., Dancza, I., Király, G. (2008): Preliminary report on the grid-based mapping of invasive plants in Hungary – In: Rabitsch, W., Essl, F., Klingenstein, F. (Eds.) Biological Invasions – from Ecology to Conservation. NEOBIOTA 7 (2007): 105-114.
[3] Bartha, D., Bodonczi, L., Szmorad, F., Aszalós, R., Bölöni, J., Kenderes, K., Ódor, P., Standovár, T., Tímár, G. (2005): A magyarországi erdők természetességének vizsgálata II. (downloaded at: http://ramet.elte.hu/~ramet/project/termerd/2EL2005%20Bartha.pdf) [4] Czúcz, B., Molnár, Zs. , Horváth F., Botta-Dukát, Z. (2008) The Natural Capital Index of
Hungary – Acta Botanica Hungarica 50(Suppl.): 161-177.
[5] EUROSTAT (2011): Statistical database
http://appsso.eurostat.ec.europa.eu/nui/show.do?dataset=lan_lcv_woo&lang=en)
[6] Fiala, N. (2008): Measuring sustainability: Why the ecological footprint is bad economics and bad environmental science – Ecological Economics 67: 519-525.
[7] Kitzes, J., Galli, A., Rizk, S.M., Reed, A., Wackernagel, M. (2008): Guidebook to the National Footprint Accounts. – Oakland: Global Footprint Network.
[8] Kitzes et al. (2009): A research agenda for improving national Ecological Footprint accounts. – Ecological Economics 68: 1991-2007.
[9] Koutika, L-S., Rainey, H.J., Dassonville, N. (2011): Impacts of Solidago gigantea, Prunus serotina, Heracleum mantegazzianum and Fallopia japonica invasions on ecosystems – Applied Ecology and Environmental Research 9(1): 73-83.
[10] KSH (2010): Statisztikai Tükör – Erdők Magyarországon IV. évfolyam 75. szám [11] KSH (2011): Statistical database (downloaded at:
http://portal.ksh.hu/pls/ksh/docs/hun/xstadat/xstadat_eves/i_ome002b.html) [12] Magyar Agrárkamara (2011): (downloaded at:
http://www.agrarkamara.hu/%C3%81gazatiinform%C3%A1ci%C3%B3k/Erd%C5%91va d%C3%A9shalgazdas%C3%A1g/Erd%C5%91gazd%C3%A1lkod%C3%A1s.aspx) [13] Marosvölgyi, B. (2004): Magyarország biomassza-energetikai potenciálja. –
Energiagazdálkodás 45(6): 16–19.
[14] Mózner, Z., Tabi, A., Csutora, M. (2011): Modifying the yield factor based on more efficient use of fertilizer - The environmental impacts of intensive and extensive agricultural practices – Ecological Indicators, doi:10.1016/j.ecolind.2011.06.034
[15] Ódor, P. (2011): Kulturterületek
(downloaded at: http://ramet.elte.hu/~ramet/staff/Op/vegetacio/kulturteruletek.pdf) [16] Szepesi, A. (1998): Forest Health Status in Hungary. – USDA Forest Service Gen. Tech.
Rep. PSW-GTR-166.
[17] Van den Bergh, J.C.J.M., Verbruggen, H. (1999): Spatial sustainability, trade and indicators: an evaluation of the ecological footprint. – Ecological Economics 29: 61-72.
[18] van Kooten, G. Cornelis, Bulte, Erwin H. (2000): The ecological footprint: useful science or politics? – Ecol. Econ. 32: 385-389.
[19] Wackernagel, M., Rees, W. (1996): Our Ecological Footprint: Reducing Human Impact on the Earth. – New Society Publishers, Gabriola Island.