Máté Fain1
A vállalati társadalmi teljesítmény rövid távú hatásai a pénzügyi jövedelmezőségre The Short-term Effects of Corporate Social Performance on Financial Profitability
A menedzsment elméletek szerint az erős vállalati társadalmi teljesítmény (CSP) javítja a pénzügyi jövedelmezőséget. Továbbá, a felelősen viselkedő vállalkozások hozzájárulhat- nak a gazdaságok fenntartható növekedéséhez, amely az ENSZ fenntartható fejlődésre vonatkozó, 2030-ig terjedő keretrendszerének is prioritása (Agenda 2030). Bár a CSP kife- jezést alkalmazzuk, más szorosan kapcsolódó tényezőkre is hivatkozunk, így a vállalkozá- sok környezetvédelmi és vállalatirányirányítási politikáira; éppen ezért a tanulmányban mindvégig az ESG-koncepciót (környezeti, társadalmi és vállalatirányítási faktorok) fog- juk használni. Megvizsgáljuk, hogy valóban létezik-e a szakirodalomban domináns pozitív kapcsolat a vállalkozások ESG és pénzügyi teljesítménye között. Az elemzéshez az MSCI ACWI Indexből származó 1.099 elemű vállalati mintát használunk, amely 2018-ra terjed ki. A regressziós számítások a súlyozott legkevesebb négyzetek (WLS) módszerén alapul- nak. A függő változó az árbevétel-arányos adózott eredmény (ROS, 2018); a kontrollválto- zók az előző évi (2017) jövedelmezőség, méret, tőkeáttétel, növekedés, tőkeintenzitás, ipar- ági és regionális dummy változók. Az eredményeink azt mutatják, hogy a magasabb ESG, E és S teljesítmény rövid távon nem módosítják jelentősen a pénzügyi jövedelmezőséget. A vállalatirányításnak azonban jelentős és pozitív hatása van 5,00 százalékos szignifikancia szint mellett: a G-pontszám 10-pontos növekedése 0,30 százalékponttal növeli a ROS-t.
Egy másik ugyancsak fontos következtetés: a társadalmi és környezeti tényezők, amelyeket gyakran színtiszta költségekként értelmeznek, nem csökkentik jelentősen a rövid távú jöve- delmezőséget. Ez utóbbi megállapítás azt sugallja, hogy a vállalatoknak érdemes ESG-tu- datos projektekbe fektetniük, hiszen nem járnak profitcsökkenéssel, de hozzájárulhatnak az Egyesült Nemzetek Szervezete Fenntartható Fejlődési Céljainak (SDG) az eléréséhez.
Management theories emphasise that strong corporate social performance (CSP) enhances financial profitability. Further, responsible firms have the potential to promote sustainable growth which is the priority of the United Nations’ 2030 Agenda for Sustainable Develop- ment. Although we apply the term CSP, we also refer to other closely linked factors such as environmental and governance policies. For this reason, we use the ESG concept (en- vironmental, social and governance) throughout the study and test whether the dominant hypothesis of positive ESG-financial performance relationship exists. The analysis covers
1 PhD candidate, Corvinus University of Budapest, Department of Finance DOI: 10.14267/RETP2020.02.20
2018 company-level data and performed on a 1,099-element firm sample from the MSCI ACWI Index. Regression calculations rest on the weighted least squares (WLS) method.
The dependent variable is the return on sales (ROS, 2018); the control variables are pre- vious year (2017) profitability, size, leverage, growth, capital intensity, industry and regi- onal dummies. The empirical results show that higher ESG, E, and S ratings do not change profitability significantly in the short run. However, corporate governance has a significant and positive effect at 5.00 per cent: a 10-point increase in G score increases ROS by 0.30 percentage points. Another important conclusion is that social and environmental factors, which often interpreted as mere costs, do not significantly reduce short-term profitability.
This latter finding implies that companies should invest in ESG projects as they will not experience evaporating profits but might contribute to achieving some of the Sustainable Development Goals of the United Nations.
Introduction
According to global advisory firms [Collins and Allen, 2020: 17; Henisz et al., 2019], valuation professionals are becoming more ESG-conscious, as 75 per cent consider somehow environmen- tal, social and governance factors while evaluating corporates. Statistical figures on sustainable investing also underpin the importance of ESG. GSIA [2018] report shows that the total assets under management (AUM) based on sustainable investing strategies more than doubled by 2018 compared to 2012, reaching $30,000 billion, which roughly equals to 33 per cent of the global AUM (this figure was 21 per cent in 2012).
Policymakers are also keen on ESG issues, since solving global environmental, social, and governance challenges contribute to achieve and maintain sustainable economies and societies.
One of the prominent sustainability programmes is the United Nations’ (UN) ‘Transforming our world: the 2030 Agenda for Sustainable Development’. In this agenda, the UN defines 17 Sustainable Development Goals (SDGs). Here are some that are closely related to corporate ESG performance [United Nations, 2015: 14]: guarantee gender equality (SDG5); promote sustained, inclusive and sustainable economic growth, full and productive employment and decent work for all (SDG8); ensure sustainable consumption and production patterns (SDG12), take urgent action to combat climate change and its impacts (SDG13).
However, the concept of ESG is not entirely new since many scholars have analysed it thor- oughly but under different names (ethical, socially responsible, sustainable or responsible invest- ing) and focusing on only one of its elements. Comprehensive literature review articles such as Friede et al. [2015], Griffin and Mahon [1997], Margolis and Walsh [2003], Orlitzky et al. [2003], Renneboog et al. [2008]; Revelli and Viviani [2013]summarised the key hypotheses and findings.
There are three competing hypotheses on the direction of the relationship (positive, nega- tive or no effect) and the type of causality (ESG performance affects profitability or vice versa, or synergetic, interdependent as a third type of dependence). Stakeholder theory [Clarkson, 1995; Freeman, 2010; Hillman and Keim, 2001; Mitchell et al., 1997], good management the- ory [Waddock and Graves, 1998] as wells as the resource-based view of firms [Barney, 1991;
Hart, 1995; Hart and Dowell, 2011; Wernerfelt, 1984 as wells as the resource-based view of firms [Barney, 1991; Hart, 1995; Hart and Dowell, 2011; Wernerfelt, 1984] maintain that the satisfac-
tion of primary stakeholders (for instance, customers, employees, local communities, sharehold- ers) is essential in realising superior financial performance.
Slack resources theory [Günther et al., 2012; Orlitzky et al., 2003; Preston and O’Bannon, 1997; Ullmann, 1985; Waddock and Graves, 1998] also emphasises a positive relationship between corporate ESG and financial performance; however, it assumes reverse causation, that is, financial profitability determines ESG performance. Previous outstanding financial perfor- mance provides excess cash (as a slack resource) necessary to become a responsible company.
The next hypothesis assumes a negative relationship meaning that higher ESG scores depress financial performance. This is the underlying theory of the trade-off hypothesis and the man- agement opportunism hypothesis. The trade-off hypothesis [Aupperle et al., 1985; Dam, 2008;
Friedman, 1970; Preston and O’Bannon, 1997; Vance, 1975] claims that reaching and maintain- ing higher ESG performance is costly, as resource reallocation to responsible activities such as community development or charity is not profitable but, on the contrary, generates higher oper- ating expenditures due to internalisation of externalities.
Managerial opportunism hypothesis [Günther et al., 2012; Makni et al., 2009; Preston and O’Bannon, 1997 rests on the assumption that corporate managers usually chase their private interests and do not care much about stakeholders. In periods when financial performance is robust, managers tend to cut off social expenses to take full advantage of their short-term private interest. However, when financial performance decays, managers might engage in noteworthy but not necessarily profitable social programs to offset their underperformance. The opportun- ism hypothesis, like the slack resource theory, emphasises reverse causation.
The ‘no effect’ principle of McWilliams and Siegel [2001, 2000] claims that incorporating R&D factors in the analysis of the ESG versus financial performance relationship eradicates any significant relationship and results in neutrality. In their 2001 paper, the authors outline a supply and demand model of corporate social responsibility and hypothesise that firm-level ESG per- formance depends on several factors such as size, level of diversification, research and develop- ment, advertising. The conclusion, yet again, is that there is no significant relationship between ESG and financial performance. However, they admit that the hypotheses are difficult to test empirically due to the lack of data. Some other empirical studies also found a neutral relation- ship [for instance, Bebchuk et al., 2013; Garcia-Castro et al., 2010; Johnson et al., 2009; Menz, 2010] The size factor was shown to be a market pricing anomaly in Naffa [2009].
Another critical issue is how to measure financial performance. Günther et al. [2012] or Peloza [2009]summarises the most commonly used metrics. They classify financial performance indicators into three groups: accounting ratios (including ROS, ROE, ROIC), measures that use both stock exchange and accounting data (e.g. P/E, EV/EBITDA), and metrics calculated from stock exchange data (e.g. Jensen’s alpha, Sharpe ratio). Studies that analysed stock returns are, for instance, Bebchuk et al. [2009] Eccles et al. [2014], Edmans [2012], Kovács et al. [2011] In the empirical section, we analyse the net profit margin (ROS). Several studies used ROS as the dependent variable, see, for instance, Callan and Thomas [2009], Griffin and Mahon [1997], Hart and Ahuja [1996], Qiu et al. [2016], Waddock and Graves [1998], Wagner [2005].
We test the hypothesis that companies with high ESG performance retain significantly higher financial profitability than companies with low ESG ratings. Our hypothesis is in line with stake- holder theory, good management theory and the resource-based view of firms. We first analyse company ESG performance separately (E, S and G), then together (ESG score). The reference period covers 2018, i.e. the focus is on the short-term profitability effect of ESG factors.
The remainder of the paper is organised as follows. In the second section, we present the brief conceptual framework of ESG investing. The next section introduces the database compiled and built for the empirical analysis. Subsequently, we describe the applied methodology. Finally, we present our empirical findings. The paper ends with a conclusion.
Conceptual framework
The conceptual framework underlying this paper originates from the theory of corporate valua- tion. ‘Value’, interpreted either at the firm or equity level, is most often measured by the present value of expected future cash flows:
(1)
where Cash flowt is the expected cash flow in period t and rt is the required rate of return (cost of capital) reflecting the riskiness of the business. There is a growing perpetuity version of the above formula:
(2)
where g measures the long-term sustainable growth rate of profits. Based on Equation (2), expe- cted future cash flows, riskiness, and growth determine valuation. The following formula is a version of the Residual Income (RI) model (for more information on RI see, for instance, Juhász [2018] or Ehrbar [1998]):
(3)
where E0 is the present value of equity, St-1 is the net sales in period t-1, gt is the expected growth rate of net sales in period t, ROSt is the net profit margin during t, BV(Et-1) is the book value of equity at the beginning of t, rEt is the required rate of return on equity. According to Equation (3), if a firm increases its profitability (profit margin, ROS), it will also increase shareholder value, ceteris paribus.
Several factors may affect profitability, and one could be ESG-related issues. As an example, businesses that do not pay attention to the environment may face high environmental fines, lousy behaviour towards customers and local communities may lead to a drop in demand, and poorly managed businesses may find it challenging to adapt to the market contest. These nega- tive phenomena (but also the positive ones) have an impact on future cash flows and their stabil- ity; therefore, they affect profitability and share prices.
To sum up, referring to Porter – van der Linde [1995: 106] or Szabó – Juhász [2019a, 2019b]
increasing corporate resource productivity through environmental cost leadership ‘lowers true economic costs and raises the true economic value of products’. Consequently, strong ESG per- formance should have a positive effect on financial profitability. Based on the above, we define the following hypotheses:
H1: Firms with higher composite ESG scores achieve a significantly higher return on sales ratio (ROS) than those firms which possess low ESG scores.
𝑉𝑉𝑉𝑉𝑉𝑉𝑉𝑉𝑉𝑉� � ∑ ∏���� ������� ��
��
����
���� , (1)
where Cash flowt is the expected cash flow in period t and rt is the required rate of return (cost of capital) reflecting the riskiness of the business. There is a growing perpetuity version of the above formula:
𝑉𝑉𝑉𝑉𝑉𝑉𝑉𝑉𝑉𝑉� � ���� ������ �
���� , (2)
where g measures the long-term sustainable growth rate of profits. Based on Equation (2), expected future cash flows, riskiness, and growth determine valuation. The following formula is a version of the Residual Income (RI) model (for more information on RI see, for instance, Juhász [2018] or Ehrbar [1998]):
𝐸𝐸�� ∑ ����������∏� � ������ ��� ��������� ���
���
����
���� � �𝑉𝑉�𝐸𝐸��, (3)
H2: Companies with higher environmental (E), social (S), and corporate governance (G) scores have a significantly higher return on sales ratio (ROS) than companies with low E, S and G scores.
Database
To perform regression calculations, we collected a corporate sample from Bloomberg.
Observations include companies that were members of the MSCI ACWI Index in 2018. The constituents of the MSCI ACWI Index come from 23 developed and 26 emerging countries and have medium or large capitalisation. In December 2018, a total of 2,781 companies were in the index, and typically covered 85 per cent of the capital markets in the respective countries.
The Appendix summarises the variables involved in the analysis. Further, it also contains their calculation methods and Bloomberg codes. Several studies have applied the listed charac- teristics, see, for instance, Callan and Thomas [2009], Qiu et al. [2016], Russo and Fouts [1997], Wagner [2005]. The dependent variable is the return on sales (ROS) for 2018. Sustainalytics2 provides E, S, and G, as well as combined ESG scores to Bloomberg. The ratings range from 0 to 100, and higher values indicate better ESG performance.
Control variables include the 2017 return on sales, company size, leverage, capital intensity, growth, industry and geographic dummies. Assets, net sales, and market capitalisation describe the size factor (to have a linear relationship between the dependent and explanatory variables we calculate their natural logarithm). The following firm characteristics represent indebtedness:
book leverage, market-based leverage, and net debt to assets ratio. We measure growth also with three variables. These are as follows: the growth rate of assets, sales, and profit after tax between 2016 and 2018.
Our initial database included 2,781 companies; however, many did not disclose ESG scores, and several were not traded in 2017; hence they also lacked ROS for 2017. Consequently, we excluded every company that even had one missing data (listwise deletion)3. After the primary screening, 1,492 businesses remained in the database.
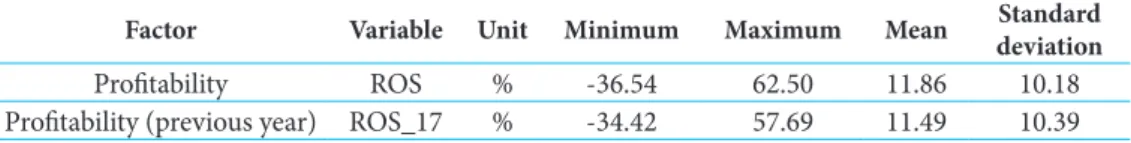
In the next step, we excluded firms that had extreme values for either the dependent or explanatory variables, given that the regression methodology is very sensitive to these [Kovács, 2014]. Extreme observations are those that are beyond three times the interquartile range (lower limit: Q1 - 3 x IQR; upper limit: Q3 + 3 x IQR). After the secondary screening, the sample con- sists of 1,100 companies. Table 1 summarises the descriptive statistics for each variable.
Table 1: Descriptive statistics
Factor Variable Unit Minimum Maximum Mean Standard
deviation
Profitability ROS % -36.54 62.50 11.86 10.18
Profitability (previous year) ROS_17 % -34.42 57.69 11.49 10.39
2 Sustainalytics is one of the leading global ESG rating agency founded in 1992.
3 An appropriate procedure for managing missing data could have been the so-called “Multiple Imputation (MI)” method, that we, however, discarded due to the large portion of missing ESG scores.
Firm size (SIZE) MCAP ln 7.10 13.55 9.55 1.04
ASSETS ln 6.45 13.86 9.70 1.21
SALES ln 5.35 13.12 9.18 1.20
Leverage (LEV) BLEV % 0.00 138.30 36.58 23.88
MLEV % 0.00 88.47 22.74 18.14
DA % 0.00 93.66 23.33 16.76
Capital intensity (CAP) CAP - 0.22 12.67 2.29 2.17
Growth rate (GRO) gASSETS % -16.38 30.07 5.98 6.66
gSALES % -18.16 29.66 6.02 6.05
gPAT % -57.71 75.13 8.79 20.29
ESG
ESG - 28.41 68.26 50.39 9.49
E - 28.84 67.75 50.40 9.45
S - 28.52 68.30 50.39 9.57
G - 29.29 67.94 50.30 9.77
Dummy factor Dummy variables Abbreviation Observations
№ distribution
Sectors (SEC)
Communication services CS 76 6.91%
Consumer discretionary CD 170 15.45%
Consumer staples CST 95 8.64%
Energy EN 48 4.36%
Financials FI 81 7.36%
Health care HC 97 8.82%
Industrials IN 215 19.55%
Information technology IT 113 10.27%
Materials MA 94 8.55%
Real estate RE 52 4.73%
Utility UT 59 5.36%
Regions (REG)
Americas A 465 42.27%
Europe, the Middle East
and Africa EMEA 291 26.45%
Asia-Pacific AP 344 31.27%
Influential
observations Minimum Maximum Mean Standard deviation № of observations
Cook’s distance 0.00 0.08 0.00 0.00 1 100
Leverage 0.01 0.12 0.02 0.01 1 100
Notes: The sector (SEC) classification rests on the MSCI Global Industry Classification Standard (GICS).
Source: Own compilation
The middle part of the table contains descriptive statistics about the dummy variables. More than 45 per cent of the companies operated in the consumer discretionary, IT and industrials sectors in 2018. In regional terms, the predominance of American companies (42.27 per cent) is apparent. The fewest companies are from the EMEA region (291).
According to Table 1, the relative standard deviations are typically less than two, and there are no influential observations in the sample (the highest Cook’s distance is very close to 0, and the maximum leverage is below 0.2), i.e. the database is suitable for further analysis.
Table 1 and the Appendix show that we treat firm size, leverage, and growth with more varia- bles, hence, we can interpret firm characteristics in a sophisticated way. However, one would face high multicollinearity in modelling if each variable enters in the analysis at once. It is necessary to combine these corporate variables somehow to avoid the confusing degree of multicollin- earity. An obvious solution would be to calculate simple averages, but this would ignore the correlations between the variables. For this reason, in the framework of principal component analysis (PCA), we combine the firm characteristics into common factors, namely size, leverage and growth.
Econometric Models and Estimation Methods
Raw ESG scores are only suitable for comparison within industries, which is a ‘unique’ feature of Sustainalytics’s database. Therefore, it is necessary to make some transformation. To this end, we follow the normalisation procedures of Morningstar tailored to Sustainalytics rating system [Justice and Hale, 2016]. First, we obtain ESG z-scores:
(4)
where ESGi is the Sustainalytics ESG score for firm i, μpeer is the peer group average ESG score, and σpeer is the standard deviation of the ESG scores for the same peer group.
Next, we recalculate standardised ESG scores by using Equation (5) to have scores between 0 and 100 again, but now individual company-level ESG scores are comparable across industries:
(5)
Equation (5) is the normalisation formula, with an average score of 50.
We estimate a linear regression model based on the following general equations (we calculate different equations owing to high multicollinearity between each ESG variable; see, for example, Qiu et al. [2016]).
𝑧𝑧𝑧𝑧𝑧𝑧𝑧𝑧�������������
���� , (4)
where ESGi is the Sustainalytics ESG score for firm i, μpeer is the peer group average ESG score, and σpeer is the standard deviation of the ESG scores for the same peer group.
Next, we recalculate standardised ESG scores by using Equation (5) to have scores between 0 and 100 again, but now individual company-level ESG scores are comparable across industries:
𝑁𝑁𝑁𝑁𝑁𝑁𝑁𝑁𝑧𝑧𝑧𝑧𝑧𝑧�� �� � �𝑧𝑧𝑧𝑧𝑧𝑧𝑧𝑧������� (5)
𝑅𝑅𝑅𝑅𝑅𝑅��� 𝛽𝛽�� 𝛽𝛽�𝑅𝑅𝑅𝑅𝑅𝑅����� 𝛽𝛽�𝑅𝑅𝑆𝑆𝑆𝑆𝑆𝑆��� 𝛽𝛽�𝐿𝐿𝑆𝑆𝐿𝐿��� 𝛽𝛽�𝐶𝐶𝐶𝐶𝐶𝐶��� 𝛽𝛽�𝐺𝐺𝑅𝑅𝑅𝑅��� 𝛽𝛽�𝑆𝑆𝑅𝑅𝐺𝐺��� ∑�� 𝛽𝛽�
��� 𝑅𝑅𝑆𝑆𝐶𝐶��� ∑� 𝛽𝛽�
��� 𝑅𝑅𝑆𝑆𝐺𝐺��� ��� (6)
𝑅𝑅𝑅𝑅𝑅𝑅��� 𝛽𝛽�� 𝛽𝛽�𝑅𝑅𝑅𝑅𝑅𝑅����� 𝛽𝛽�𝑅𝑅𝑆𝑆𝑆𝑆𝑆𝑆��� 𝛽𝛽�𝐿𝐿𝑆𝑆𝐿𝐿��� 𝛽𝛽�𝐶𝐶𝐶𝐶𝐶𝐶��� 𝛽𝛽�𝐺𝐺𝑅𝑅𝑅𝑅��� 𝛽𝛽�𝑆𝑆��� ∑�� 𝛽𝛽�
��� 𝑅𝑅𝑆𝑆𝐶𝐶���
∑����𝛽𝛽�𝑅𝑅𝑆𝑆𝐺𝐺��� ��� (7)
𝑅𝑅𝑅𝑅𝑅𝑅��� 𝛽𝛽�� 𝛽𝛽�𝑅𝑅𝑅𝑅𝑅𝑅����� 𝛽𝛽�𝑅𝑅𝑆𝑆𝑆𝑆𝑆𝑆��� 𝛽𝛽�𝐿𝐿𝑆𝑆𝐿𝐿��� 𝛽𝛽�𝐶𝐶𝐶𝐶𝐶𝐶��� 𝛽𝛽�𝐺𝐺𝑅𝑅𝑅𝑅��� 𝛽𝛽�𝑅𝑅��� ∑�� 𝛽𝛽�
��� 𝑅𝑅𝑆𝑆𝐶𝐶��� ∑� 𝛽𝛽�
��� 𝑅𝑅𝑆𝑆𝐺𝐺��� ��� (8)
𝑅𝑅𝑅𝑅𝑅𝑅��� 𝛽𝛽�� 𝛽𝛽�𝑅𝑅𝑅𝑅𝑅𝑅����� 𝛽𝛽�𝑅𝑅𝑆𝑆𝑆𝑆𝑆𝑆��� 𝛽𝛽�𝐿𝐿𝑆𝑆𝐿𝐿��� 𝛽𝛽�𝐶𝐶𝐶𝐶𝐶𝐶��� 𝛽𝛽�𝐺𝐺𝑅𝑅𝑅𝑅��� 𝛽𝛽�𝐺𝐺��� ∑�� 𝛽𝛽�
��� 𝑅𝑅𝑆𝑆𝐶𝐶��� ∑� 𝛽𝛽�
��� 𝑅𝑅𝑆𝑆𝐺𝐺��� ��� (9)
In the above regressions, the dependent variable is the 2018 return on sales ratio (ROS). Among the explanatory variables, the primary focus is on the E, S, G, and combined ESG scores.
Following prior literature, we control for firm size (see, for instance, [Brammer and Pavelin, 2008, 2006; Cormier and Magnan, 2003; Dhaliwal et al., 2011; Patten, 1991; Qiu et al., 2016]), leverage [Brammer and Pavelin, 2008, 2006; Cormier et al., 2011; Cormier and Magnan, 2003;
Qiu et al., 2016], capital intensity [Russo and Fouts, 1997; Schaltegger and Figge, 2000; Wagner, 2005], growth [Capon et al., 1990; Russo and Fouts, 1997], industry and country dummies [Patten, 1991; Qiu et al., 2016; Wagner, 2005].
In the literature, the ordinary least squares (OLS) method is one of the general approaches to estimate similar models (see, among other, [Qiu et al., 2016; Russo and Fouts, 1997; Wagner, 2005]). According to Wooldridge [2013], the conclusions of ordinary least squares could be con- sidered as the best linear unbiased estimates (BLUE) if the Gaussian-Markov (GM) standard assumptions are met. The GM assumptions: the variables are linear, exact multicollinearity does not exist, there is strict exogeneity, but no homoskedasticity and autocorrelation among the error terms (the latter is not relevant for cross-sectional data). The normality of the errors is not part of the GM model assumptions. If it is not satisfied, but a sufficiently large sample is analysed, the results obtained can be still valid as an asymptotic approximation due to the central limit theorem. The assumption of homoskedasticity does not hold; therefore, we apply the weighted least squares (WLS) method.
Results
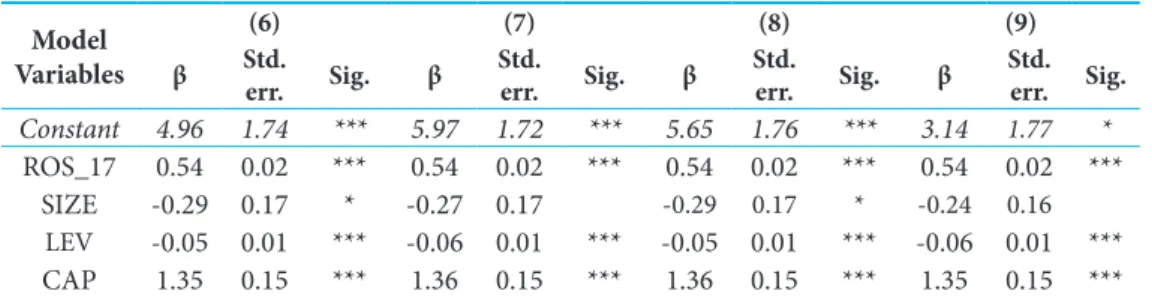
Table 2 presents the results of the WLS regressions. It shows the coefficients of the explanatory variables of Equations (6), (7), (8) and (9) described in the previous section, as well as the related statistics such as the standard errors, empirical significance levels, adjusted R2, F-tests and the maximum values of Cook’s distances.
Based on the F-tests, one can conclude that the explanatory variables together significantly explain profitability; therefore, the linear relationship is also valid. The adjusted R2 values are around 53 to 54 per cent, i.e. the model has adequate explanatory power. Cook’s distances are below the critical value of 1; hence there are not any highly influential outlier observations in the sample. It is important to note that the final sample size decreased further by 1 to 1,099. Some
‘pre-run’ regressions indicated that one of the companies still has an excessive influence on the sample; therefore, it was omitted from the analysis (is was Mattel, the American toy manufac- turer giant, Bloomberg ticker: MAT UW Equity).
Table 2: Results of regression calculations Model
Variables
(6) (7) (8) (9)
β Std.
err. Sig. β Std.
err. Sig. β Std.
err. Sig. β Std.
err. Sig.
Constant 4.96 1.74 *** 5.97 1.72 *** 5.65 1.76 *** 3.14 1.77 * ROS_17 0.54 0.02 *** 0.54 0.02 *** 0.54 0.02 *** 0.54 0.02 ***
SIZE -0.29 0.17 * -0.27 0.17 -0.29 0.17 * -0.24 0.16 LEV -0.05 0.01 *** -0.06 0.01 *** -0.05 0.01 *** -0.06 0.01 ***
CAP 1.35 0.15 *** 1.36 0.15 *** 1.36 0.15 *** 1.35 0.15 ***
GRO 0.04 0.02 ** 0.04 0.02 ** 0.04 0.02 ** 0.04 0.02 **
ESG 0.01 0.02
E -0.01 0.02
S 0.00 0.02
G 0.03 0.02 **
CS 1.23 0.90 1.22 0.89 1.27 0.89 1.19 0.90
CD 0.56 0.44 0.47 0.43 0.52 0.44 0.53 0.43
CST 0.01 0.45 -0.08 0.45 -0.07 0.45 -0.01 0.44
EN 0.20 0.87 0.02 0.84 0.14 0.87 0.29 0.85
FI -2.62 0.98 *** -2.80 0.99 *** -2.77 0.99 *** -2.51 0.97 ***
HC 1.41 0.89 1.51 0.90 * 1.45 0.90 1.41 0.89
IT 2.86 0.75 *** 2.86 0.75 *** 2.86 0.75 *** 2.81 0.75 ***
MA -0.08 0.57 -0.16 0.57 -0.10 0.57 -0.06 0.57
RE 0.99 1.25 1.04 1.22 1.02 1.26 0.96 1.22
UT -1.65 0.62 *** -1.78 0.62 *** -1.76 0.62 *** -1.48 0.59 **
A 2.22 0.45 *** 2.11 0.44 *** 2.14 0.46 *** 2.34 0.43 ***
AP -0.72 0.38 * -0.87 0.35 ** -0.85 0.38 ** -0.43 0.39
Adj. R2 0.55 0.56 0.55 0.56
F 76.57 77.56 76.23 79.92
p-value 0.00 *** 0.00 *** 0.00 *** 0.00 ***
Max.
Cook’s D 0.48 0.39 0.39 0.20
Notes: The dependent variable is the return on sales (ROS).
Regressions are estimated using the weighted least squares (WLS) method. The definition of each vari- able is in Table 1 and the Appendix. Among the dummy variables, due to exact multicollinearity, the
variables IN (industrials) and EMEA (Europe, the Middle East, and Africa) were excluded.
*, **, and *** indicate that the given variable is significant at 10, 5, and 1 per cent, respectively.
Source: Own compilation
Firstly, most of the control variables are significant at least at 5.00 per cent and coincide with preliminary expectations. If the previous year’s (2017) ROS is 1.00 percentage points higher, the 2018 ROS increase approximately 0.54 percentage, ceteris paribus. We measured the size factor in logarithmic form; thus, it shows that a 1.00 per cent growth in size decrease profitability by 0.29/100 basis points (Equation (6)). Although the size factor is significant at 10 per cent in two cases (Equation (6) and (8)), but its practical interpretability is low. Further, size is not significant in model (7) and (9). A 1.00 percentage point surge in indebtedness reduces profitability by 5-6 basis points, assuming everything else is unchanged. If capital intensity rises by one unit (this means an increase of almost 44 per cent from the average value of 2.29), then profitability grows by 1.35 percentage points. A 1.00 percentage point upward shift in the growth rate will result in a 4.00 basis point improvement in profitability. A notable finding is that in 2018 companies opera- ting in the Americas (typically US companies) outperformed companies from the EMEA region by 2.10-2.35 percentage points. In contrast, companies in the Asian region typically underper- form firms in the EMEA region. We now turn to the issue of ESG’s profitability-effects. The regression coefficient of the composite ESG rating does not deviate significantly from zero, so we
must reject H1. In other words, our calculations do not support the higher profitability of com- panies with improved ESG scores. We cannot accept H2 at the usual significance levels either, at least for environmental (E) and social (S) scores. If environmental or social rating increase, financial performance does not change significantly. Our results are in line with [Garcia-Castro et al., 2010; McWilliams and Siegel, 2001, 2000].
In contrast to the previous findings, the corporate governance factor (G) coefficient is signif- icant at 5.00 per cent and has a positive impact on financial performance; therefore, it confirms H2. Firms with higher G scores significantly outperform firms with lower scores. If the G score increases by 10 points, the return on sales ratio become higher by 30 basis points, ceteris pari- bus. In the hypothetical case, if a business jumped from the minimum score 0 to the maximum 100, profitability would increase by 3.00 percentage points. Our result corroborates the findings of [Brown and Caylor, 2006; Core et al., 2006; Giroud and Mueller, 2010] and consistent with stakeholder theory, good management theory and the resource-based view of firms.
Besides, a further important conclusion is that social and environmental factors, which often interpreted as mere costs, do not significantly reduce even short-term profitability. This latter finding implies that it is socially rewarding for companies to invest in ESG projects as they will not experience evaporating profits but might contribute to reach and maintain sustaina- ble growth. This finding is consistent with the argument from Revelli and Viviani [2015]. Also, companies that pay attention to environmental and social concerns foster achieving some of the Sustainable Development Goals of the United Nations. These objectives, among others, are gender equality, inclusive and sustainable economic growth, full and productive employment and decent work, sustainable consumption and production, mitigation of climate change and its impacts. Promoting such goals, in turn, could help reduce risks threatening economies and societies.
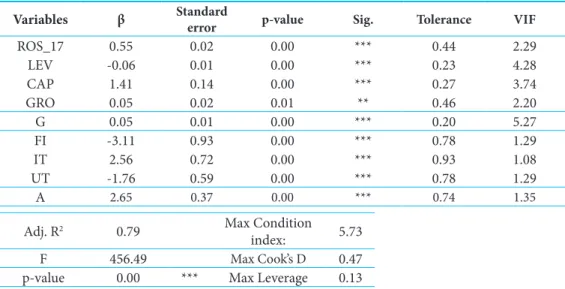
As a robustness check, we executed the regression analyses using stepwise procedures. Table 3 summarises the results.
Table 3: Robustness check, regression with stepwise procedures
Variables β Standard error p-value Sig. Tolerance VIF
ROS_17 0.55 0.02 0.00 *** 0.44 2.29
LEV -0.06 0.01 0.00 *** 0.23 4.28
CAP 1.41 0.14 0.00 *** 0.27 3.74
GRO 0.05 0.02 0.01 ** 0.46 2.20
G 0.05 0.01 0.00 *** 0.20 5.27
FI -3.11 0.93 0.00 *** 0.78 1.29
IT 2.56 0.72 0.00 *** 0.93 1.08
UT -1.76 0.59 0.00 *** 0.78 1.29
A 2.65 0.37 0.00 *** 0.74 1.35
Adj. R2 0.79 Max Condition
index: 5.73
F 456.49 Max Cook’s D 0.47
p-value 0.00 *** Max Leverage 0.13 Source: Own compilation
The findings are similar to Equations (6)-(9), seeing that ESG, E and S dropped out from the final model. Further, in line with our primary findings, the governance factor is significant, but here even at 1.00 per cent. Moreover, the coefficient is higher than before (45 basis points). The coeffi- cients of the control variables remained close to the original model estimates and are typically significant at 1.00 per cent (the size variable is still insignificant).
Conclusion
In this study, we employed the ESG concept (environmental, social and governance) to test one of the dominant management literature hypotheses, namely the existence of a positive ESG- financial performance relationship. Environmental criteria consider how companies perform as supporters of nature and often referred to as corporate externality risks. Social measures sum- marise reputational issues, i.e. how companies take care of their primary stakeholders, including employees, suppliers, customers. Corporate governance deals with company leadership, such as executive pays, audits, internal controls, financial reporting and minority investor rights. Many times, scholars consider governance policies as agency problems.
To perform the analysis, we collected a 1,099-element corporate sample from Bloomberg.
Observations include companies that were members of the MSCI ACWI Index in 2018.
Regression calculations relied on the weighted least squares (WLS) method. The dependent var- iable was the return on sales ratio (ROS, 2018); the control variables were previous year (2017) profitability, size, leverage, growth, capital intensity, industry and regional dummies. To interpret corporate size, leverage, and growth in a more sophisticated way, we used three firm characteris- tics for each. However, to avoid high multicollinearity, but to consider correlations between the variables, we applied principal component analysis.
Our findings indicate that higher ESG, E, and S ratings did not significantly change the profitability in the short run. However, corporate governance had a significant and positive effect at 5.00 per cent: a 10-point increase in G score increased ROS by 0.30 percentage points.
Another important conclusion is that social and environmental factors, which often inter- preted as mere costs, did not significantly reduce short-term profitability. This latter finding implies that companies should invest in ESG projects as they will not experience evaporating profits but might contribute to reach some of the Sustainable Development Goals (SDGs) of the United Nations.
References
Aupperle, K. E. – Carroll, A. B. – Hatfield, J. D. (1985): “An Empirical Examination of the Relationship between Corporate Social Responsibility and Profitability” The Academy of Management Journal 28(2): 446–463. doi: https://doi.org/10.2307/256210
Barney, J. (1991): “Firm Resources and Sustained Competitive Advantage” Journal of Management 17(1): 99–120. doi: https://doi.org/10.1177/014920639101700108
Bebchuk, L. A. – Cohen, A. – Wang, C. C. Y. (2013): “Learning and the disappearing association between governance and returns” Journal of Financial Economics 108(2): 323–348. doi:
https://doi.org/10.1016/j.jfineco.2012.10.004
Bebchuk, L. – Cohen, A. – Ferrell, A. (2009): “What Matters in Corporate Governance?” Review of Financial Studies 22(2): 783–827. doi: https://doi.org/10.2139/ssrn.593423
Brammer, S. – Pavelin, S. (2006): “Voluntary Environmental Disclosures by Large UK Companies” Journal of Business Finance & Accounting 33(7–8): 1168–1188. doi: https://doi.
org/10.1111/j.1468-5957.2006.00598.x
Brammer, S. – Pavelin, S. (2008): “Factors influencing the quality of corporate environmental disclosure” Business Strategy and the Environment 17(2): 120–136. doi: https://doi.
org/10.1002/bse.506
Brown, L. D. – Caylor, M. L. (2006): “Corporate governance and firm valuation” Journal of Accounting and Public Policy 25(4): 409–434. doi: https://doi.org/10.1016/j.
jaccpubpol.2006.05.005
Callan, S. J. – Thomas, J. M. (2009): “Corporate financial performance and corporate social performance: an update and reinvestigation” Corporate Social Responsibility and Environmental Management 16(2): 61–78. doi: https://doi.org/10.1002/csr.182
Capon, N. – Farley, J. U. – Hoenig, S. (1990): “Determinants of Financial Performance: A Meta-Analysis” Management Science 36(10): 1143–1159. doi: https://doi.org/10.1287/
mnsc.36.10.1143
Clarkson, M. B. E. (1995): “A Stakeholder Framework for Analysing and Evaluating Corporate Social Performance” The Academy of Management Review 20(1): 92–117. doi: https://doi.
org/10.2307/258888
Collins, S. – Allen, B. (2020): What’s it worth? KPMG Valuation Practices Survey 2019. KPMG, https://home.kpmg/au/en/home/insights/2020/02/valuation-practices-survey-2019.html downloaded: 31.05.2020.
Core, J. E. – Guay, W. R. – Rusticus, T. O. (2006): “Does Weak Governance Cause Weak Stock Returns? An Examination of Firm Operating Performance and Investors’ Expectations” The Journal of Finance 61(2): 655–687. doi: https://doi.org/10.1111/j.1540-6261.2006.00851.x Cormier, D. – Ledoux, M. – Magnan, M. (2011): “The informational contribution of social
and environmental disclosures for investors” Management Decision 49(8): 1276–1304. doi:
https://doi.org/10.1108/00251741111163124
Cormier, D. – Magnan, M. (2003): “Environmental reporting management: a continental European perspective” Journal of Accounting and Public Policy 22(1): 43–62. doi: https://doi.
org/10.1016/S0278-4254(02)00085-6
Dam, L. (2008): Corporate social responsibility and financial markets. University of Groningen, Groningen.
Dhaliwal, D. S. – Li, O. Z. – Tsang, A. – Yang, Y. G. (2011): “Voluntary Nonfinancial Disclosure and the Cost of Equity Capital: The Initiation of Corporate Social Responsibility Reporting”
The Accounting Review 86(1): 59–100. doi: https://doi.org/10.2308/accr.00000005
Eccles, R. G. – Ioannou, I. – Serafeim, G. (2014): “The impact of corporate sustainability on organisational processes and performance” Management Science 60(11): 2835–2857. doi:
https://doi.org/10.1287/mnsc.2014.1984
Edmans, A. (2012): “The Link Between Job Satisfaction and Firm Value, With Implications for Corporate Social Responsibility” Academy of Management Perspectives 26(4): 1–19. doi:
https://doi.org/10.5465/amp.2012.0046
Ehrbar, A. (1998): EVA: The Real Key to Creating Wealth. John Wiley & Sons, Inc., New York, Freeman, R. E. (2010): Strategic Management: A Stakeholder Approach. Cambridge University NY.
Press, New York, NY.
Friede, G. – Busch, T. – Bassen, A. (2015): “ESG and financial performance: aggregated evidence from more than 2000 empirical studies” Journal of Sustainable Finance & Investment 5(4):
210–233. doi: https://doi.org/10.1080/20430795.2015.1118917
Friedman, M. (1970, September 13): “The Social Responsibility of Business Is to Increase Its Profits” The New York Times Magazine. http://link.springer.com/10.1007/978-3-540-70818- 6_14 downloaded:05.05.2020.
Garcia-Castro, R. – Ariño, M. A. – Canela, M. A. (2010): “Does Social Performance Really Lead to Financial Performance? Accounting for Endogeneity” Journal of Business Ethics 92(1):
107–126. doi: https://doi.org/10.1007/s10551-009-0143-8
Giroud, X. – Mueller, H. M. (2010): “Does corporate governance matter in competitive industries?” Journal of Financial Economics 95(3): 312–331. doi: https://doi.org/10.1016/j.
jfineco.2009.10.008
Griffin, J. J. – Mahon, J. F. (1997): “The Corporate Social Performance and Corporate Financial Performance Debate: Twenty-Five Years of Incomparable Research” Business & Society 36(1):
5–31. doi: https://doi.org/10.1177/000765039703600102
GSIA (2018): Global Sustainable Investment Review 2018. GSIA, http://www.gsi-alliance.org/
trends-report-2018/ downloaded: 03.05.2020.
Günther, E. – Hoppe, H. – Endrikat, J. (2012): “Corporate financial performance and corporate environmental performance: a perfect match?” Zeitschrift Für Umweltpolitik Und Umweltrecht 34: 279–296.
Hart, S. L. (1995): “A Natural-Resource-Based View of the Firm” The Academy of Management Review 20(4): 986–1014. doi: https://doi.org/10.2307/258963
Hart, S. L. – Ahuja, G. (1996): “Does It Pay to Be Green? An Empirical Examination of the Relationship Between Emission Reduction and Firm Performance”
Business Strategy and the Environment 5(1): 30–37. doi: https://doi.org/10.1002/
(SICI)1099-0836(199603)5:1<30::AID-BSE38>3.0.CO;2-Q
Hart, S. L. – Dowell, G. (2011): “Invited Editorial: A Natural-Resource-Based View of the Firm: Fifteen Years After” Journal of Management 37(5): 1464–1479. doi: https://doi.
org/10.1177/0149206310390219
Henisz, W. – Koller, T. – Nuttall, R. (2019): “Five ways that ESG creates value” McKinsey Quarterly November: 1–12. https://www.mckinsey.com/business-functions/strategy-and-corporate- finance/our-insights/five-ways-that-esg-creates-value downloaded: 07.05.2020.
Hillman, A. J. – Keim, G. D. (2001): “Shareholder value, stakeholder management, and social issues: what’s the bottom line?” Strategic Management Journal 22(2): 125139. doi: https://doi.
org/10.1002/1097-0266(200101)22:2<125::AID-SMJ150>3.0.CO;2-H
Johnson, S. A. – Moorman, T. C. – Sorescu, S. (2009): “A Reexamination of Corporate Governance and Equity Prices” Review of Financial Studies 22(11): 4753–4786. doi: https://
doi.org/10.1093/rfs/hhp018
Juhász, P. (2018): Vállalatértékelési számítások: Feladatok és megoldások. Budapesti Corvinus Egyetem, Budapest.
Justice, P. – Hale, J. (2016): Morningstar Sustainability Rating. Morningstar, https://s21.q4cdn.
com/198919461/files/doc_downloads/press_kits/2016/Morningstar-Sustainability-Rating- Methodology.pdf downloaded: 04.03.2020
Kovács, E. (2014): Többváltozós adatelemzés. Typotex, Budapest.
Kovács, E. – Dömötör, B. – Naffa, H. (2011): “Investment Decisions in Crisis - A Study of Private Pension Fund Investments” Acta Oeconomica 61(4): 389–412. doi: https://doi.org/10.1556/
aoecon.61.2011.4.1
Makni, R. – Francoeur, C. – Bellavance, F. (2009): “Causality Between Corporate Social Performance and Financial Performance: Evidence from Canadian Firms” Journal of Business Ethics 89(3): 409–422. doi: https://doi.org/10.1007/s10551-008-0007-7
Margolis, J. D. – Walsh, J. P. (2003): “Misery Loves Companies: Rethinking Social Initiatives by Business” Administrative Science Quarterly 48(2): 268. doi: https://doi.org/10.2307/3556659 McWilliams, A. – Siegel, D. (2000): “Corporate social responsibility and financial performance:
correlation or misspecification?” Strategic Management Journal 21(5): 603–609. doi: https://
doi.org/10.1002/(SICI)1097-0266(200005)21:5<603::AID-SMJ101>3.0.CO;2-3
McWilliams, A. – Siegel, D. (2001): “Corporate social responsibility: A theory of the firm perspective” Academy of Management Review 26(1): 117–127. doi: https://doi.
org/10.2307/259398
Menz, K.-M. (2010): “Corporate Social Responsibility: Is it Rewarded by the Corporate Bond Market? A Critical Note” Journal of Business Ethics 96(1): 117–134. doi: https://doi.
org/10.1007/s10551-010-0452-y
Mitchell, R. K. – Agle, B. R. – Wood, D. J. (1997): “Toward a Theory of Stakeholder Identification and Salience: Defining the Principle of Who and What Really Counts” The Academy of Management Review 22(4): 853–886. doi: https://doi.org/10.2307/259247
Orlitzky, M. – Schmidt, F. L. – Rynes, S. L. (2003): “Corporate Social and Financial Performance: A Meta-Analysis” Organization Studies 24(3): 403–441. doi: https://doi.
org/10.1177/0170840603024003910
Patten, D. M. (1991): “Exposure, legitimacy, and social disclosure” Journal of Accounting and Public Policy 10(4): 297–308. doi: https://doi.org/10.1016/0278-4254(91)90003-3
Peloza, J. (2009): “The Challenge of Measuring Financial Impacts From Investments in Corporate Social Performance” Journal of Management 35(6): 1518–1541. doi: https://doi.
org/10.1177/0149206309335188
Porter, M. E. – van der Linde, C. (1995): “Toward a New Conception of the Environment- Competitiveness Relationship” Journal of Economic Perspectives 9(4): 97–118. doi: https://
doi.org/10.1257/jep.9.4.97
Preston, L. E. – O’Bannon, D. P. (1997): “The corporate social-financial performance relationship: A typology and analysis” Business & Society 36(4): 419–429. doi: https://doi.
org/10.1177/000765039703600406
Qiu, Y. – Shaukat, A. – Tharyan, R. (2016): “Environmental and social disclosures: Link with corporate financial performance” The British Accounting Review 48(1): 102–116. doi: https://
doi.org/10.1016/j.bar.2014.10.007
Renneboog, L. – Ter Horst, J. – Zhang, C. (2008): “Socially responsible investments: Institutional aspects, performance, and investor behavior” Journal of Banking & Finance 32(9): 1723–1742.
doi: https://doi.org/10.1016/j.jbankfin.2007.12.039
Revelli, C. – Viviani, J.-L. (2013): “The Link Between SRI and Financial Performance:
Effects and Moderators” Management International 17(2): 105–122. doi: https://doi.
org/10.7202/1015403ar
Revelli, C. – Viviani, J.-L. (2015): “Financial performance of socially responsible investing (SRI):
what have we learned? A meta-analysis” Business Ethics: A European Review 24(2): 158–185.
doi: https://doi.org/10.1111/beer.12076
Russo, M. V. – Fouts, P. A. (1997): “A Resource-Based Perspective On Corporate Environmental Performance And Profitability” Academy of Management Journal 40(3): 534–559. doi: https://
doi.org/10.5465/257052
Schaltegger, S. – Figge, F. (2000): “Environmental shareholder value: economic success with corporate environmental management” Eco-Management and Auditing 7(1): 29–42. doi:
https://doi.org/10.1002/(SICI)1099-0925(200003)7:1<29::AID-EMA119>3.0.CO;2-1 Ullmann, A. A. (1985): “Data in Search of a Theory: A Critical Examination of the Relationships
among Social Performance, Social Disclosure, and Economic Performance of U. S. Firms”
The Academy of Management Review 10(3): 540–557. doi: https://doi.org/10.2307/258135 United Nations (2015): “Transforming our world: the 2030 Agenda for Sustainable Development.”
https://sustainabledevelopment.un.org/post2015/transformingourworld downloaded:
23.05.2020.
Vance, S. C. (1975): “Are socially responsible corporations good investment risks” Management Review 64(8): 19–24.
Waddock, S. A. – Graves, S. B. (1998): “The Corporate Social Performance-Financial Performance Link” Strategic Management Journal 18(4): 303–319. doi: https://doi.org/10.1002/
(SICI)1097-0266(199704)18:4<303::AID-SMJ869>3.0.CO;2-G
Wagner, M. (2005): “How to reconcile environmental and economic performance to improve corporate sustainability: corporate environmental strategies in the European paper industry.”
Journal of Environmental Management 76(2): 105–118. doi: https://doi.org/10.1016/j.
jenvman.2004.11.021
Wernerfelt, B. (1984): “A resource-based view of the firm” Strategic Management Journal 5(2):
171–180. doi: https://doi.org/10.1002/smj.4250050207
Wooldridge, J. (2013): Introductory Econometrics : A Modern Approach. Cengage Learning, Inc, Mason.
Appendix
Variables in the analysis
Factor Variable Abbr. Calculation Bloomberg code
Profitability Return on
sales (2018) ROS Profit after tax (2018) / Net sales
(2018) PROF_MARGIN
Profitability
(t-1) Return on sales
(2017) ROS_17 Profit after tax (2017) / Net
sales (2017) PROF_MARGIN
Firm size (SIZE)
Market
capitalization (2018) MCAP ln(Number of shares * Price/
share) (28.12.2018.) CUR_MKT_CAP Assets (2018) ASSETS ln(Fixed plus current assets) (at the end of 2018) BS_TOT_ASSET Net sales (2018) SALES ln(Net sales) (2018) SALES_REV_TURN
Leverage (LEV)
Book leverage
(2018) BLEV
LT debt. + max(ST debt - Cash; 0) / Equity + LT debt + max(ST debt - Cash; 0) (at
the end of 2018)
BS_LT_BORROW BS_TOT_ASSETS CASH_AND_
MERKETABLE EQY_SH_OUT
PX_LAST TOT_COMMON_
EQY Market
capitalisation based
leverage (2018) MLEV
LT debt. + max(ST debt - Cash; 0) / Market cap + LT debt + max(ST debt - Cash;
0) (at the end of 2018) Net debt/Assets DA LT debt + max(ST debt -
Cash; 0) / Assets (at the end of 2018) Capital
intensity Capital intensity
(2018) CAP Assets (at the end of 2018) /
Net sales (2018) BS_TOT_ASSET SALES_REV_TURN
Growth rate
Average growth rate of assets (2016-
2018) gASSETS Average growth in assets (2016-2018) / Average of the
assets (2016-2018)
BS_TOT_ASSET SALES_REV_TURN
IS_INC_BEF_XO_
ITEM Average growth rate
of net sales (2016-
2018) gSALES Average growth in net sales (2016-2018) / Average net
sales (2016-2018) Average growth rate
of profit after tax
(2016-2018) gPAT Average growth in profit after tax (2016-2018) / Average profit after tax (2016-2018)
ESG score
ESG score (2018) ESG
Scores of Sustainalytics
SUSTAINALYTICS_
SUSTAINALYTICS_RANK ENVIRONMEN SUSTAINALYTICS_
SOCIAL SUSTAINALYTICS_
GOVERNANCE Environment score
(2018) E
Social score (2018) S Governance score
(2018) G
(continued)
Factor Variable Abbr. Calculation Bloomberg code
Sectors
Communication services CS
GICS classification (dummy variables)
GICS_
SECTOR_
NAME Consumer discretionary CD
Consumer staples CST
Energy EN
Financials FI
Health care HC
Industrials IN
Information technology IT
Materials MA
Real estate RE
Utility UT
Regions
Americas A
MSCI classification
(dummy variables) - Europe, the Middle East and
Africa EMEA
Asia-Pacific AP
Notes: The dependent variable is the ROS 2018.
Source: Own compilation