An Economic and Facile Method for Graphene Oxide Preparation from Graphite Powder
Monika Furko*, Zsolt Fogarassy, Katalin Balázsi and Csaba Balázsi
Institute for Technical Physics and Materials Science, Centre for Energy Research, Hungarian Academy of Sciences, Konkoly-Thege M. str. 29–33, Budapest, Hungary
Received: 12 March 2019; accepted: 14 April 2019
A new method for preparing multi-layered graphene oxide powder was developed. In this method, the raw material was commercially available micro-sized graphite powder. The graphite powder was milled using a high speed attri- tor mill to reduce the particle size of the graphite to nanometer and to exfoliate the graphite into multi-layered gra- phene particles. The graphene particles were then oxidized into graphene oxide (GO) using the combination of strong oxidizing agents, thermal oxidizing, and sonication. Thorough morphological characterizations have been carried out to reveal the structure and the size of GO particles. The results confirmed that the oxidation process was successful.
Keywords:graphene oxide, multi-layer graphene, Raman spectroscopy, TEM
1. Introduction
The graphene material can be used in various applications, because of its unique properties, such as high Young's modu- lus values, excellent thermal conductivity, and the mobility of charge carriers [1]. The first applications of graphene were in the field of electronic devices, owing to its electronic charac- teristics [2–4]. Moreover, the graphene has more other inter- esting properties, such as high strength and stiffness, excellent thermal properties, and promising biocompatibility [5].
However, the main problem with graphene is that it cannot be produced in large quantity up to now, which makes the in- dustrial use difficult. It is well known that graphite does not readily exfoliate to yield monolayer graphene sheets. The other problem is that the graphene sheets are hard to be incor- porated and distributed homogeneously into various matrices for applications. Graphite oxide, containing abundant oxygen- based groups, not only can be obtained easily from the oxida- tion of graphite, but also can be readily exfoliated to graphene oxide (GO) nanosheets. In many studies, GO is regarded as the precursor to produce reduced graphene oxide (rGO) by chemical and thermal reduction [6–8].
GO can be readily modified for a particular use due to the presence of abundant oxygen-containing functional groups and can be used as functional materials for various applica- tions [9–12]. In addition, GO materials, which are biocompati- ble and hydrophilic, have wide potential applications in biomedical engineering and biotechnology. [12].
There are different ways to prepare GO powders. Firstly, one possible way is when graphite powder is oxidized to pro- duce graphite oxide, which can be readily dispersed in water or another polar solvent due to the presence of hydroxyl and epoxide groups across the basal planes of graphite oxide and carbonyl and carboxyl groups located at the edges [13–15].
Secondly, bulk graphite oxide can be exfoliated by sonication to form colloidal suspensions of monolayer, bilayer, or few- layer GO sheets in different solvents [1]. The critical point of preparing GO is the selection of suitable oxidizing agents to oxidize graphite. The most commonly used method was reported by Hummers in 1958 [16]. In this method, the oxida- tion of graphite to graphite oxide is accomplished by treating graphite with a mixture of concentrated H2SO4, NaNO3, and
KMnO4. The Hummers' method requires less than 2 h for completion at temperatures below 45 °C. However, in the oxi- dizing process, toxic NOx and ClO2 gases are generated by the reactions. To solve this problem, some modifications based on the Hummers' method have been carried out [17–20]. Kov- tyukhova [17] used a pre-oxidizing procedure with H2SO4, K2S2O8, and P2O5. The C/O ratio of the oxidation product was 4.0:3.1, proving that this was richer in oxygen than the graphite oxide prepared using the Hummers' method. The method proposed by Kovtyukhova is regarded as the modified Hummers' method. Marcano [21] proposed another method, which was named as the improved Hummers' method. The improved Hummers' method, using KMnO4, H2SO4, and H3PO4as the oxidizing agents, avoids the release of NOxand yields a greater amount of hydrophilic oxidized graphite mate- rial compared to the original Hummers' method. Higginbo- tham et al. discovered that by H3PO4 addition to the multi- walled carbon nanotubes, more GO nanoribbons were pro- duced with more intact graphitic basal planes [22]. There are reports on preparing GO by the so-called chemical free syn- thesis by a hydrothermal route (Tang-Lau method) [23], in which they used glucose, fructose, and sugar as major ingredi- ents to obtain GO powder.
In this work we propose a new, environment-friendly, and economic method for preparing GO powder on a large scale using commercially available graphite powders. The method consists of chemical and thermal oxidation steps. The structure and morphology of the prepared powders are thoroughly ex- amined by SEM and TEM measurements, as well as Raman spectroscopy.
2. Experimental
2.1. Preparation of Multilayer Graphene (MLG). The raw material was synthetic graphite powder (Sigma Aldrich,
<20 μm, Synthetic). The graphite was milled in a high efficient attritor mill (Union Process, type 01-HD/HDDM) equipped with zirconia discs and grinding media (diameter of 1 mm) in a 750-mL silicon nitride tank. The ball milling was run with a rotation speed of 3000 rpm for 10 h in ethanol media.
2.2. Synthesis of Nano-Sized GO Powder. The previously prepared MLG nanosheets were then treated in 3 steps. First, the powders were dispersed in cc. HNO3 solution and stirred
* Author for correspondence: furko.monika@energia.mta.hu
DOI: 10.1556/2051.2019.00066 Resolution and Discovery
at 80 °C for 4 h, and then, 50% H2O2 was added to the dispersion under continuous stirring and kept at room temperature for 16 h. The dispersion was then filtered using filter paper grade 3, and the filtrate was washed/rinsed with 30% H2O2and 96% ethanol and dried at 150 °C in air (GO1).
In the second step, the dried powders were collected and put into an oven (Denkal 4 K/1100) and heat-treated at 850 °C for thermal oxidation (GO2). Finally, a portion of treated powders were dispersed again in 96% ethanol and sonicated in an ultrasonic bath (Elmasonic E60H) for 3 h at 70 °C to examine the effect of ultrasound on the exfoliation rate of GO multilayers, and then, the solvent was evaporated at 80 °C (GO3).
2.3. Characterization Techniques
2.3.1. Scanning Electron Microscopy (SEM) Study and Energy-Dispersive X-Ray Spectroscopy (EDX) Elemental Analysis. The morphological properties of the layers were studied using SEM and focused ion beam (FIB) measurements with LEO 1540XB Crossbeam workstation. The beam param- eters in the SEM imaging mode were 5-keV beam energy and 30-um aperture size, and Everhart-Thornley and InLens sec- ondary electron detectors were used. The ion beam parameters in the FIB milling mode were 30-kV accelerating voltage and 5-nA beam current. For SEM/FIB measurements, the samples were tilted at 36° angle. The electron beam parameters for the EDX were 8 keV beam energy. A Röntec Si (Li) detector and Bruker Esprit 1.9 software had been used for the EDX measurements.
2.3.2. Transmission Electron Microscopy Measurements.
TEM measurements were performed to study the structural
properties of the investigated samples (TEM, Philips CM-20) with an accelerating voltage of 200 kV. For the TEM studies, QUANTIFOIL Cu grids were used with holey carbon foil.
2.3.3. Raman Spectroscopy Measurements. The specific chemical bonds in the samples were detected using Raman spectroscopy. A Renishaw 1000 B micro-Raman spectrometer attached to a Leica DM/LM microscope was used to examine the samples at room temperature in a wavenumber range of 150–3500 cm−1with 435-nm laser excitation. The spectral res- olution of the system is 2.5 cm−1and the diameterof the exci- tation spot is 1μm.
3. Results and Discussion
3.1. Microstructural Analysis by SEM Characterization.
Figure 1 shows the SEM images of graphite, multilayer graphene, and GO particles. The precursor graphite powder revealed large particles with rectangular and rod-like shapes in micrometer sizes. The size of these particles is not uniform.
The typical wrinkled lamellar and multilayered structure of the particles is clearly visible in the case of the MLG powder.
The thin platelets are closely stacked and compacted. After chemical oxidization treatment (GO1), the graphene have become even more exfoliated, and individual GO sheets can be observed with wrinkled edges. After thermal oxidization, the morphology of GO particles has changed, and smaller- sized platelets (100–600 nm) have appeared along with the larger plates. It has been observed that the GO platelets in this case have been well oriented and parallel with one another.
The edges of the platelets have become more corrugated upon
Figure 1.SEM images of graphite (a), MLG (b), and the different GO powders GO1 (c), GO2 (d), and GO3 (e)
oxidization. Ultrasonication (700 W) for a long time (3 h) visibly reduced the size of the GO particles (GO3) and small flake-like particles also appeared. The size of the GO particles varied within a large scale between 50 nm and 500 nm.
3.2. EDX Analysis. EDX measurements have been performed to prove the presence of oxygen in the GO samples. It can be seen in Figure 2 that the intensity of the oxygen peak has become slightly larger by applying the oxidation processes.
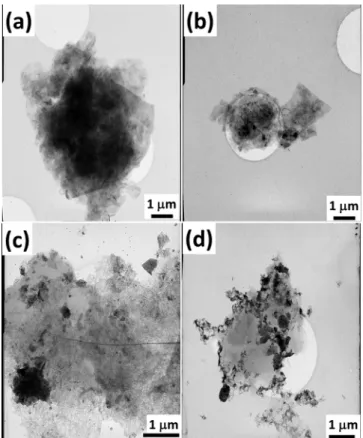
3.3. TEM Characterization. The layered structure and high electron transparency of MLG is clearly visible in Figure 3a. The individual graphene layers are stacked by van der Waal's forces, leading to the formation of multi-layered structure. The GO samples demonstrate a quite similar morphology in the case of half a micron rectangular GO parts
(Figure 3b–d), and the pieces are plate-shape but a little bit more separated from each other. In addition, the appearance of nanosized disordered regions with different morphology can be noticed in Figure 3b–d.
The two major features in GO samples are the graphitic re- gions (graphene-like) and the high contrast disordered regions, which indicate areas of high oxidation [24].
During the graphitic exfoliation and oxidation processes, oxygen-containing groups incorporate into the graphene layers, resulting in a change in morphology [25]. Pacile [26]
also described that the structure of GO sheets consists of or- dered regions, along with disordered oxygen-containing func- tional group areas.
3.4. Raman Spectroscopy Measurements. Raman spectroscopy is a useful method to examine the disorders and defects in the crystal structure, so it is often applied to characterize graphite and its derivatives [27–30]. Figure 4 represents the Raman spectra of graphite, MLG, and the different GO powders.
The characteristic D, G, 2D, and D + G peaks of graphene and GO materials are visible in all cases. The D peak (at around 1340 cm−1) represents the breathing mode of aromatic rings arising from the defects that is created due to the intro- duction of oxygenated groups into the sample and also due to the first order resonance. The D-peak intensity is therefore of- ten used as a measure of the degree of disorder and the sp3 bonding in graphene [28]. The peak‘G’is an in-plane vibra- tional mode involving the sp2 hybridized carbon atoms that comprise the graphene sheet, and its position is highly sensi- tive to the number of layers present in the samples [27, 31]. In our case, the C-C sp2 network of MLG and GO platelets gen- erates an intense G peak at 1565 cm−1.
It is visible that the GO samples have D peaks with higher intensity and their intensity increases with oxidization pro- cesses. A larger D peak along with a large bandwidth suggests a significant structural disorder in GO. Moreover, the lower intensity of D peak compared to the G peak shows partial oxi- dation of MLG. It is reported that when defects and disorders exist in the carbon-based materials with graphite structure, a D peak around 1620 cm−1 is induced as the shoulder of G peak, which not only enlarges the bandwidth of the G peak [32, 33], but also raises the intensity of D peak.
The peak‘2D’at around 2690 cm−1 is the second order of the D peak, referred to an overtone of the D peak, and it is the Figure 2. EDX elemental analysis of MLG and the different GO
particles
Figure 3.TEM images of MLG (a) and the different GO powders GO1 (b), GO2 (c), and GO3 (d)
Figure 4. Raman spectra of graphite, MLG, and the different GO samples
result of a two-phonon lattice vibrational process [34, 35]. It is conventionally assigned to the number of graphene layers.
The‘D + G’is a defect activated peak [36]. In addition, the 2D peak is also attributed to double resonance transitions resulting in the production of 2 phonons with opposite mo- mentum. Unlike the D peak, which is Raman active only in the presence of defects, the 2D peak is active even in the ab- sence of any defects. It is reported that a red shift of the Ra- man 2D peak to <2660 cm−1 signifies the formation of pure and single-layer graphene [34]. A slight defect-activated peak called D + G is also visible at around 2905 cm−1[37, 38].
Ferrari et al. described that the intensity of 2D peak is de- creased and their bandwidth significantly broadened by the in- crease of the number of graphene layers to form graphite.
Moreover, the 2D peak gradually separates into multiple peaks, because the interaction of each graphene plane splits the electronic bands [27]. The disorder and the amount of structural defects are determined by the intensity ratio between the disorders induced by the D peak and the Raman-allowed G peak (ID/IG) [27].
The ID/IG value of the MLG was as small as 0.069. The in- tensity ratio of I2D/IG is generally used to estimate the num- ber of graphene layers [31, 39, 40]. In our case, the I2D/IG ratio was 0.335 for MLG. In comparison, the I2D/IG value of the graphite particles is 0.02, which is much smaller than that of the multilayer graphene. The defects in MLG particles might arise from the mechanical milling process. For GO par- ticles, larger numbers were measured, ID/IG of 0.109, 0.09, and 0.115 for GO1, GO2, and GO3, respectively, which is caused by the extensive oxidation process. It is observed that the GO particles prepared with different oxidization processes exhibit an ID/IG ratio nearly similar to one another.
The increase of ID/IG from 0.07 (graphite) to 0.115 (GO3) confirms the grafting of oxygen-containing functional groups to the graphitic planes [41].
On the other hand, the I2D/IG ratios are 0.417, 0.362, and 0.37 for GO1, GO2, and GO3, respectively, due to the weak graphene crystallinity. It is also visible that the 2D peak shifts to smaller wavelength and exhibits slightly enlarged band- width when the graphite source is exfoliated to MLG and also with the oxidization processes [27, 33].
By comparison, in the Raman spectra of the investigated samples in Figure 4, it can also be observed that the G peaks in the GO samples are shifted to a slightly higher wave num- ber (from 1564 cm−1 for graphite to 1578 cm−1 for the GO samples) owing to the oxygenation of graphite, resulting in the formation of sp3 carbon atoms. The D peak in GO is broadened due to the reduction in size of the sp2 domains by the generation of defects and distortions during oxidation [41, 42].
4. Conclusions
GO powder were successfully prepared from commercially available graphite powder by applying appropriate exfoliation, chemical, and thermal oxidization processes.
The SEM images revealed that the MLG powder consisted of wrinkled lamellar and multilayered structure of particles, while the GO particles showed different morphology with smaller-sized platelets, which were well oriented and parallel.
The edges of the platelets became corrugated upon oxidiza- tion, and the ultrasonication visibly reduced the size of the GO particles even more. The TEM structural characterization proved a quite similar morphology in the case of half a micron rectangular GO parts, whereas the appearance of nanosized disordered regions with different morphology can also be no- ticed due to oxidation. The characteristic D, G, 2D, and
D + G peaks of graphene and GO materials appeared in the Raman spectra for all the samples. The GO samples had D peaks with higher intensity than the MLG particles, and their intensity increased with oxidization processes.
Acknowledgements. The authors acknowledge the support given by the Hungarian National Research Development and Innovation Office for the funding of NN-127723
“Multifunctional Ceramic/Graphene Coatings for New Emerging Applications” (FLAG-ERA) and NNE-129976
“Eco-friendly AlON Processing” projects. Thanks to Levente Illés and Dr. Sára Tóth for help in SEM/EDX and Raman investigation.
Open Access. This is an open-access article distributed under the terms of the Creative Commons Attribution- NonCommercial 4.0 International License (https://
creativecommons.org/licenses/by-nc/4.0/), which permits unrestricted use, distribution, and reproduction in any medium for non-commercial purposes, provided the original author and source are credited, a link to the CC License is provided, and changes - if any - are indicated.
References
1 Park, S. J.; Ruoff, R. S.Nat.Nanotechnol.2009,4, 217–224.
2 Geim, A. K.Science2009,324, 1530–1534.
3 Avouris, P.Nano Lett.2010,10, 4285–4294.
4 Schwierz, F.Nat. Nanotechnol.2010,5, 487–496.
5 Pinto, A. M.; Gonçalves, I. C.; Magalhães, F. D. Colloids Surf., B, 2013,111, 188–202.
6 Jose, P. P. A.; Kala, M. S.; Kalarikkal, N.; Thomas, S.Mater. Today:
Proc.2018,5, 16306–16312.
7 Betancur, A. F.; Ornelas-Soto, N.; Garay-Tapia, A. M.; Pérez, F. R.;
Salazar, Á.; García, A. G.Mater. Chem. Phys.2018, 21851–21861.
8 Choon, O. P.; Mohammad Haniff, M. A. S.; Mohd Razip, W. M. F.; Fu, C.; Goh, B. T.; Mohamed, M. A.; Majlis, B. Y.Carbon2017,124, 547–554.
9 Sandhya, P. K.; Jose, J.; Sreekala, M. S.; Padmanabhan, M.; Kalarikkal, N.; Thomas, S.Ceram. Int.2018,44, 15092–15098.
10 Naderi, N.; Rasi, S.; Moradi, M.Optik2018,172, 57–62.
11 An, W.; Zhang, Y.; Zhang, X.; Li, K.; Kang, Y.; Akhtar, S.; Sha, X.;
Lan, G.Exp. Eye Res.2018,174, 59–69.
12 Li, J.; Zeng, X.; Ren, T.; van der Heide, E.Lubricants,2014,2, 137–161.
13 Szabó, T.; Szeri, A.; Dékány, I.Carbon2005,43, 87–94.
14 He, H.; Klinowski, J.; Forster, M.; Lerf, A.Chem. Phys. Lett.1998, 287, 53–56.
15 Lerf, A.; He, H.; Forster, M.; Klinowski, J.J. Phys. Chem. B,1998, 102, 4477–4482.
16 Hummers, W. S.; Offeman, R. E.J. Am. Chem. Soc.1958,80, 1339–1339.
17 Kovtyukhova, N. I.; Ollivier, P. J.; Martin, B. R.; Mallouk, T. E.;
Chizhik, S. A.; Buzaneva, E. V.; Gorchinskiy, A. D.Chem. Mater.1999,11, 771–778.
18 Ma, C.; Liu, W.; Shi, M.; Lang, X.; Chu, Y.; Chen, Z.; Zhao, D.;
Lin, W.; Hardacre, C.Electrochim. Acta2013,114, 133–141.
19 Nikolakopoulou, A.; Tasis, D.; Sygellou, L.; Dracopoulos, V.; Galiotis, C.; Lianos, P.Electrochim. Acta2013,111, 698–706.
20 Yu, Y.; Kang, B.; Lee, Y.; Lee, S.; Ju, B.Appl. Surf. Sci.2013,287, 91–96.
21 Marcano, D. C.; Kosynkin, D. V.; Berlin, J. M.; Sinitskii, A.; Sun, Z.;
Slesarev, A.; Alemany, L. B.; Lu, W.; Tour, J. M.ACS Nano2010,4, 4806–4814.
22 Higginbotham, A. L.; Kosynkin, D. V.; Sinitskii, A.; Sun, Z.; Tour, J. M.ACS Nano2010,4, 2059–2069.
23 Tang, L.; Li, X.; Ji, R.; Teng, K. S.; Tai, G.; Ye, J.; Wei, C.; Lau, S. P.
J. Mater. Chem.2012,22, 5676–5683.
24 Erickson, K.; Erni, R.; Lee, Z.; Alem, N.; Gannett, W.; Zettl, A.Adv.
Mater.2010,22, 4467–4472.
25 Paci, J., T.; Belytschko, T.; Schatz, G. C.J. Phys. Chem. C2007,111, 18099–18111.
26 Pacile, D.; Meyer, J. C.; Rodrıguez, A. F.; Papagno, M.; Gomez- Navarro, C.; Sundaram, R. S.; Burghard, M.; Kern, K.; Carbone, C.; Kaiser, U.
Carbon2011,49, 966–972.
27 Ferrari, A. C.; Meyer, J. C.; Scardaci, V.; Casiraghi, C.; Lazzeri, M.;
Mauri, F.; Piscanec, S.; Jiang, D.; Novoselov, K. S.; Roth, S.; et al.Phys. Rev.
Lett.2006,97, 187401-1–187401-4.
28 Malarda, L. M.; Pimentaa, M. A.; Dresselhaus, G.; Dresselhaus, M. S.
Phys. Reports2009,473, 51–87.
29 Castro, N. A. H.; Guinea, F.Phys. Rev. B2007,75, 045404-1–045404-8.
30 Kalbac, M.; Kong, J.; Dresselhaus, M. S.J. Phys. Chem. C2012,116, 19046–19050.
31 Shen, Y.; Lua, A. C.Sci. Rep.2013,3, 1–6.
32 Jawhari, T.; Roid, A.; Casado, J.Carbon1995,33, 1561–1565.
33 Lin, Y.-H.; Yang, C.-Y.; Lin, S.-F.; Lin, G.-R. Opt. Mater. Express, 2016, 236–253.
34 Yoon, D.; Cheong, H.; Raman spectroscopy for characterization of graphene, in:Raman Spectroscopy for Nanomaterials CharacterizationKumar, C. S. S. R., editor, Springer, Berlin, Heidelberg, 2012, pp. 191–214.
35 Naderi, N.; Rasi, S.; Moradi, M.Optik2018,172, 57–62.
36 Badrinezhad, L.; Ghasemi, S.; Azizian-Kalandaragh, Y.; Nematollahzadeh, A.Polym. Bull.2018,75, 469–484.
37 Aparna, R.; Sivakumar, N.; Balakrishnan, A.; Sreekumar Nair, A.; Nair, S. V.; Subramaniana, K. R. V.J. Renew. Sustain. Ener.2013,5, 033123 1–11.
38 Alam, S. N.; Sharma, N.; Kumar, L.Graphene2017,6, 1–18.
39 Lee, J.; Shim, S.; Kim, B.; Shin, H. S.Chemistry2011,17, 2381–2387.
40 Gluba, M. A.; Amkreutz, D.; Troppenz, G. V.; Rappich, J.; Nickel, N. H.Appl. Phys. Lett.2013,103, 073102.
41 Perumbilavil, S.; Sankar, P.; Priya Rose, T.; Philip, R.Appl. Phys. Lett.
2015,107, 051104.
42 Nan, H. Y.; Ni, Z. H.; Wang, J.; Zafar, Z.; Shi, Z. X.; Wang, Y. Y.
J. Raman Spectrosc.2013,44, 1018–1021.