Anita Pelle – Gabriella Tabajdi
Research and Development in the EU Member states’ performance in R&D&I
Basic indicators
Lecture 9
This teaching material has been made at the University of Szeged, and supported by the European Union.
Project ID: EFOP-3.4.3-16-2016-00014
University of Szeged
6720 Szeged, Dugonics tér 13.Hungary www.u-szeged.hu
www.szechenyi2020.hu
Member states’ performance in R&D&I Basic indicators
Lecture 9
In this lecture you will learn about:
− The EU’s performance regarding R&D
− Member states’ performance in R&D
− Different indicators (and interesting ones too) to measure R&D performance and member states’ performance
The EU’s and member states performance in R&D
Before going into details, to understand this lecture, we have to repeat the information we learned in Lecture 1 and Lecture 7. We need Lecture 1 to understand what different indicators measure and we need Lecture 7 to understand better the R&D performance of the EU. First, we go through the definitions of the indicators we use in this lecture part of which were already covered in Lecture 1.
Gross domestic expenditure on R&D (GERD) includes expenditure on research and development by business enterprises, higher education institutions, as well as government and private non-profit organisations (Eurostat).
Research and development (R&D) intensity for a country is defined as the R&D expenditure as a percentage of gross domestic product (GDP) (Eurostat).
Research and development expenditure composition by sectors of performance: this measures the R&D expenditure of different sectors as a % of GDP. The different sectors include: Business enterprise sector, Government sector, Higher education sector and Private non-profit sector (Eurostat).
Total researchers – head count: “Researchers are professionals engaged in the conception or creation of new knowledge, products, processes, methods and systems, and in the management of the projects concerned. Head count (HC) data measure the total number of researchers who are mainly or partly employed on R&D” (Eurostat).
Share of women researchers shows the share of women in researchers who are working full-time in R&D (Eurostat).
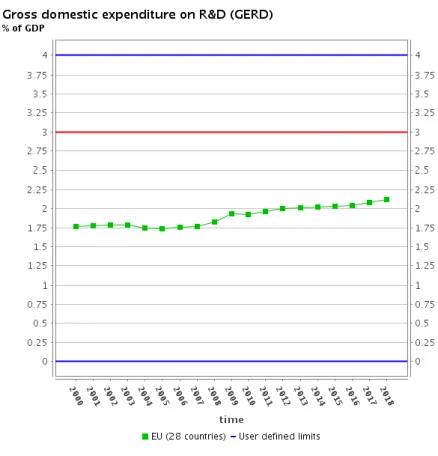
To understand better how the EU as a whole and different member states are doing in R&D, we have to remember what we learned in Lecture 7. The Europe 2020 strategy, a 10 year growth plan for the EU has a specific target regarding R&D, namely that 3% of the EU’s GDP should be spent on research and development. To see how the EU is doing1, check Figure 1.
Figure 1. Gross expenditure on R&D, % of GDP (2000-2018)
Source: Eurostat
1 This data contains the United Kingdom, so it is for the EU28.
From Figure 1, we can see that between 2000 and 2018 there was progress in the expenditure on R&D, yet it is rather moderate. GERD grew from 1.77% of the GDP in 2000 to 2.19% of GDP in 2018. It is striking that much of the progress occurred during the global economic and financial crisis of 2008-09 which was then followed by a more moderate increase. This is, evidently, partly can be explained by the fallback in GDP, the denominator, due to the crisis.
However, another interpretation can be that member states made obvious efforts to exit the crisis by at least keeping the nominal expenditures in favour of the knowledge-based and innovation-driven economy.
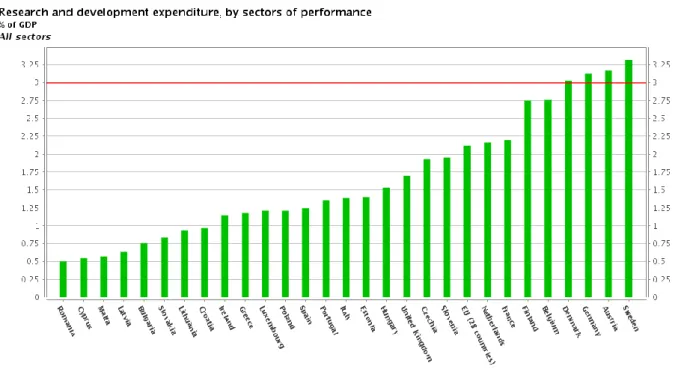
However, the member states contribute to this overall performance to very different extents.
In 2018, Sweden ranked first with 3.32% while the respective indicator was 0.5% for Romania (Figure 2). There is an obviously huge gap in Europe regarding R&D expenditures. Two years prior to the deadline for reaching the 3% goal, only four countries (Sweden, Austria, Germany and Denmark) performance exceeded this threshold. While on the other hand eight member states (Romania, Cyprus, Malta, Latvia, Bulgaria, Slovakia, Lithuania and Croatia) did not even reach the 1% value of the respective indicator. All these countries belong to the group of new member states joining in and after 2004.
Figure 2. R&D expenditure by countries, % of GDP (in 2018)
Source: Eurostat
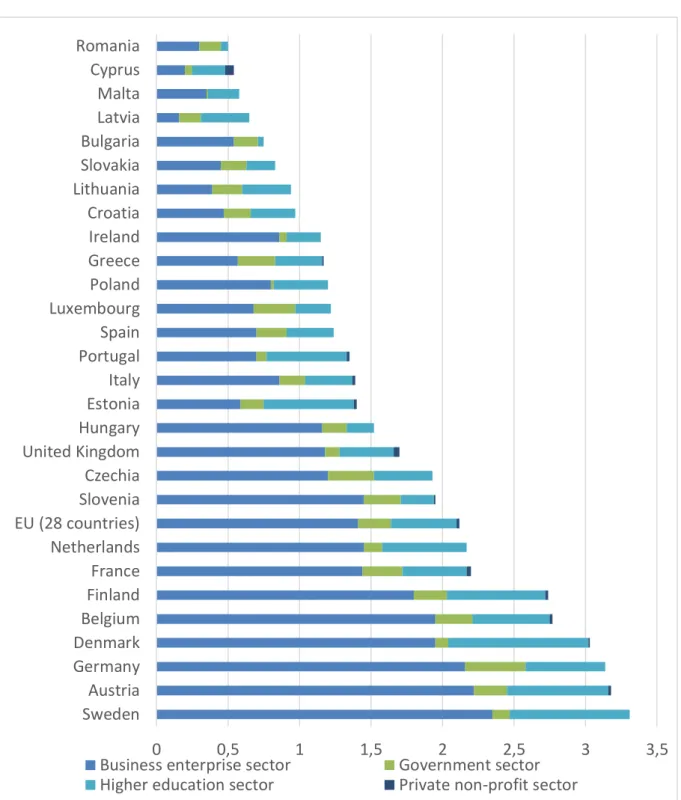
Figure 3 EU member states’ expenditure on R&D according to sectors of performance in % of GDP (in 2018)
Source: own construction based on data from Eurostat
Figure 3 shows EU member states’ 2018 expenditure on R&D according to sectors of performance. Without any deeper analysis, we can make the following statements:
0 0,5 1 1,5 2 2,5 3 3,5
Sweden Austria Germany Denmark Belgium Finland France Netherlands EU (28 countries) Slovenia Czechia United Kingdom Hungary Estonia Italy Portugal Spain Luxembourg Poland Greece Ireland Croatia Lithuania Slovakia Bulgaria Latvia Malta Cyprus Romania
Business enterprise sector Government sector Higher education sector Private non-profit sector
• The business sector has the biggest role in financing R&D in every member state
• In the best performing countries, the business and higher education sectors provide most of the funding
• Higher education’s participation in financing R&D is very low in Romania (0.05%) and Bulgaria (0.04) while on the other hand it is very high in Sweden and Denmark but some of the new member states (Estonia and Latvia) have also high values
• The 2004, 2007 and 2013 new member states’ positions range from 9th (Slovenia, 1.95%) to 27th (Romania, 0.5%). Nevertheless, the majority of them can be found in the second half of the list.
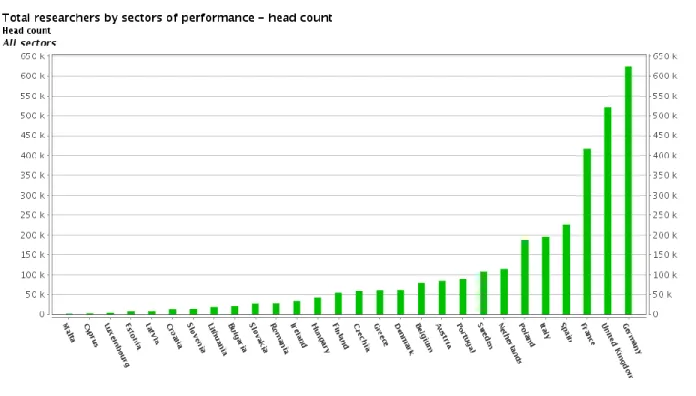
Besides checking the main indicators describing countries R&D performance, it can be useful and interesting to check also how much people are working in research and development (Figure 4) and the share of women researchers (Figure 5).
Figure 4 The number of total researchers in the member states (in 2017)
Source: Eurostat
Regarding the number of researchers, it is not surprising that those countries have higher numbers where the number of population is also high. If we check the researchers’ share in population we get that despite the high number for Germany it means 0.04%, for the United Kingdom 0.08% or for France 0.2%. While on the other hand, despite the smaller number of researchers, in some countries their share in total population is higher than in Germany or in
France. In Luxembourg the share of researchers in the total population is 19.5%, in Slovakia 9.6% or in Czechia 5.8%, in Slovenia 5.1%. It is quite interesting that especially in the Central and Eastern European countries, in spite of the smaller amount spent on R&D, the share of researchers is relatively high compared to bigger and more advanced economies.
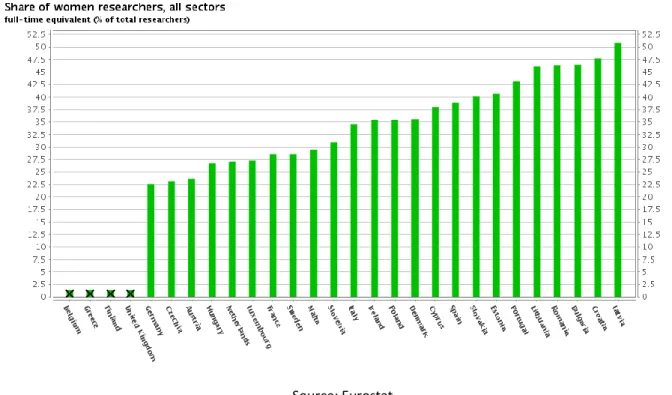
Figure 5 The share of women researchers as % of total researchers in the member states (in 2017)
Source: Eurostat
The share of women researchers as % of total researchers is relatively high in some Eastern and Southern countries, in Latvia more women work in research than men. While for the more advanced countries women’s share is less than 30%. For the countries that data is available Germany performs the last one, in Germany only 22.5% of researchers are women.
Questions for self-study
− What is the main indicator of countries performance in R&D&I?
− How is the EU performing in this respect? And the member states?
References:
Eurostat Statistic Explained main website: http://ec.europa.eu/eurostat/statistics- explained/index.php/Main_Page
Eurostat R&D main indicators website: https://ec.europa.eu/eurostat/web/science- technology-innovation/data/main-tables