https://doi.org/10.1051/0004-6361/201834106 c
ESO 2018
Astronomy
&
Astrophysics
Eclipsing spotted giant star with K2 and historical photometry ?
K. Oláh1, S. Rappaport2, T. Borkovits3,1, T. Jacobs4, D. Latham5, A. Bieryla5, I. B. Bíró3, J. Bartus1,6, Zs. K˝ovári1, K. Vida1, A. Vanderburg7,??, D. LaCourse8, I. Csányi3, G. Á. Bakos9,10,???, W. Bhatti9, Z. Csubry9,
J. Hartman9, and M. Omohundro11
1 Konkoly Observatory, Research Centre for Astronomy and Earth Sciences, Hungarian Academy of Sciences, Konkoly Thege M. u. 15-17, 1121 Budapest, Hungary
e-mail:olah@konkoly.hu
2 Department of Physics, and Kavli Institute for Astrophysics and Space Research, Massachusetts Institute of Technology, Cambridge, MA 02139, USA
3 Baja Astronomical Observatory of Szeged University, Szegediút Kt. 766, 6500 Baja, Hungary
4 Amateur Astronomer, 12812 SE 69th Place, Bellevue, WA 98006, USA
5 Harvard-Smithsonian Center for Astrophysics, Cambridge, MA 02138, USA
6 Leibniz-Institute for Astrophysics Potsdam (AIP), An der Sternwarte 16, 14482 Potsdam, Germany
7 Department of Astronomy, The University of Texas at Austin, NASA Sagan Fellow, 2515 Speedway, Stop C1400, Austin, TX 78712, USA
8 Amateur Astronomer, 7507 52nd Place NE, Marysville, WA 98270, USA
9 Department of Astrophysical Sciences, Princeton University, Princeton, USA
10 MTA Distinguished Guest Fellow, Konkoly Observatory, Budapest, Hungary
11 Citizen Scientist, c/o Zooniverse, Department of Physics, University of Oxford, Denys Wilkinson Building, Keble Road, Oxford OX1 3RH, UK
Received 18 August 2018/Accepted 7 October 2018
ABSTRACT
Context.Stars can maintain their observable magnetic activity from the pre-main sequence (PMS) to the tip of the red giant branch.
However, the number of known active giants is much lower than active stars on the main sequence (MS) since the stars spend only about 10% of their MS lifetime on the giant branch. Due to their rapid evolution it is difficult to estimate the stellar parameters of giant stars. A possibility for obtaining more reliable stellar parameters for an active giant arises when it is a member of an eclipsing binary system.
Aims. We have discovered EPIC 211759736, an active spotted giant star in an eclipsing binary system during the Kepler K2 Campaign 5. The eclipsing nature allows us to much better constrain the stellar parameters than in most cases of active giant stars.
Methods.We have combined the K2 data with archival HATNet, ASAS, and DASCH photometry, new spectroscopic radial velocity measurements, and a set of follow-up ground-basedBVRCICphotometric observations, to find the binary system parameters as well as robust spot models for the giant at two different epochs.
Results.We determined the physical parameters of both stellar components and provide a description of the rotational and long- term activity of the primary component. The temperatures and luminosities of both components were examined in the context of the Hertzsprung–Russell diagram. We find that both the primary and the secondary components deviate from the evolutionary tracks corresponding to their masses in the sense that the stars appear in the diagram at lower masses than their true masses.
Conclusions.We further evaluate the proposition that traditional methods generally result in higher masses for active giants than what is indicated by stellar evolution tracks in the HR diagram. A possible reason for this discrepancy could be a strong magnetic field, since we see greater differences in more active stars.
Key words. stars: activity – binaries: eclipsing – stars: evolution – stars: late-type – starspots – stars: fundamental parameters
1. Introduction
Stars can maintain their observable magnetic activity from the pre-main sequence (PMS) until the tip of the red giant branch (RGB). We define an active star as one for which we can infer from observations surface spots due to variable magnetic fields.
Observable activity develops in those stars where there are extra circumstances to strengthen the magnetic field, such as rapid ro- tation, for example, which is maintained in binary stars via tidal synchronization.
? Data presented in this paper are based on observations obtained at the HAT station at the Submillimeter Array of SAO, and the HAT station at theFred Lawrence WhippleObservatory of SAO.
?? NASA Sagan Fellow.
??? Packard Fellow.
Strong magnetic fields have already been directly observed from Stokes vectors in many active stars (Reiners et al. 2012).
In the case of PMS stars, it is known that the strong mag- netic fields can suppress the convection in the spotted re- gions and alter the entire stellar atmosphere, which in turn makes the derived physical parameters of the stars uncertain (Bouvier & Bertout 1989). Having similar rotation rates, red giant stars with deep convection zones can also possess sur- face magnetic fields maintained by the magnetic dynamo. There- fore, their atmospheric structure can also be altered by the strong magnetic fields making their astrophysical parameters more uncertain (seeOláh et al. 2014). In the case of large spot- ted areas, the observed temperature is lower and the result- ing masses and ages inferred from their location on evolution tracks can be quite inaccurate. This is why observing an active
giant star in an eclipsing binary is of great value, since this makes it possible to determine the stellar masses independently.
By now, direct evidence – that is, an interferometric map – shows that the atmospheres of active giants can be covered with dark and bright features of possibly magnetic origin (for further details seeRoettenbacher et al. 2016).
The number of known active giants is much lower than active stars on the MS since on the giant branch the stars evolve rapidly, spending only about 10% of their MS lifetime there. This is sup- ported by the results ofVan Doorsselaere et al.(2017) who stud- ied a sample ofKeplerstars searching for flares, where 10% of them were giants among the group of F+G+K+M+giant stars.
Of the giant stars, 3.18% show flares, a clear sign of magnetic activity. The occurrence rate for flaring among giants is similar to their progenitor F and G stars on the MS (2.37% and 2.96%, respectively), whereas K+M stars have twice as high an occur- rence rate for flaring of 5.87%.
Due to their rapid evolution it is difficult to estimate the stel- lar parameters of giant stars. A possibility for obtaining more reliable stellar parameters for an active giant arises when it is a member of an eclipsing binary system. Although a signifi- cant number of active stars are found in eclipsing binaries, most of those are MS stars or subgiants. Only about a dozen well- studied systems have a giant star as an active component, but currently the only well-studied active giant star that is the pri- mary of an eclipsing binary is BE Psc. This star was studied in detail byStrassmeier et al.(2008) using photometry spanning 19 years, and 61 high-resolution spectra. However, it is a lucky case, since the two components have fairly similar masses (1.56 and 1.31M); one star is a giant already and the other is just leaving the MS (temperatures are 4500 K and 6300 K). Therefore, one eclipse is deep, more than 0.15 mag, but the other eclipse was more difficult to find. Even the deep eclipse was recognized later than the discovery of the light variations of the star.
In the cases of solar size, subsolar, or red-dwarf secondaries the eclipses (if they exist at all due to the inclination of the orbit) are increasingly more shallow. A shallow eclipse in a long- period light curve (such as those of the active giants with pe- riods of tens of days) can last from several hours to days, and can be easily missed in ground-based data due to photometric uncertainties. Another, very important factor is that these stars are usually observed once a night with ground-based telescopes due to their long rotation periods. Even those surveys that ob- serve a stellar field regularly and have many data points can fail to detect shallow eclipses.
The long-cadence Kepler data have a photometric preci- sion per sample below millimagnitudes, and therefore shallow eclipses of red giants in binary systems can be more readily rec- ognized. Excellent examples are given inGaulme et al.(2016) for 16 eclipsing systems with red giant (or subgiant) stars using Kepler photometry, together with high-resolution spectroscopy aimed at testing how the asteroseismic scaling relations agree with those derived from dynamical modeling. The observed eclipses make it possible to determine the stellar parameters. The depths of the observed eclipses are typically a few hundredths (between 0.01 and 0.05) of a magnitude, and only in 2 cases out of 16 binaries does the eclipse depth exceed 0.1 magnitudes. In addition, half of the studied systems have longer periods than 100 days. Apart from their genuine rareness arising from the rapid evolution of these stars, all this evidence suggests that the main reason for not observing more eclipsing active giants is the quality and quantity of the ground-based observations.
Stellar activity, which can be seen in the data themselves and in the residuals from the model fits, is detected in only 8 of the 16
systems (see Fig. 3. ofGaulme et al. 2016). Combining the re- sults of Table 1 fromGaulme et al.(2014), and Fig. 3 and Table 4 ofGaulme et al.(2016), we find eight systems with a total out- of-eclipse flux variability of over 1%. The higher-amplitude ro- tationally modulated light curves in four primaries among the active giants, having over 15% peak-to-peak flux variability, be- long to the fastest rotators (Prot . 41 days) of the sample; the rotational modulation periods are given inGaulme et al.(2014).
For these four primaries no solar-likep-mode oscillations were detected, probably because of suppression by stellar activity (for more discussion seeGaulme et al. 2014).
Three very active giants in non-eclipsing binary systems (IL Hya, XX Tri and DM UMa) were studied by Oláh et al.
(2014) using decades-long photometry, all of which show long- term variability with an amplitude of about a magnitude. It was found that the derived luminosities were so low that it was im- possible to get reliable ages for the systems from evolutionary tracks. This difficulty was further exacerbated due to the high magnetic activity which prevented (Oláh et al. 2014) from get- ting accurate stellar parameters. One may speculate that in the case of XX Tri, the very-high-amplitude rotational modulation indicates a relatively high inclination angle, and additionally, since the secondary star is not seen in the spectra, it is very likely to be a dwarf star. Therefore, even if the geometry were favor- able, the eclipses would not have been observed due to the very large luminosity difference in the two stars, leaving us with an uncertain orbital inclination.
This paper reports an active red giant star, EPIC 211759736, in a doubly eclipsing binary found in Campaign 5 (GO 5069, 2015) and re-observed in Campaign 18 (GO 19033, 2018) of the KeplerK2 program (Huber et al. 2016). The star appears first inSchmidt et al.(2009) as a Cepheid variable based on ASAS measurements with a period of 36.31 days, and in the same year in Hoffman et al. (2009) as a long-period variable (Cepheid or Mira) based on NSVS data with a period of 34.483 days.
These variable-star classifications were, however, incorrect. The large-amplitude long-period modulations turn out to be due to starspots on a slowly rotating star.
The eclipsing nature of the active red giant EPIC 211759736 should allow us to much better constrain the stellar parameters than in most cases of active giant stars. The binary solution is supported by new spectroscopic data. Follow-up ground-based BVRCICphotometry was also obtained covering one stellar rota- tion. We make use of archival observations by ASAS (Pojmanski et al. 1997) and by HATNet (Bakos et al. 2004;Bakos 2018), and also the DASCH database (Grindlay et al. 2009) which has ap- proximately 900 photographic measurements of brightness span- ning about 100 years. We note that in theGaulme et al.(2016) sample of 16 eclipsing giants in theKeplerfield, only one star has supplemental ASAS data and none was found in the DASCH historical database.
EPIC 211759736 =2MASS 08151296+1644414 has J, H, and K magnitudes of 9.516±0.022, 8.921±0.016 and 8.766± 0.018 mag, respectively (Skrutskie et al. 2006), and WISE W1, W2, W3, and W4 magnitudes of 8.686±0.022, 8.743±0.019, 8.631± 0.025 and&8.197, respectively (the AllWise catalog;
Wright et al. 2010).
GaiaDR2 puts the star at a distance of 1368+−6977pc, and gives the following parameters: radial velocity is 40.6 ±4.8 km s−1 (we note thatGaiaDR2 treats single-lined binaries as one star), Teff=4747±200 K,R=11.0±1R,L=55±4L.
The paper is structured as follows: Sect.2describes the ob- servational data; Sect.3 presents the results from photometry;
Sect. 4 deals with the binary solution and the results of spot
modeling; Sect.5discusses the results; and Sect.6gives a sum- mary, and conclusion.
2. Applied data
2.1. Archival photometric data
EPIC 211759736 has a photometric record of∼100 years in the DASCH database (Grindlay et al. 2009) from scanned photo- graphic plates taken between 1888 and 1989, thereby allowing us to check the cyclic nature of the active giant.
From the public All Sky Automated Survey (ASAS) database (Pojmanski et al. 1997) a seven-year-long dataset mea- sured in theV-band, was downloaded and analyzed. The ASAS project automatically monitors the entire sky with wide-field in- struments targeting all stars brighter than 14 magnitudes, search- ing for and following photometric variability.
Data for the star EPIC 211759736 were obtained with the Hungarian-made Automated Telescope Network (HATNet;
Bakos et al. 2004; Bakos 2018), using the HAT-5 and HAT- 10 telescopes at theFred Lawrence WhippleObservatory, Ari- zona, and the HAT-8 telescope at the Smithsonian Astrophysi- cal Observatory’s Mauna Kea site in Hawaii. Altogether, over 15 000 data points were obtained between Nov. 21, 2008, and January 17, 2012, in the Sloan r filter. Data were reduced to light curves as described in Bakos et al.(2010), for example.
We used the “magnitude fitted” values, which correct for any smooth flux changes across the field and as a function of time (e.g., due to extinction or focus changes), with respect to a se- lected reference frame. We did not use the decorrelated or trend- filtered magnitude values in the light curves as such methods can potentially distort the light-curve shape for variable stars (unless done in a signal reconstruction mode, which was not available).
2.2. New BV RCICobservations
BVRCIC observations of EPIC 211759736 were made with the 0.5 m telescope of Baja Observatory of the University of Szeged, located at Baja, Hungary, and equipped with an SBIG ST-6303 CCD detector. The target was observed on 20 nights between March 13 and May 19, 2018, covering almost two orbital pe- riods; however, gaps induced by weather conditions effectively limited the coverage to one orbital period only. The usual data re- duction and photometric analysis were performed using IRAF1 routines in a PyRAF2environment. Nearby Landolt photometric standard fields SA-26, -29, and -32 (Landolt 2013) were also ob- served on nights with appropriate photometric quality, and were used for determining standard magnitudes of a set of stars in the field of the target. These in turn were used to obtain standard magnitudes of the target itself for all dates. The data were cor- rected for interstellar reddening using the maps of Schlafly &
Finkbeiner(2011). Table1lists theBVRCICobservations.
2.3. K2 observations
After the Kepler main mission, the Kepler spacecraft was re- purposed to observe a set of fields along the ecliptic plane. Each
1 IRAF is distributed by the National Optical Astronomy Observato- ries, which are operated by the Association of Universities for Research in Astronomy, Inc., under cooperative agreement with the National Sci- ence Foundation.
2 PyRAF is a product of the Space Telescope Science Institute, which is operated by AURA for NASA.
KeplerK2 campaign typically monitors some 25 000 stars in a given field for about 80 days (Howell et al. 2014), and a similar precision to that of the originalKeplermission is often achieved (see, e.g., Vanderburg et al. 2016). EPIC 211759736 was ob- served during Campaign 5 (“C5”) from April 28 to July 10, 2015.
The light curves were extracted from theKepler pipeline cal- ibrated target pixel files from the Mikulski Archive for Space Telescopes3. The data were corrected for the K2 spacecraft- motion induced systematics following the approach described in Vanderburg & Johnson (2014) and Vanderburg et al. (2016).
We also utilized the raw data of the very recent 2018 K2Kepler observations of the star (Campaign 18; “C18”).
In addition to systematic searches for periodic events, for example, planetary transits, binary eclipses, and stellar pulsa- tions, a number of Citizen Scientist groups visually inspect all the light curves by eye in search of aperiodic phenomena and/or events of an unusual nature that might well escape the system- atic searches. Such was the case here when two of us (T. J. and D. L.), usingLcTools(Kipping et al. 2015), found two pairs of shallow eclipses in the light curve of the highly modulated giant star EPIC 211759736.
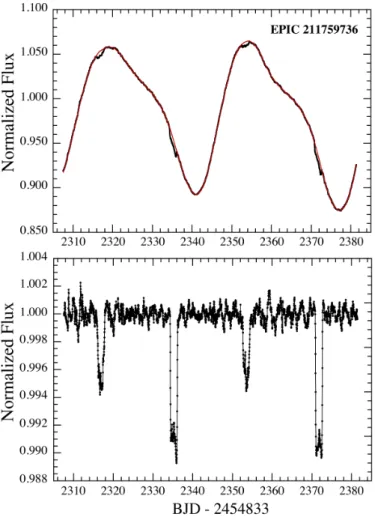
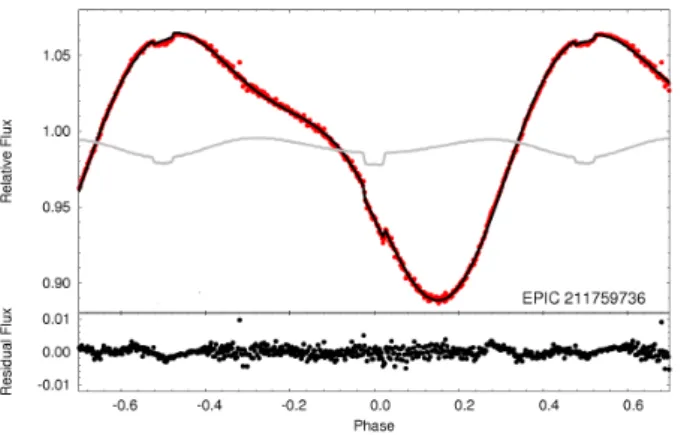
This K2 light curve for EPIC 211759736 is shown in Fig. 1. The top panel is the raw K2 light curve along with a spline fit to indicate the smoothly varying starspot modula- tions. The bottom panel shows the difference between the data and the fit, thereby clearly revealing the primary and secondary eclipses. The deeper eclipses are the giant passing in front of the higher-temperature, that is, higher-surface-brightness, but much smaller, secondary star. The more shallow eclipses by con- trast, occur when the smaller secondary star passes in front of the cooler giant and traces out the limb-darkened profile of the giant.
2.4. Spectroscopic data
We observed EP211759736 with the Tillinghast Reflector Echelle Spectrograph (TRES; F˝urész et al. 2008) on the 1.5 m Tillinghast Reflector telescope at the Fred Lawrence Whipple Observatory (FLWO) on Mt. Hopkins, Arizona. TRES has a spectral range of 3900–9100 Angstroms and a resolving power ofR ' 44 000. The spectra were reduced and extracted as de- scribed inBuchhave et al.(2010).
We obtained ten radial velocity observations between UT 2018 February 04 and 2018 March 22. The spectra had an aver- age signal-to-noise ratio (S/N) per resolution element (SNRe) of
∼30 at the peak continuum near the Mg b triplet at 519 nm with exposure times averaging 1200 s. A multi-order velocity analy- sis was performed by cross-correlating the spectra, order by or- der, against the observation with the strongest SNRe as a tem- plate. Twenty-two orders were used, excluding low-S/N orders in the blue part of the spectrum and some red orders with telluric fringing.
The Stellar Parameter Classification (SPC;
Buchhave et al. 2012) tool was used to derive the stellar parameters of the giant. The SPCcross correlates the observed spectra against a library of synthetic spectra based on Kurucz model atmospheres (Kurucz 1992). We calculated the weighted average of the parameters taking into account the cross correla- tion function peak height. Our results are fully consistent with those given in the EPIC input catalog (Huber et al. 2016).
3 MAST;https://archive.stsci.edu/
Table 1.Log ofBVRCICobservations of EPIC 21175936.
HJD B ± V ± RC ± IC ±
[2 400 000+] mag mag mag mag
58190.4475 12.574 0.010 11.646 0.005 11.100 0.004 10.444 0.003 58191.3205 12.567 0.010 11.654 0.014 11.108 0.016 10.442 0.028 58211.3385 12.596 0.023 11.635 0.008 11.088 0.002 10.438 0.003 58213.4545 12.436 0.025 11.561 0.013 11.022 0.008 10.383 0.014 58217.3445 12.407 0.006 11.492 0.004 10.964 0.008 10.333 0.009 58220.3445 12.472 0.017 11.555 0.005 11.023 0.007 10.382 0.009 58221.3395 12.496 0.015 11.583 0.008 11.041 0.010 10.412 0.027 58222.3345 12.525 0.006 11.609 0.001 11.068 0.004 10.415 0.011 58227.3405 12.553 0.011 11.628 0.003 11.090 0.006 10.434 0.013 58228.3265 12.524 0.024 11.614 0.013 11.068 0.004 10.419 0.035 58229.3295 12.514 0.006 11.589 0.003 11.048 0.005 10.401 0.005 58230.3215 12.501 0.009 11.554 0.008 11.023 0.008 10.385 0.006 58232.3425 12.425 0.023 11.534 0.003 11.017 0.025 10.363 0.015 58233.3445 12.411 0.050 11.505 0.001 10.978 0.005 10.380 0.015 58234.3325 12.443 0.018 11.532 0.009 10.987 0.001 10.372 0.010 58236.3095 12.464 0.017 11.533 0.010 11.000 0.001 10.367 0.001 58246.3395 12.608 0.004 11.661 0.005 11.110 0.005 10.452 0.004 58247.3305 12.562 0.045 11.632 0.008 11.083 0.013 10.454 0.020 58250.3355 12.430 0.006 11.535 0.009 11.004 0.009 10.360 0.017 58251.3505 12.367 0.018 11.487 0.019 10.968 0.002 10.339 0.016 Notes.Carried out at the Baja Observatory of the University of Szeged.
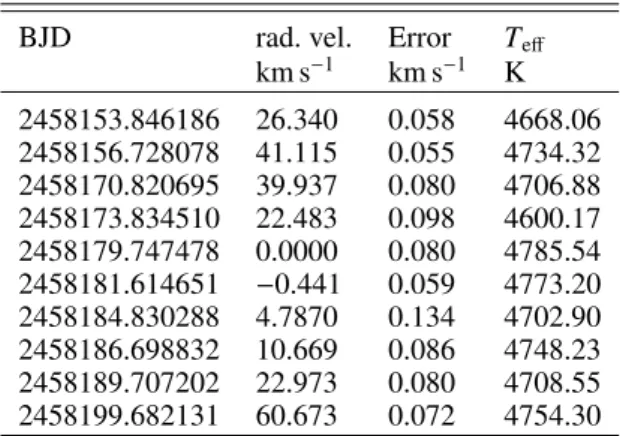
Table 2.Radial velocity measurements of EPIC 211759736.
BJD rad. vel. Error Teff
km s−1 km s−1 K 2458153.846186 26.340 0.058 4668.06 2458156.728078 41.115 0.055 4734.32 2458170.820695 39.937 0.080 4706.88 2458173.834510 22.483 0.098 4600.17 2458179.747478 0.0000 0.080 4785.54 2458181.614651 −0.441 0.059 4773.20 2458184.830288 4.7870 0.134 4702.90 2458186.698832 10.669 0.086 4748.23 2458189.707202 22.973 0.080 4708.55 2458199.682131 60.673 0.072 4754.30
3. Results
3.1. Long-term variations?
The long-term (∼100 years) photometric history of EPIC 211759736 from the DASCH archival data (Grindlay et al. 2009) is shown in Fig.2. The historic photometry record shows hints of long-term changes possibly due to variations in general spottedness, that is, an activity cycle. This can be seen in Fig.2 where a change on a timescale of a few decades (≈40 yr) is indicated by the solid curve drawn by the beating of two close periods. Another, weaker signal with a possible 7–8 years cycle time is also found. For comparison, the bottom panel of Fig.2shows the DASCH photometry of theδSct-type star GP Cnc, with low amplitude light variation (below 0.1 mag;
Wetterer et al. 1998) and without long-term changes in its mean magnitude. GP Cnc is very close to EPIC 211759736 on the sky, which rules out systematics in the long-term photographic-plate records of our object.
3.2. Rotational periods and differential rotation
We extracted rotational periods from the data with the multiple- frequency analysis toolMuFrAn(Csubry & Kolláth 1990). The rotational period of the star is fairly long (about 10 rota- tions/year), therefore one ground-based observing season covers only a few (6–8) rotations. Therefore, more than one season of observations is advisable to obtain a well-determined rota- tion period. But the period is expected to change due to the anticipated differential rotation and the possible appearance- dissolution and movement of the spots. Therefore, time-spans longer than 2 years should not be used to derive rotational pe- riods, since this is the timescale on which the light variation is stable, that is, the phases of the extrema of the light curve do not change appreciably.
The Fourier transform (FT) of the 100 years of DASCH pho- tometric data for EPIC 211759736 is shown in Fig.3. The top two panels show the FT down to periods as short as 25 days, and a zoom-in on the lower-frequency portion of the spectrum, respectively. Not much evidence for the 36 day rotation period is seen. However, after removing the long-term variation from the dataset, we find a group of weak peaks near periods around 36 days, indicating that the rotational signal of the giant is indeed present in the historical data; see Fig.3.
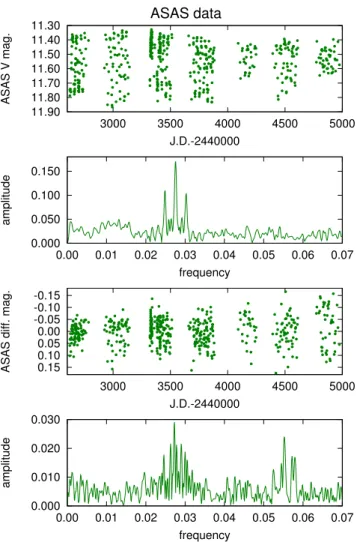
We did a period search of the entire seven-year-long ASAS dataset (Pojmanski et al. 1997). The raw ASAS light curve is plotted in the top panel of Fig.4. The rotational period for all the data is 36.27 days (second panel of the figure). After remov- ing this signal, the difference light curve (third panel of Fig.4) shows an increased amplitude during the last three years relative to the previous ones, and the half period appears in the Fourier amplitude spectrum (fourth panel). This indicates that the light curve was sinusoidal during the first 4 years, but from 2006 on- ward the light curves became asymmetric and the half period appeared significantly with about one third of the amplitude of the fundamental period, suggesting two well-separated active
Fig. 1.K2 light curve of EPIC 211759736 spanning 75 days.Top panel:
black curve is the raw light curve, while the thin red curve is a spline- smoothed version.Bottom panel: difference between the black and red curves in the top panel, showing more clearly both the primary and secondary eclipses. We highlight the difference in vertical scale by a factor of∼15. The eclipse depths are at most 5% of the full amplitude (≈0.2 mag) of the light variations.
regions on the stellar surface. Additionally, in the case of both the ASAS and HAT surveys we used one or two seasons of data to derive independent periods for different epochs. We list the rotational periods in Table3at different epochs found from the ASAS and HAT surveys. The seventh year of the ASAS data and the first year of the HAT data (2008–2009) cover nearly the same time interval, and the consistency of the results demonstrates the reliability of the derived periods. The resulting rotational periods of these overlapping observations are within their mutual uncer- tainties.
We plotted all the photometric data, folded with the orbital period (see footnote to Table3), in Fig. 5. This is the only re- liable and completely coherent period in the system, and differs from the rotational period by only about 0.2 days, with the orbital period being longer.
3.3. Star spots and spot temperatures from BV RCICdata There are only two active giant stars,ζAnd andσGem, which have already been directly mapped using interferometry and found to exhibit large-scale magnetic structures on their sur- faces (see Roettenbacher et al. 2016, 2017). By contrast, the starlight we observe from EPIC 211759736 comes from a point source, and only approximate inferences can be made about the
12.00 12.20 12.40 12.60 12.80 13.00 13.20 13.40 13.60
DASCH mag.
EPIC 211759736
11.00 11.20 11.40 11.60 11.80 12.00 12.20 12.40 12.60 12.80
10000 20000 30000 40000
DASCH mag.
J.D.-2400000 GP Cnc
Fig. 2.Top panel: long-term photometric variations based on scanned photographic plates of EPIC 211759736 from the DASCH database.
Data are fitted with the possible decades-long cyclic changes of the star.
Bottom panel: for comparison, DASCH magnitudes of the nearbyδSct- type star GP Cnc, which is not expected to change its mean brightness.
The two light curves are plotted to the same magnitude scale.
starspots’ structure. We know from the Sun that the spots are not uniform (umbra–penumbra) and the larger active regions (in solar terminology “active nests”) contain both dark (cool spots) and bright (hot faculae) areas. On other stars, very probably, we are observing a mixture of these regions with an averaged effec- tive temperature. In the following we use both the terms “spots”
and “active regions” interchangeably, meaning the areas on the stellar surface where the activity is concentrated.
The shape of the photometric variations due to star spots in EPIC 211759736 (see Fig.5) changes relatively slowly. Between 2002 and 2007 the basic light curve shape was nearly sinusoidal and was probably caused by a single dominant region on the sur- face of the giant. If there was more than one region these were likely close to each other in longitude. From 2008 the light curves started to reveal two dominant, presumably detached spotted re- gions, manifested by nonsinusoidal light curves (see Fig.5). By the time of the K2 observations in 2015, a small secondary max- imum appeared showing that the spotted regions had moved far- ther away from each other. The double-humped light variation ob- served inBVRCICcolors and by K2 during 2018, shown in the up- per panel of Fig.6, clearly demonstrates two active regions on the stellar surface with the maximum possible longitude difference of about 180◦between them. The dominant minimum of the light curve drifts slowly from phase 0.6 to phase 0.1 in Fig.5showing that the average rotational period of the star is indeed shorter than the orbital one. In 2018 the light curves had two minima of nearly equal depth and one of those was near phase 0.9, continuing the migration of a long-lasting (from 2002 to date) active region. The observed slow drift of the light curve minima is possibly due to the latitudinal differential rotation (see Table3).
To model the spotted light variations in theBVRCICdataset we used our own software based on the analytical equation ap- plied to spot modeling by Budding (1997), assuming circular spots. Fixed parameters were the effective wavelengths of the
0.00 0.02 0.04 0.06 0.08 0.10 0.12
0.00 0.01 0.02 0.03 0.04
amplitude
EPIC 211759736
0.00 0.02 0.04 0.06 0.08 0.10 0.12
0.000 0.002 0.004 0.006
amplitude
~40 years
~8 years
1 year aliases
0.00 0.01 0.02 0.03 0.04 0.05
0.00 0.01 0.02 0.03 0.04
amplitude
frequency (cycles/day)
~36 days rotation
Fig. 3.Fourier amplitude spectra of EPIC 211759736 from the DASCH dataset.Top panel: Fourier amplitude spectrum.Middle panel: detail of the long-period range of the amplitude spectrum.Bottom panel: weak signals around the 36 day rotational period after removing the long-term trends from the data.
filters used, linear limb darkening coefficients (Howarth 2011) taking into account the stellar parameters, and the unspotted brightness in all bandpasses. We note that there is no way to deduce the true unspotted brightness of an active star showing the usual rotational and long-term light variations. On the other hand, one would expect a higher brightness level and smaller rotational variation with fewer and fewer spots. Therefore, we took the observed maximum magnitude as the unspotted refer- ence brightness level. The rest of the activity is supposed to be distributed evenly and/or remain on the poles. We note that we have observed only two rotations of the star in a standard pho- tometric system, and the archival and K2 data were obtained in different, non-standard bandpasses (except ASAS which has aV magnitude bandpass), and therefore cannot be compared quanti- tatively.
We modeled in parallel theB−V,V−RC,V−ICcolor obser- vations, assuming that there are just two circular starspots. The parallel modeling of each of these colors results in spot coordi- nates (longitudes, latitudes), sizes, and a single spot temperature.
For EPIC 211759736 we have a high rotational inclination angle (81.85◦), and thus the two stellar hemispheres are nearly inter- changeable (supposing that the rotational axis is perpendicular to
11.30 11.40 11.50 11.60 11.70 11.80 11.90
3000 3500 4000 4500 5000
ASAS V mag.
J.D.-2440000
ASAS data
0.000 0.050 0.100 0.150
0.00 0.01 0.02 0.03 0.04 0.05 0.06 0.07
amplitude
frequency -0.15
-0.10 -0.05 0.00 0.05 0.10 0.15
3000 3500 4000 4500 5000
ASAS diff. mag.
J.D.-2440000
0.000 0.010 0.020 0.030
0.00 0.01 0.02 0.03 0.04 0.05 0.06 0.07
amplitude
frequency
Fig. 4.Top two panels: seven-year-long ASAS dataset and its Fourier amplitude spectrum resulting in a rotational period of 36.27 days. The two “satellite peaks” in the amplitude spectrum are the sidebands of the one-year observational window function.Bottom two panels: data
“cleaned” of the rotational period, and its amplitude spectrum. Apart from the remaining signals near the 36 day periods, half periods also show up significantly due to the non-sinusoidal light curves in the sec- ond half of the dataset.
the orbit, the star is seen nearly edge-on), that is, approximately invariant under inversion. Therefore, in the course of the model- ing, the spot latitudes were kept fixed at the equator; generally, it is not possible to obtain reliable spot latitudes from photomet- ric data. In this way we had five free parameters to fit for: two longitudes and sizes, and the spot temperature.
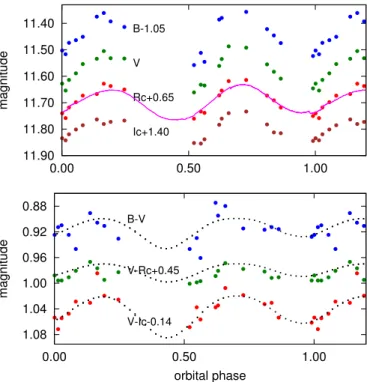
The results show that in early 2018 there were two cool spots (active regions) on the stellar surface, one facing the sec- ondary component and the other on the opposite side, covering altogether about 10% of the total stellar surface, with a tem- perature of 3960 ± 300 K, or about 800 K below the surface temperature of 4750 K. The individual results of the spot tem- perature modeling from the three different color indices are as follows: B −V : 3968 ± 305, V −RC : 3936 ± 364, and V−IC : 3978 ± 215. Although the spot temperatures from the three color indices have substantial uncertainties, their values are remarkably close to each other. The resulting spot longitudes and sizes from the three color indices are within their mu- tual 1-σ uncertainties. The four-color light curves and the fit- ted color indices are plotted in Fig. 6. (We note that experi- ments allowing the spots’ latitudes to also be free parameters gave essentially the same results for the longitudes, sizes, and
11.30 11.40 11.50 11.60 11.70 11.80 11.90
0.00 0.50 1.00
ASAS V mag.
2002-2004
11.30 11.40 11.50 11.60 11.70 11.80 11.90
0.00 0.50 1.00
ASAS V mag.
2004-2006
11.30 11.40 11.50 11.60 11.70 11.80 11.90
0.00 0.50 1.00
ASAS V mag.
2006-2008
10.50 10.60 10.70 10.80 10.90 11.00
0.00 0.50 1.00
HAT mag.
2008-2009
10.50 10.60 10.70 10.80 10.90 11.00
0.00 0.50 1.00
HAT mag.
rotational phase 2010-2011
-0.30 -0.20 -0.10 0.00 0.10 0.20 0.30
0.00 0.50 1.00
Kepler mag.
rotational phase
2010-2011 2015
Fig. 5.Light curves of EPIC 211759736 folded using the time of pri- mary minimum and the orbital period from Table4. ASAS data from 2008–2009 are overplotted with magenta points on the 2006–2008 ASAS light curve. We note that the different flux levels are not real and merely reflect the different observational bandpasses and automated reduction processes (HAT). The deeper minimum is always between phases of about 0.1 and 0.6.
temperature, but with much higher uncertainty due to the error propagation.)
By contrast, the average stellar temperatures from the color indices are as follows: B−V : 5003 ± 48,V −Rc : 4759 ± 39,V −Ic : 4456 ± 36, where the errors are root mean square (rms) values. By comparison, the photospheric temperature from the TRES spectra is 4734 ± 93 K (rms). The three different results from the color indices show the presence of bright, hotter faculae (from B− V), and cool spots (from V −IC), and a combination of these is reflected in the spot tempera- tures. Again, active regions are generally presumed to consist of both hotter and cooler regions than the surrounding quiet photosphere.
4. Binary modeling and spots from K2 data
The accurate, two orbital-period-long K2 photometry made it possible to disentangle the brightness variations arising from the binarity and the spottedness. In order to do this, we first made an orbital phase-folded, binned mean light curve from the K2
Table 3.Observed rotational periods of EPIC 211759736.
Survey JD start–end Years Prota ampl.b
ASAS 52623–53143 2002–2004 36.32 0.21
ASAS 53322–53884 2004–2006 36.39 0.19
ASAS 54092–54612 2006–2008 36.35 0.13
18.11 0.04
ASAS 54774–54975 2008–2009 36.30 0.08
HAT 54792–54971 2008–2009 36.22 0.07
18.11 0.02
HAT 55507–55674 2009–2010 36.40 0.09
18.19 0.03
Average 52623–55674 2002–2010 36.33±0.03 ...
Notes.For comparison:Porb=36.522 days.(a)The uncertainties in the spot-rotation periods are approximately 0.2 days, which means that pe- riods of more than this amount result in noticeable changes in the folded light curve.(b)Fourier amplitude.
11.40 11.50 11.60 11.70 11.80 11.90
0.00 0.50 1.00
magnitude
B-1.05
V
Rc+0.65
Ic+1.40
0.88 0.92 0.96 1.00 1.04 1.08
0.00 0.50 1.00
magnitude
orbital phase B-V
V-Rc+0.45
V-Ic-0.14
Fig. 6. BVRCIC light curves and color indices of EPIC 211759736 folded using the time of primary minimum and the orbital period from Table4. At this epoch a clear double humped light curve is observed.
The magenta curve represents the nearly contemporaneous K2Kepler raw data from C18. The three color indices are fitted with 3960 K spots (dots); see text for details.
data from C5 (see Fig. 7). We then carried out a simultaneous analysis of this folded K2 light curve and the RV curve with our MCMC-based light curve emulator codeLightcurvefactory (Borkovits et al. 2013; Rappaport et al. 2017). Similar to the method described in Borkovits et al. (2018), the light curve variations arising from stellar spots instead of the binarity are simply modeled mathematically by a harmonic function of the form
∆L=
4
X
i=1
aisin(2πfit)+bicos(2πfit), (1) where the four frequencies (f1 = 0.027367 d−1, f2 = 0.054747 d−1, f3 =0.078965 d−1, f4 =0.134952 d−1) represent
Fig. 7.Orbital-phase folded K2 light curve of EPIC 211759736 from C5 (red points), together with the pure eclipsing binary model (gray) and the sum of the eclipsing binary model and the mathematically described photospheric variations (black; see text for details and Eq. (1) in partic- ular).Lower panel: residuals after subtracting the combined light-curve model from the data.
the four highest peaks in the Fourier spectrum of the K2 light curve from C5. The coefficientsaiandbiare calculated via a lin- ear least-squares fit. This function is applied to the residual light curve formed by subtracting the pure eclipsing binary model from the observed light curve, at each step in the MCMC pro- cess. This mathematical model of the residual light curve is then added to the binary model light curve, and the actualχ2value is calculated for this mixed model light curve.
In order to obtain the preliminary, unspotted binary model, the following nine parameters were adjusted.
(i) Five orbital parameters:Porb, eccentricitye, argument of pe- riastronω, inclinationi, time of periastron passageτ;
(ii) Two RV-curve-related parameters: systemic velocity γand spectroscopic mass functionf(m2);
(iii) Two light-curve-related parameters: duration of the transit of the MS secondary component (∆t), and the temperature ratio (T2/T1) of the two components.
The temperature of the giant component was taken from our spectroscopic measurements (via template fitting; see Sect.2.4).
The resulting temperature of 4734±93 K was rounded to 4750 K (Table5). Furthermore, regarding the secondary component, we assumed that it is an unevolved MS star: note the difference between the rounded limb-darkened profile of the secondary eclipse and the sharp ingress and egress of the primary eclipse in Fig. 8. In keeping with this assumption, the mass and the radius of the secondary were calculated internally in the fit- ting code from its effective temperature via the use of the MS T(M) and R(M) relations of Tout et al. (1996). The param- eters we obtained from this fit are listed in Tables 4 and 5, while the RV solution is plotted in Fig.9. These results are in good agreement with the Gaia parameters listed for this sys- tem (Gaia Collaboration 2016,2018) especially the temperature which is essentially the same, but the radius and luminosity val- ues are also within their mutual 2σand 3σ error bars (see the Introduction).
Once we have the basic orbital and stellar parameters de- termined, we can examine the starspots that were present on EPIC 211759736 during the K2 observations. We proceed by subtracting the pure eclipsing binary light curve from the origi- nal K2 light curve (see Fig.10).
In the course of the modeling we took the spot temperature to be that derived from theBVRCICdata (i.e., 3960 K; see Sect.3.3), since theKeplerdata have only one bandpass (∼4500–8500 Å),
Table 4.Orbital elements of EPIC 211759736.
Parameter Value
P(days) 36.522±0.001 T0(BJD) 2457168.181±0.001 τ(HJD) 2457149.82±0.05 a(R) 63.8±1.3
e 0.057±0.003
ω(deg) 269.2±0.5 i(deg) 81.85±0.26 γ(km s−1) 29.74±0.08 K1(km s−1) 30.826 K2(km s−1) 57.257
q 0.54±0.04
Table 5.Parameters of the components of EPIC 211759736.
Parameter Primary Secondary
Temperature, K 4750 (adopted) 5283±154 Radius,R 12.95±0.34 0.82±0.03 Mass,M 1.69±0.12 0.92±0.04 Luminosity,L 77.96±4.19 0.47±0.07 MV, mag 0.45±0.06 5.77±0.15
Gravity logg/g 2.44 4.58
Metallicity −0.27±0.13 –
that is, with basically no color information. First, we assumed two active regions, but since the precision of theKeplerphotometry is very high, we set the spots’ latitudes, longitudes, and sizes as free parameters to be fitted. As another experiment we put four spots on the stellar surface with fixed latitudes: two spots were put at 20◦above the equator, and two spots at−20◦, below the equator, this way allowing for eight free parameters. The fit of the time- series analysis from the four-spot model is shown in Fig.11. The small temporal change of the light curve over the two subsequent rotations can be well understood with small motions and size vari- ations of the assumed circular spots (active regions), probably re- flecting the emergence and decay of smaller spots within the as- sumed circular active regions. The goodness of the fit is seen in the lower panel of Fig.11for the two-spot model (in red color) and the four-spot model (in black) as well.
The formal errors in the fitted spot longitudes for the K2 data are always.1◦, while errors in the spot latitudes (if set as free parameters in the two-spot model) are between 1◦ and 2◦, and the radii are accurate to a few tenths of a degree. As a com- parison, in the case of the ground-based data, the errors in the spot longitudes are about 1◦−2◦, while the spot latitudes are in- definite. Furthermore, using ground-based observations, we find that the spot radii are accurate only to 3◦−4◦ since the fit is not ideal due to the fixed spot latitudes and the much larger observa- tional errors. We note that these errors should be regarded as in- ternal errors of the method, that is, they do not reflect true uncer- tainties in the actual spots since those are not simple circular or steady features. An early paper byK˝ovári & Bartus(1997) gives some good insight into the drawbacks of photometric starspot modeling.
Figure 12shows the locations of the active regions on the giant star’s surface in 2015 and 2018 at the phases of the minima and the quadratures. We note that only the longitudes and sizes of the spots are reliably determined (see above and Sect.3.3), and only the fixed latitude results are displayed.
0.970 0.975 0.980 0.985 0.990
0.96 0.98 1.00 1.02 1.04
K2 residual flux
Eclipses of EPIC 211759736
0.970 0.975 0.980 0.985 0.990
0.46 0.48 0.50 0.52 0.54
K2 residual flux
orbital phase
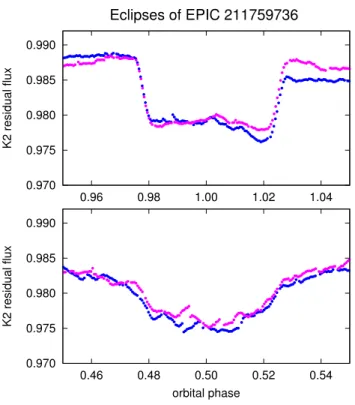
Fig. 8.Two eclipses of EPIC 211759736 from C5, from the first (blue) and second (magenta) rotations with the rotational modulation removed.
Phases were calculated using the time of primary minimum and the or- bital period from Table4.Top panel: primary minimum (giant eclipses secondary),bottom panel: secondary minimum (secondary star transits the giant).
Fig. 9.Radial velocity curve for EPIC 211759736 obtained with the Tillinghast Reflector Echelle Spectrograph (TRES). See Sect.2.4.
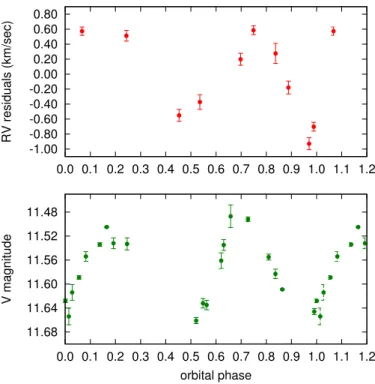
It is interesting to compare the radial velocity residuals with the light variations using the nearly contemporaneous RV and BVRCICphotometry from 2018, since the effects of the spots can alter the radial velocities (referred to as “radial velocity jitter”).
As shown byÖzdarcan et al.(2016, see their Fig. 2.) the radial velocity residuals show the same rotational period as the star, and variations in the light curve are correlated with changes in the jit- ter curve, clearly demonstrating the effect of the spots. Looking at Fig.13we see a similar feature, that is, that the radial velocity jitter of EPIC 211759736 (upper panel) follows a similar pattern and period as the rotational modulation in brightness caused by spots (lower panel). The full jitter amplitude is somewhat high, but strong activity, higherνsini(19.6 km s−1in our case), and lower spectral resolution can all cause higher amplitude jitter. Many im-
0.90 0.95 1.00 1.05
Relative Flux
0.00 0.02
57140 57150 57160 57170 57180 57190 57200 57210
Residual Flux
BJD - 2400000
Fig. 10.Original, preprocessed K2 light curve (red dots) together with the spottedness-only light curve (black curve,upper panel), obtained by the removal of the binarity-produced light variations, i.e., the eclipses, ellipsoidal light variation, and Doppler boosting effect (lower panel).
0.850 0.900 0.950 1.000 1.050 1.100
K2 free from eclipses (mag.)
EPIC 211759736 time-series four-spot fit
-0.02 -0.01 0.00 0.01 0.02
57150 57165 57180 57195 57210
K2 residuals (mag.)
BJD -2400000
Fig. 11.Time-series spot modeling of the K2 data free from the eclipses, ellipsoidal light variations, and any other effects of binarity, i.e., show- ing the spot modulations only. In theupper panelthe K2 light curve is plotted in magenta, together with the almost identical fit from our 4-spot model (blue line). The residuals from the 4-spot model are plot- ted in thelower panel(black curve), while the deviations of the 2-spot model from the data is plotted in red.
portant details on how the radial velocity jitter appears in spotted stars can be found in Korhonen et al.(2015).
5. Discussion
It has been shown that some overactive K-giants in binaries, apart from their rotational modulation, exhibit cyclic, long-term light variations (“activity cycles”) on the order of one magni- tude in overall light variation due to strong and variable spot
Fig. 12.Positions of the active regions in 2015 from our four-spot model fit to the K2 C5 data (top row) and in 2018 from a two-spot model to the ground-based data (middle row) and from a four-spot model to the K2 C18 data (bottom row). The surface maps from left to right show the stellar hemispheres at primary minimum, first quadrature, secondary minimum and second quadrature, respectively.
activity. The primaries of these binaries do not fit the theoret- ical evolutionary tracks, thereby resulting in irreconcilable age estimates (see, e.g., Oláh et al. 2014). The three stars stud- ied in Oláh et al. (2014), IL Hya, XX Tri, and DM UMa, are single-lined systems without eclipses, situated in the solar vicinity, and redder than the majority of giant stars in the solar neighborhood.
Of these three stars XX Tri has the same metallicity as EPIC 211759736, so it is sensible to compare them. Ad- ditionally, we choose two systems containing K-giant stars, KIC 9540226 and KIC 4569690, from Gaulme et al. (2014, 2016) which have similar metallicities as our target and XX Tri.
These latter two systems have well-determined stellar parame- ters from the combined Keplerlight curve and radial velocity analysis. One of them, KIC 9540226, in an eccentric orbit, does not show any observable spot activity. The giant star of this sys- tem has parameters both from asteroseismic and binary model- ing, and was chosen because of its lack of magnetic activity for comparison with the more active stars. On the other hand, both components of KIC 4569690 seem to have spots, and the rota- tional modulation period of the primary is equal to the orbital period of the binary whose orbit is circular. The giant primary of this system does not show any asteroseismic signal and is the only one of the three systems inGaulme et al.(2016; their Table 1) with an active component which has similar metallic- ity to our target star. Finally, we took the well-studied ζ And (K˝ovári et al. 2007), also with similar metallicity; this is the first active giant star for which there is a direct interferometric image (Roettenbacher et al. 2016), which is a huge advantage when trying to understand the degree of spottedness.
The properties of the four comparison stars and EPIC 211759736 are summarized in Table6where the parameters of the active eclipsing binary with giant primary BE Psc (of solar composition) are also given.
-1.00 -0.80 -0.60 -0.40 -0.20 0.00 0.20 0.40 0.60 0.80
0.0 0.1 0.2 0.3 0.4 0.5 0.6 0.7 0.8 0.9 1.0 1.1 1.2
RV residuals (km/sec)
11.48 11.52 11.56 11.60 11.64 11.68
0.0 0.1 0.2 0.3 0.4 0.5 0.6 0.7 0.8 0.9 1.0 1.1 1.2
V magnitude
orbital phase
Fig. 13.Comparison of the radial velocity residuals (top panel, red dots) with the nearly contemporaneous photometry (bottom panel, green dots). The curves have similar shapes, probably reflecting a velocity jitter in the results caused by the spots.
In Fig. 14 we compare the positions of all five of these systems in the H–R diagram using the evolutionary tracks of Bressan et al.(2012). The plotted tracks belong to the metallicity of the studied stars, which are near to [Fe/H]∼ −0.3 (see Table6).
This translates toZ ∼ 0.006 with the standard abundances of Asplund et al.(2004). The star and the evolutionary track be- longing to a given object are shown in the same color. In the case of XX Tri andζ And, the locations from both the litera- ture (filled symbols) and from theGaiaresults (open symbols, Gaia Collaboration 2016,2018) are plotted. Forζ And the two values are essentially the same, while for XX Tri they are very close, emphasizing the reliability of the temperatures and lumi- nosities derived from earlier observations (Table6) of these two active giant stars.
The masses of the secondary stars in the KIC systems match to within 1σtheir corresponding evolutionary tracks (Table6).
The secondary of EPIC 211759736 seems to be slightly too red for our determination that it is an unevolved MS star. However, this star is of solar type and may be found to show magnetic ac- tivity (as the primary does). This could result in a lower average temperature due to surface spots; for stellar temperature changes of active solar-type stars seeFrasca & Biazzo(2007).
Looking at Fig.14we see that all five giant primaries are sit- uated below the tracks corresponding to their respective masses, though to differing degrees. In the middle panel of Fig.14the po- sitions of EPIC 211759736 and the two KIC binaries are shown, enlarged. These latter two seem to be 1σbelow the correspond- ing evolutionary tracks for their respective masses, while the dis- crepancy is about 0.25Mor 2σfor EPIC 211759736.
A very large discrepancy (∼1.4M) is found for ζ And (K˝ovári et al. 2007), which has large spots on its surface; its in- clination is well constrained to be 70±2.8◦(Roettenbacher et al.
2016). However, the mass ofζAnd was derived using evolution- ary tracks (for solar metallicities) that are now outdated. From the present evolutionary tracks on Fig.14the mass ofζAnd is
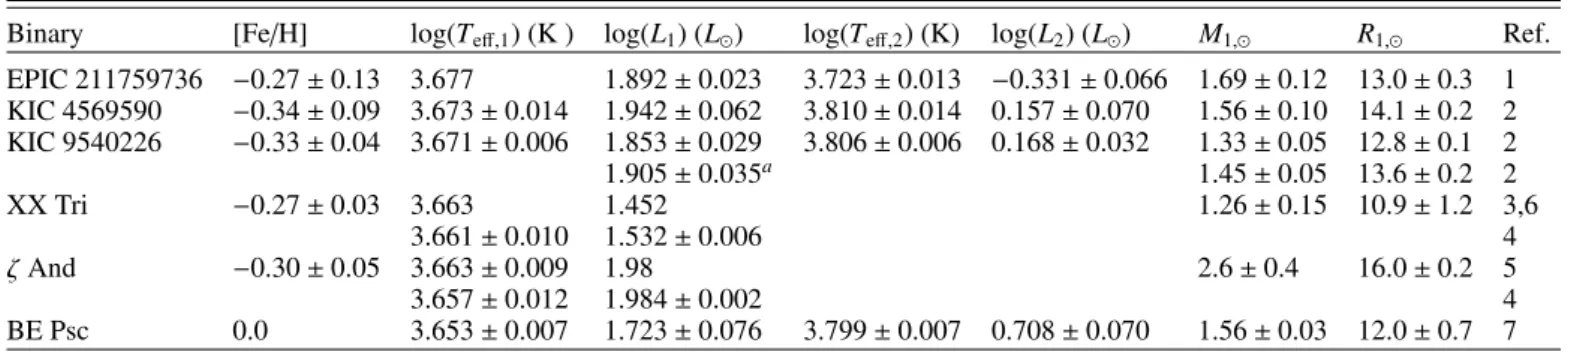
Table 6.EPIC 211759736 and other binaries with giant components in the evolutionary tracks.
Binary [Fe/H] log(Teff,1) (K ) log(L1) (L) log(Teff,2) (K) log(L2) (L) M1, R1, Ref.
EPIC 211759736 −0.27±0.13 3.677 1.892±0.023 3.723±0.013 −0.331±0.066 1.69±0.12 13.0±0.3 1 KIC 4569590 −0.34±0.09 3.673±0.014 1.942±0.062 3.810±0.014 0.157±0.070 1.56±0.10 14.1±0.2 2 KIC 9540226 −0.33±0.04 3.671±0.006 1.853±0.029 3.806±0.006 0.168±0.032 1.33±0.05 12.8±0.1 2
1.905±0.035a 1.45±0.05 13.6±0.2 2
XX Tri −0.27±0.03 3.663 1.452 1.26±0.15 10.9±1.2 3,6
3.661±0.010 1.532±0.006 4
ζAnd −0.30±0.05 3.663±0.009 1.98 2.6±0.4 16.0±0.2 5
3.657±0.012 1.984±0.002 4
BE Psc 0.0 3.653±0.007 1.723±0.076 3.799±0.007 0.708±0.070 1.56±0.03 12.0±0.7 7 Notes.(a)Astroseismic value.
References.1: present work, 2:Gaulme et al. (2016), 3:Oláh et al.(2014), 4:GaiaDR2, 5:K˝ovári et al.(2007), 6: Künstler et al.(2015), 7:Strassmeier et al.(2008).
about 1.3M, that is, about half of its old value, and its age is around 3.5–4 Gyr; both of these appear reliable.
A similar discrepancy is seen for XX Tri (&0.5M), as noted already inOláh et al.(2014), which has a long-term light vari- ation with an amplitude of about one magnitude, and, addition- ally, huge rotational modulations are present from time to time.
Large rotational modulations are observed only for stars with high rotational inclination; low-inclination or pole-on stars ex- hibit very small amplitude or no rotational modulation at all.
But on low-inclination objects it is still possible to observe large cyclic light variations, even though only about half of the stellar surface is visible to the observer (an example is V833 Tau; see Fig. 2. inOláh et al. 2009).
During the last decade stellar evolution calculations have be- come much more reliable (see the case ofζAnd above), although the magnetic fields are still missing from the evolution models.
The masses of the two KIC stars are not too discrepant from the theoretical value, and EPIC 211759736 is only 15% higher in mass than implied by the evolutionary tracks. KIC 9540226 does not show light variations due to spots, and KIC 4569590 and EPIC 211759736 seem not to have strong activity which is inferred from their relatively small light-curve amplitudes originating from spots. The deviations from the direct model- ing results for these three primary stars among the eclipsing bi- naries could be due to the still imperfect evolutionary models and/or different evolutions in binary systems. However, we do not have an independent mass determination for ζ And since it has no eclipses, but its light variation is also not very strong either in spot modulation or long-term timescale variations (cf.K˝ovári et al. 2007). Therefore, its recently determined mass is very likely not too far from the correct one.
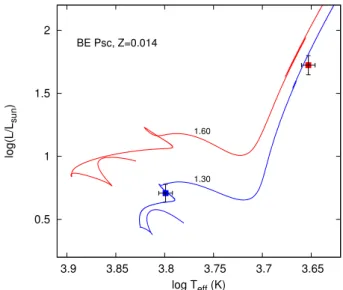
The other well-studied active giant in an eclipsing bi- nary, BE Psc, has strong long-term and rotational variability (Strassmeier et al. 2008), and in the quoted paper the masses of the components are well determined from photometric and ra- dial velocity data. The components are plotted on a Hertzsprung- Russell Diagram (HRD) in Fig.15for metallicity close to solar.
While the secondary stellar component is well matched by the evolutionary track corresponding to its known mass, the active primary deviates by about 30% in the sense that it has higher mass than its temperature and luminosity imply.
The case of XX Tri is different from the others.Oláh et al.
(2014) did not find an acceptable mass for the star using the same evolutionary tracks as in the present paper; the derived tempera- ture and luminosity point to an inconsistent mass and age on the HRD. This star is “overactive” with huge rotational modulations
and long-term variability, and in this case we believe that the strong magnetic field was able to alter even its stellar structure.
Present stellar evolution models that do not take into account the magnetic field are unable to predict a reasonable mass for XX Tri. We note here that in the case of another “overactive”
star, IL Hya, weak evidence is found for changes in its stellar radius during the long-term cycle (Oláh et al. 2014). Even the question of radius changes in the well-observed nearest star, the Sun, is still open (cf.Kosovichev & Rozelot 2018).
The internal structure of giant stars with strong magnetic fields between the core and the widened, diluted atmosphere is not well studied. Supposing a flux tube dynamo scenario, the flux ropes created by the magnetic dynamo in the shear layer between the core and the convection zone rise up from the tachocline to the surface, causing the observable activity features, but can also remain trapped below the stellar surface (Holzwarth & Schüssler 2001), and the consequences are unknown. The oscillations of some red giant stars are suppressed to an undetectable level due to internal magnetic fields (Gaulme et al. 2016), but the mecha- nism for this is not completely clear.
6. Summary and conclusions
In this paper we present a detailed study of EPIC 211759736, now the second best-studied/characterized active giant in an eclipsing binary after BE Psc. We determined the physical pa- rameters of both stellar components and provide a description of the rotational and long-term activity of the primary component.
The temperatures and luminosities of both components were ex- amined in the context of the HRD. We find that both the primary and the secondary components deviate from the evolutionary tracks corresponding to their masses in the sense that the stars appear in the HRD at lower masses than their true masses.
We compared EPIC 211759736 with the well-studied active giants BE Psc,ζ And and XX Tri. Among these, only BE Psc has eclipses. Two KIC stars were also in the comparison sample.
Except for BE Psc, all the stars have very similar metallicities.
We suggest three possible reasons for inferred mass deviations from the evolutionary tracks: inexact evolution calculations for evolved stars, the difference in stellar evolution when a star is in a binary system, and the effect of the strong magnetic field on the stellar structure. Our results suggest that in the case of no/low ac- tivity, the evolutionary tracks agree fairly well with the derived masses of the stars: these are the two KIC stars, one without any observable activity and the other with low amplitude variability.
Next, the target of our present study, EPIC 211759736, shows
-0.5 0 0.5 1 1.5 2 2.5
3.6 3.65 3.7 3.75 3.8 3.85 3.9 3.95 4 4.05 4.1 log(L/Lsun)
log Teff (K)
XX Tri
1.35 1.45 1.55 1.70
0.80 0.90 1.00 1.10 evolutionary tracks:
Z=0.006
4 objects
1.25 2.60
1 1.5 2 2.5
3.65 3.7
log(L/Lsun)
log Teff (K)
XX Tri evolutionary tracks:
2.60
1.70
1.25
0.80
zeta And
-0.6 -0.5 -0.4 -0.3 -0.2 -0.1 0 0.1 0.2 0.3 0.4 0.5
3.7 3.72 3.74 3.76 3.78 3.8 3.82 log(L/Lsun)
log Teff (K)
0.80 0.90 1.00 1.10
evolutionary tracks:
Fig. 14. Position of EPIC 211759736 (large red square) on the HRD (Bressan et al. 2012), in comparison with KIC 4569690 (green) and KIC 9540226 (blue, dynamically derived values) and magenta (astro- seismic values). Additionally, two well-known active giants are plotted:
XX Tri andζAnd with both the literature andGaia2 results (filled and empty squares, respectively). Tracks for 2.6 and 1.25 solar masses are displayed in gray dashed lines for the traditionally determinedζAnd and XX Tri masses. The middle and bottom panels show the details around the giant and dwarf components of the systems. See the text and Table6for details.
0.5 1 1.5 2
3.65 3.7
3.75 3.8
3.85 3.9
log(L/Lsun)
log Teff (K) BE Psc, Z=0.014
1.60
1.30
Fig. 15.Position of BE Psc on the HRD with metallicity close to so- lar. The positions of the primary and secondary are marked with red and blue squares, respectively. The corresponding evolutionary tracks are plotted with the same color. While the secondary star matches its evolutionary track, slightly after having left the MS, the active pri- mary deviates by about 30% from its corresponding track (data are from Strassmeier et al. 2008).
a higher amplitude rotational modulation and also long-term variability. Furthermore, in this case, the primary is about 15%
more massive than is implied by the evolutionary tracks. BE Psc has even stronger activity, and its primary component is about 30% more massive than the evolutionary tracks suggest. Finally, XX Tri has by far the strongest activity, but it lacks eclipses, so only the mass function is determinable. In the case of XX Tri it is not possible to get a reliable mass from the HRD.
The mass discrepancies seem to be larger as the strength of the stellar activity grows in our sample of active giant stars. It is possible that the lack of magnetic fields in the evolution calcu- lation and the effects of evolving in a binary play a role in their position on the HRD for all of our stars, but these would seem to be minor effects. The strength of the magnetic activity, however, may significantly alter even the structure of the stars. The KIC stars andζ And possibly have weaker internal magnetic fields, while EPIC 211759736, BE Psc, and XX Tri have progressively stronger magnetic fields revealed by their photometric behavior.
This is manifested clearly in the deviations of their masses from the theoretical predictions.
Observations of eclipsing binaries with active giant compo- nents is of crucial importance in describing stellar evolution after the MS in the presence of magnetic fields. EPIC 211759736 is now one of the two most well-studied active giants in eclipsing binaries which should lead to better constraints on the structure and evolutionary trends for this type of magnetically active star.
Eclipsing spotted giant stars such as EPIC 211759736 could benefit significantly from long-term, multicolor observations.
These would allow us to study the average temperature changes of the active regions, which may then reflect the possible spot/plage ratio changes. More effort is needed to further char- acterize systems such as EPIC 211759736 and BE Psc, as well as most of the active KIC stars fromGaulme et al.(2016), all of which have primary components between 1.0 and 1.6Mand secondaries between 0.8 and 1.3M. The different evolutionary stages of similar-mass, solar-like stars in close binaries, with dif- ferent activity levels of possibly magnetic origin in one or both