Central European Higher Education Cooperation Conference Proceedings
Proceedings of the 4th and 5th CEHEC conference
CIHES Working Paper Series No.15.
Center for International Higher Education Studies and
Central European University
Central European Higher Education Cooperation Conference Proceedings
Proceedings of the 4th and 5th CEHEC conference
January 2020
CIHES Working Paper Series No.15.
ISSN 2060-9698
ISBN 978-963-503-835-0
Responsible for publication: András Lánczi Technical editor: Gergely Kováts
Published by: Corvinus Universy of Budapest Digital Press
Éva KARCSICS – Ágnes SOMOSI ... 7
Competence-based management model in higher education: cognitive abilities and Big Five personality traits in relation of academic performance ... 7
Feifei WANG – Éva BÍRO ... 21
The relationship between sleep belief, stress and sleep quality among college students 21 Zsuzsanna E. TÓTH – Vivien SURMAN ... 31
Developing a Service Quality Framework for a Special Type of Course ... 31
Zsuzsanna E. TÓTH – György ANDOR – Gábor ÁRVA ... 47
Experiences of a university peer review of teaching program ... 47
Éva PÁLINKÓ ... 71
Academy - Industry Relationships in Hungary ... 71
Ayelet GILADI – Hannen MAGALH ... 81
Training Bedouin Women for the Workforce as Educators in the Pre-School Sector ... 81
Publication of other papers presented at CEHEC 2018 and CEHEC 2019 ... 97
Conference organizers ... 99
Authors
ANDOR György, associate professor, Eötvös Loránd University
ÁRVA Gábor, PhD student, Budapest University of Technology and Economics, Hungary BÍRÓ Éva, assistant professor, University of Debrecen
E. TÓTH Zsuzsanna, associate professor, Eötvös Loránd University
GILADI Ayelet, NCJW Research Institute for Innovation in Education, the Hebrew University of Jerusalem
KARCSICS Éva, college professor, John von Neumann University
KOVÁTS, Gergely, director, Center for International Higher Education Studies
MAGALH Hannen, NCJW Research Institute for Innovation in Education, the Hebrew University of Jerusalem
PÁLINKÓ Éva, Pallasz Athéné University and Hungarian Academy of Sciences
SOMOSI Ágnes, assistant lecturer, John von Neumann University, and external lecturer, Corvinus University of Budapest
SURMAN Vivien, PhD student, Budapest University of Technology and Economics SZABÓ Mátyás, senior manager, Central European University
WANG Feifei, PhD Student, Eötvös Loránd University
Éva KARCSICS – Ágnes SOMOSI
Competence-based management model in higher
education: cognitive abilities and Big Five personality traits in relation of academic performance
Abstract
Competence-based human resources management is one of the key tools for implementing an organizational strategy. Our goal is to link labor force, development, career planning and performance management. This paper presents the first results of a competence-based measurement in higher education, focusing on the relationship between cognitive abilities, personality and academic performance.
1 Introduction
It is a strongly emphasized thesis in the special literature on management that human resources themselves are the main factor of competitiveness that have the potential of ensuring sustainable competitive advantage (Wright–Dunford–Snell, 2001).
At John von Neumann University we introduced a subject-specific competence assessment (Karcsics-Somosi, 2019), which we consider to be an important tool for accomplishing our strategic goals in terms of linking higher education competence development with market labor requirements of companies in the urban ecosystem.
The aim of our paper is to assess the relationship between academic performance, creativity and the Big Five personality traits (Neuroticism, Extraversion, Openness to Experience, Agreeableness, and Conscientiousness) (Costa Jr & McCrae, 1995).
After the college was promoted to the rank of a university, a new training program, a BA in business administration and management was launched in the autumn of 2016, where we introduced subject-specific competence assessment, which we see as an
important tool for accomplishing our strategic goals. It promotes our diagnostic goal, the assessment of the inputs of a particular year and getting information on their level of knowledge; it helps us define the starting point of training in the most important subject areas. On the basis of our competence assessment, the difference between the input and output results will provide feedback on the direction and amount of added value. Our method makes a significant contribution to the accomplishment of our development goals: based on the results of the competence assessment, we can identify specific dimensions for bridging any possible gaps at both the group and the individual level. It provides a basis for working out a talent management program and a tutor system, assisting a conscious student career path and orientation. In addition, it supports other strategic goals of the institution, the shaping of the training program’s future, curriculum development; the evolution and strengthening of student-teacher relationship relying on trust, feedback and mutual cooperation.
When defining the competences to be assessed, the starting points included the new training and output requirements, labor market surveys and international research referred to previously. Among the latter, we pay special attention to the results of the TUNING project. We examined the relevant competencies one after the other and then grouped them according to possible assessment methods. Next, we identified the professional criteria for the assessment tools and then conducted comprehensive research on the applicable assessment tools by including renowned scholars working in several areas (psychology, human resources management, sociology, education, and information technology), experts working in the corporate sector as well as, of course, the teachers involved in the relevant training programs. We devoted special attention to the proposals made by the HR experts of companies that are the potential employers of our graduates on their procedures for selecting their employees and the methods they use.
On the basis of all this, after considering all the professional expectations, criteria and possibilities, we selected an advisory firm – which is a market leader not only on Hungary – that has been engaged in competence assessment for over 30 years and purchased 5 paper-based assessment tools along with their standard requirements. In addition, we were able to purchase a test developed by the leaders of the Testing Committee of the Hungarian Psychological Association that assesses personal efficiency and leadership capabilities. We organized a “Train the Trainers” program for administering and evaluating competence tests in a professional manner lead by the license owners. We managed to test all the students on their competence in the first semester of the 2016-17 academic year, when the degree program was first offered.
The relationship between cognitive abilities and academic performance is well documented (Chamorro-Premuzic & Furnham, 2008), however there is a doubt in
variance in academic performance, suggesting that factors other than ability contribute to individual differences.
What regards creativity and academic performance, students with higher academic achievement are more creative (Sen & Hagtvet, 1993), and scores on fluency, flexibility, and originality are related to academic achievement (Bal, 1988). It was also found that Graduate Record Examination (GRE) test scores, widely employed for post-graduate selection in the U.S. and an accurate predictor of future academic performance, were significantly correlated with creativity (Powers & Kaufman, 2004).
One problem that the literature highlights is the objective measurement of creativity.
It is usually assessed using self-report inventories or checklists. They also raise the question of self-reported creativity as an accurate tool for measuring creative thinking processes (Clapham, 2004). To ensure the validity of business creativity measurement, the Test of Creative Thinking was used that is applied by human resource management companies.
Based on the literature describing the relationship between cognitive abilities and academic performance, we expected the following:
Hypothesis 1: Cognitive abilities (intelligence, logical thinking and creativity) positively relate to academic performance.
Among the Big Five personality traits Openness to Experience will be positively and significantly associated with academic performance, and it is interpreted in terms of significant correlation between Openness and intellectual ability, particularly vocabulary and general knowledge (Ashton, Lee, Vernon, & Jang, 2000 (Goff & Ackerman, 1992).
Hypothesis 2 a.: Openness to experience positively relates to academic performance.
Agreeableness was found to be the only predictor with SAT scores (John & Srivastava, 1999), and there is a positive relationship between agreeableness and grades in general (Hair & Graziano, 2003).
Hypothesis 2 b.: Agreeableness positively relates to academic performance.
Extraversion will be negatively and significantly associated with academic performance (Chamorro‐Premuzic, 2006). This is also consistent with studies reporting a negative relation between Extraversion and knowledge tests (e.g., Rolfhus & Ackerman, 1999).
Hypothesis 2 c.: Extraversion negatively relates to academic performance.
Neuroticism will be negatively and significantly related to academic performance, as stable individuals tend to perform better in university classes (Lathey, 1991).
Hypothesis 2 d.: Neuroticism positively relates to academic performance.
Conscientiousness will be positively and significantly related to academic performance, not only in academic, but also in occupational, settings (Chamorro‐Premuzic, 2006, Goff
& Ackerman, 1992).
Hypothesis 2 e.: Conscientiousness positively relates to academic performance.
2 Research questions
In our empirical research we aim to investigate the following research questions:
1. What is the relationship between academic performance and cognitive abilities?
2. What is the relationship between academic performance and Big Five personality traits?
3 Method
We managed to test all the students on their competence in the first, second and third semester of students starting in the 2016-17 and 2017-18 academic years, when the degree program was first offered. We have carried out analysis of 112 students in the
end of June 2019. As this is an ongoing research, we continuously broaden the sample with new data.
We used the classification of subjects based on the Qualification and Output Requirements (KKK), and used the following categories:
• Business administration and management
• Economics, methodology and business
• Social sciences
• Sports
• Facultative courses
We also managed to identify some improvement areas for the classification, with altogether 33 misplaced courses from the 118 in total. The following table shows some improvement suggestions:
Table 1. Improvement suggestions
Courses Qualification and Output
Requirements (KKK) Category Suggested Category
Decision methods
and methodology Business administration and
management Economics, methodology and
business Business ethics Business administration and
management Social sciences
Marketing Economics, methodology and
business Business administration and
management Business language Economics, methodology and
business Business administration and
management Business
communication Economics, methodology and
business Business administration and
management Business
economics
Economics, methodology and business
Business administration and management
In our paper we use correlation analysis to investigate the relationship between creativity, Big Five personality traits and academic performance. Further on, we expect to find
positive deviation between the results of input and output assessment for the benefit of the output, which can be first assessed in February 2020.
4 Results
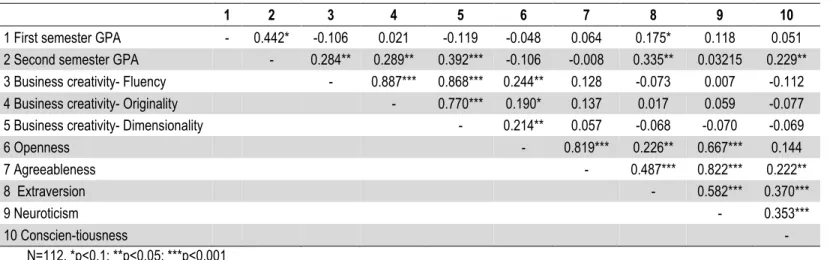
Regarding our hypotheses we find that there is a significant positive relationship between the first semester GPA and extraversion (0,175*), thus we reject H2 c. Further, there is a significant positive relationship between the second semester GPA and business creativity-fluency (0,877***), business creativity- originality (0,868***) and business creativity-dimensionality (0,392***), so we accept H1. There is also a positive relationship between second semester GPA and extraversion (0,335**) and conscientiousness (0,229**), thus H2 c. is rejected and H2 e. is accepted. We found no empirical evidence for H2 a., b. and d. The results are summarized in Table 2. below.
Table 2. Correlations among creative thinking scores, personality traits and academic performance
1 2 3 4 5 6 7 8 9 10
1 First semester GPA - 0.442* -0.106 0.021 -0.119 -0.048 0.064 0.175* 0.118 0.051 2 Second semester GPA - 0.284** 0.289** 0.392*** -0.106 -0.008 0.335** 0.03215 0.229**
3 Business creativity- Fluency - 0.887*** 0.868*** 0.244** 0.128 -0.073 0.007 -0.112
4 Business creativity- Originality - 0.770*** 0.190* 0.137 0.017 0.059 -0.077
5 Business creativity- Dimensionality - 0.214** 0.057 -0.068 -0.070 -0.069
6 Openness - 0.819*** 0.226** 0.667*** 0.144
7 Agreeableness - 0.487*** 0.822*** 0.222**
8 Extraversion - 0.582*** 0.370***
9 Neuroticism - 0.353***
10 Conscien-tiousness -
N=112, *p<0.1; **p<0.05; ***p<0.001
The GPA analysis shows that the first semester GPA correlates with the entry points (0,39**) , and in terms of the subject areas there is a positive relationship between first semester GPA and economics, methodology and business (0,735***), elective courses (0,327**) and social sciences (0,670***).
Regarding the subject area analysis we find that the second semester GPA positively correlates with business administration and management (0,566***), economics, methodology and business (0,838***), elective courses (0,161*) and social sciences (0,366***).
Similarly, we find a positive relationship between first semester ECTS index and the following subject areas: economics, methodology and business (0,683***), elective courses (0,410***) and social sciences (0,611***). Further, the second semester ECTS index positively correlates with business administration and management (0,612***), economics, methodology and business (0,870***) and social sciences (0,340***).
There is a significant positive relationship between the second semester GPA and Raven advanced progressive matrices test (0,203**), process diagram test (0,189*), business creativity-fluency (0,284**), business creativity- originality (0,289**), business creativity-dimensionality (0,392***), responsibility (0,263**), socialization (0,321**), communality (0,198*), achievement via conformance (0,227**), achievement via independence (0,267**), feminism (0,238**), conventionalism (0,408***), leadership scale- responsibility (0,335**), leadership scale- need for performance (0,231**), Big Five- extraversion (0,335**), Big Five- conscientiousness (0,229**).
There is a significant positive correlation between third semester GPA and Raven advanced progressive matrices test (0,238**), process diagram test (0,194**), business creativity- fluency (0,381***), business creativity- originality (0,350***), business creativity- dimensionality (0,518***), socialization (0,237**), tolerance (0,216**), communality (0,184*), achievement via conformance (0,212**), achievement via independence (0,229**), leadership scale-responsibility (0,212**), and Big Five- extraversion (0,233**).
For the 2016-2017 students we found some additional remarkable correlations:
sport positively correlates with self-acceptance (0,252*), dominance (0,293**), sociability (0,323**), sense of well-being (0,356**), capability for status (0,364**), extrovert factor (0,294**), social effectiveness from the Big Five dimensions (0,313**) and leadership factor (0,333*), whereas negatively correlates with anxiety (-0,350**) and feminism (- 0,386**).
The second semester results show that there is also a positive relationship between
5 Discussion
Our first hypothesis was fulfilled, study averages show a positive correlation with the intellectual abilities examined, such as intelligence (Raven's test), logical thinking (Diagram analysis), creativity (Creative Thinking’s Test).
Raven (2000) calls his test to measure the ability to observe and to think clearly, to identify the laws of different matrices. We use the high-intelligence adolescents and the Advanced Progressive Matrix developed between 1941-1947 for adults. Identifying relationships that are not necessarily obvious at first glance. It is well suited to measuring abilities that refer to conclusion-based logical thinking. (Eductive thinking: meaning- making.)
The student average of the study also correlated with the results of the 'Diagram Analysis' test. This test measures logical thinking, high level analytical ability: analysis and understanding of a given situation, systematic problem solving, recognition of causal relationships, foresight.
The development of logical thinking and analytical ability largely determines the effectiveness of understanding and learning the curriculum, so these indicators are important indicators of student performance.
We also found a positive correlation between the study average and creativity. The origin of the word "creativity" is the Latin word "creare", which means: to give birth, to be born, to create. Creativity is therefore a process that "creates" itself, creates, unfolds itself, carrying its origin and purpose in itself. Creativity is the ability to create something new, such as a new problem solving, a new method, and so on.
The basic concept of creative abilities was created by Guilford and Hoepfner (1971). Based on their research, they have identified the following elements in the concept of creativity: the results provide information on originality, flexibility and fluency.
Originality (originality) shows that "a thought, a solution is unique, rare, unconventional, not" ordinary "(Herskovits-Gefferth 2000, 25.) The high score of originality suggests the novelty and unusualness of the answers; how the student can structure the situation in the new association relationship.
"Fluency indicates the ease and frequency with which different thoughts, ideas, solutions, associations come to the fore." (Herskovits – Gefferth 2000, p. 26.). Fluidity is measured by the number of responsive responses.
"Flexibility, intellectual flexibility, and ability to change aspects help you to switch from one subject, element to another, use knowledge in a different context, leave the
beaten way of thinking, break away from what you already know." (Herskovits-Gefferth 2000, p. 26.).
Its high value suggests that the student approached the answer from several sides.
Its low value suggests that responses have been made for a particular schema. (Davis- Rimm 2000; Herskovits-Gefferth 2000; Field-Field 2003).
The correlation of all three dimensions of creativity with the average of studies indicates that creative abilities are needed to achieve higher education success. During the learning process, the student encounters a number of tasks, problems to be solved, unknown to him or her, as well as a measure of the success of their solution.
Our analysis of the intellectual abilities of students has also resulted in convergent and divergent thinking. Intelligence tests primarily measure convergent thinking, while creativity is related to divergent thinking (Mező-Mező 2003).
The positive relationship between study averages and intellectual abilities means that the educational and accounting requirements are appropriate to the intellectual abilities of students who are able to mobilize these competences to achieve learning performance.
We should mention that we did not expect or correlate the study average with our
"Analysis of figures" test. The reason for this is that the test is not just a matter of counting skills, but expecting an interpretation of business data and statements from the respondent. Therefore, we need professional (economic, financial, accounting) knowledge that will be acquired by the students in the next semester of the training, for the same reason we did not include the so-called "filing practice" in this analysis.
Our second hypothesis was partly fulfilled.
Two of the five dimensions of the Big Five, the Extraversion and the Conscientiousness dimensions, found a positive correlation with the study average. This means that the students are interested in intellectual activity, the mental strength is highly valued and intellectually effective. Performance-motivated individuals who achieve performance or conformism (job performance) or independence (job seekers) but reach.
Scientists, responsible young people who are responsible for their tasks and trust in their social relationships. They are capable of adapting, regulating their behavior effectively, tension regulation leading to adaptation and community-friendly solutions.
However, there was no correlation between the other three dimensions of the Big Five (Openness to Experience, Agreeableness, Neuroticism), and the scales of each dimension were examined in detail. In our view, research did not show any correlation
young people are filled with uncertainty about how they will meet the new requirements;
they are looking for their place and role in the new community, the rules of which are also evolving, so the alignment points are vague.
One of the dimensions of the Openness to Experience dimension is self- acceptance, whether a person is aware of his or her personal values and abilities, where he / she is at the level of self-knowledge and self-esteem. Successful social action would require a high degree of self-confidence and all these would lead to the individual becoming a leader in social communities. This statement coincides with the summary of the Hungarian Youth Research study book that self-confidence is a general feature of Hungarian youth: based on our research results, our prospective economist and manager students are no exception at the beginning of their studies.
The "storks" (freshmen) obviously strive to give a good impression, but they do not yet have the level of empathy (especially not psychological sensation) and social maturity that would be needed for a positive correlation between the study average and the Agreeableness dimension. At the beginning of their studies, students, uncertain in themselves, in the expectations of the environment, find it difficult to set real goals, or even worry about being afraid of failure. Thus, the comparative result of the study average and the Neuroticism dimension is acceptable.
According to our assumption and expectations, these dimensions will have a positive correlation with student performance in the output measurement.
The results on sport and anxiety are well described in the literature. Gill (1986) points out that sport has positive effects on mild to moderate depression, reduces anxiety and stress, increases self-confidence and improves self-image. Further, perceived health status is influenced by anxiety, depression and psychophysiological symptoms; and sport participation influences also perceived health indirectly through anxiety, depression and psychophysiological symptoms (Thorlindsson, et al., 1990). “Adolescents who are active participants in sports tend to experience less anxiety, be less depressed and have fewer psychophysiological symptoms such as aches and pains and dizziness.” (Thorlindsson, et al., 1990, p. 554.).
Our current study clearly has some limitations: the sample should be broader to ensure the robustness of results, so the correlations presented can only be interpreted as the first results of an ongoing research. Thus, further analysis includes the correlations on a broader sample, and if the output results are available, the comparison between in- and –output results. A further goal is the assessment of competence-based results with labor market wages.
6 Conclusion
The study average is a measure of a student's learning performance. The starting point for performance is the prior and acquired knowledge, the abilities and skills that are activated by the behavior (environment) certified in the teaching-learning process.
The first part of our results shows that intellectual abilities such as intelligence, logical thinking, and creativity are the key indicators of student success.
Another dimension of our results reveals students' performance-influencing qualities along which intellectual abilities are mobilized: performance motivation, sense of responsibility, self-control, communality, flexibility.
In order to increase student performance, efficiency and / or achieve it sooner, we can help students with different services, programs, teacher-contemporary relationships, etc., so that their socialization into higher education can happen faster and easier at the beginning of their studies.
References
Ashton, M. C., Lee, K., Vernon, P. A., & Jang, K. L. (2000). Fluid intelligence, crystallized intelligence, and the openness/intellect factor. Journal of Research in Personality, 34(2), 198-207.
Bal, S. (1988). Creativity, cognitive style and academic achievement amongst university students. Psychological Studies.
Chamorro‐Premuzic, T. (2006). Creativity versus conscientiousness: Which is a better predictor of student performance? Applied Cognitive Psychology: The Official Journal of the Society for Applied Research in Memory and Cognition, 20(4), 521- 531.
Chamorro-Premuzic, T., & Furnham, A. (2008). Personality, intelligence and approaches to learning as predictors of academic performance. Personality and individual differences, 44(7),, 1596-1603.
Clapham, M. M. (2004). The convergent validity of the torrance tests of creative thinking andcreativity interest inventories. Educational and Psychological Measurement, 64,
Costa Jr, P. T., & McCrae, R. R. (1995). Domains and facets: Hierarchical personality assessment using the Revised NEO Personality Inventory. Journal of personality assessment, 64(1), 21-50.
Davis, G. A. – Rimm, S. B. (2000): A kreatív diákok jellemzői. In Balogh L. – Herskovits M. – Tóth L. (szerk.): A tehetségfejlesztés pszichológiája. Debreceni Egyetem, Kossuth Egyetemi Kiadó, Debrecen, 49–56.
Goff, M., & Ackerman, P. L. (1992). Personality-intelligence relations: Assessment of typical intellectual engagement. Journal of Educational Psychology, 84(4).
Guilford, J. P., & Hoepfner, R. (1971). The Analysis of intelligence. New York, NY:
McGraw-Hill Book Co.
Hair, E. C., & Graziano, W. G. (2003). Self‐esteem, personality and achievement in high school: A prospective longitudinal study in Texas. Journal of Personality, 71(6), 971-994.
Herskovits Mária – Gefferth Éva (2000): A tehetség meghatározásai és összetevői. In Balogh L. – Herskovits M. – Tóth L. (szerk.): A tehetségfejlesztés pszichológiája.
Debreceni Egyetem, Kossuth Egyetemi Kiadó, Debrecen, 23–28.
John, O. P., & Srivastava, S. (1999). The Big Five trait taxonomy: History, measurement, and theoretical perspectives. Handbook of personality. Theory and research, 2(1999), 102-138.
Karcsics, É- Somosi, Á (2019): Competence-management modell design in higher education, III. Gazdálkodás és Menedzsment Tudományos Konferencia, p. 472- 478.
Lathey, J. W. (1991). Temperament style as a predictor of academic achievement in early adolescence. Journal of Psychological Type.
Mező Ferenc – Mező Katalin (2003): Kreatív és iskolába jár. Tehetségvadász Stúdió – Kocka Kör Tehetséggondozó Kulturális Egyesület, Debrecen.
Raven, J. (2000): The Raven’s Progressive Matrices. Academic Press, Edinburgh.
Rolfhus, E. L., & Ackerman, P. L. (1999). Assessing individual differences in knowledge:
Knowledge, intelligence, and related traits. Journal of educational psychology, 91(3).
Sen, A. K., & Hagtvet, K. A. (1993). Correlations among creativity, intelligence, personality, and academic achievement. Perceptual and motor skills, 77(2), 497- 498.
Székely Levente (szerk.) Magyar fiatalok a Kárpát-medencében- Magyar Ifjúságkutatás 2016. Kutatópont kft.; Enigma 2001 Kiadó és Médiaszolgáltató Kft. Budapest, 2018 Wright, P. – Dunford, B. – Snell, S., (2001): Human resources and the resource based
view of the firm. Journal of Management. 27 (6), p. 703.
Feifei WANG – Éva BÍRÓ
The relationship between sleep belief, stress and sleep quality among college students
Abstract
Poor sleep quality has become a public health problem, and it is important to know whether it is also present among college students. Objective: This study aimed to describe the sleep quality of college students and examine the relationship between sleep belief, stress and sleep quality. Methods: A cross-sectional study was conducted in June 2016 to assess sleep quality and its risk factors among university students at the Faculty of Public Health of the University of Debrecen, Hungary. Results: 83 public health and physiotherapy bachelor students filled out the questionnaire (response rate: 72.2%).
The result showed that more than half of the students reported poor sleep quality. The quality of sleep was better among males than females, and the level of stress was higher among women than men. There was no association between academic year and sleep quality. Furthermore, stress was significantly related to poor sleep quality, while no statistical association was found between sleep belief and sleep quality. Conclusion:
Raising awareness about the importance of good sleep quality may help students make better choices during college life and after graduation.
1 Introduction
Data from the National Sleep Foundation poll showed that up to 27% of Americans slept less than 6 hours in 2011 (Carskadon, 2011). Recently, surveys conducted in Australia showed that the average sleep time was 7 hours in 2010 compared to 8 hours in 2000 (Olds et al., 2010). There is a tendency among university students to stay up late at night and wake up later in the morning. The number of sleep hours per night has dropped among young adults in the United States over the last two decades. Medical students
carry a heavy academic load, which could lead to poor sleep quality as it was already experienced by modern society (Azad et al., 2015). Medical students can be characterized with irregular sleep pattern, i.e. changing start and end times of sleep, which tend to be later at weekends and also sleep duration is usually shorter during the week, and these can cause sleep deprivation on workdays.
Sleep has several different functions in learning and memory consolidation (Benington, Frank, 2003; Tononi, Cirelli, 2014; Wolfson, Carskadon, 2003). The relationship between sleep, learning and memory processes has been highlighted, and the investigation of the effects of sleep deprivation on student learning ability and academic performance is needed. Students with poor academic performance have a higher risk of sleep less and have irregular sleep/wake habits (Wolfson, Carskadon, 1998). Another study also confirmed the hypothesis that decreased sleep time has a negative association with academic performance in medical students (BaHammam, et al., 2012; Ahrberg, et al., 2012). Even though there was a research which showed that sleep problems were frequent among Palestinian undergraduates and there was no significant association between sleep quality and academic achievement (Sweileh et al., 2011), it will not change the common point of view - supported by many other researches - that sleep problems can affect academic performance (Gilbert, Weaver, 2010;
Gaultney, 2010; Lemma et al., 2013) i13.
Self-awareness and general knowledge about sleep appeared to be insufficient among university students. Therefore, educational strategies with the purpose to improve knowledge and awareness regarding sleep disorders and help to develop proper sleep practices are needed (Bosie et al., 2012). There are some interventions which were able to promote sleep knowledge and sleep habits among college students. For instance, a pilot study of sleep health promotion conducted among college students achieved great success (Levenson et al., 2016).
Given that sleep belief is essential to cope with daytime sleep loss in those who had insomnia (Morin et al., 1993), it is strongly suggested examining sleep belief in order to improve sleep quality. Previous cognitive–behavioural approaches presumed that problematic beliefs about sleep play a significant role in sustaining insomnia (Edinger, Wohlgemuth, 2001). Stress was indicated as a risk factor of students’ mental health. A college students-based study revealed that the key sources of campus stress were the academic performance, the pressure to succeed, and post-graduation plans (Beiter et al., 2015). The role of stress on sleep beliefs in college students is, up to now, under investigation.
In our study, we hypothesised that sleep belief and stress are correlated with sleep
among college students and explore the association between them, through which, methods to promote sleep quality can be expected. The objectives of this study were double, firstly, to describe the sleep quality status from first to fourth academic year students; secondly, to investigate the relationship between sleep belief, perceived stress and sleep quality among college students.
2 Methods
2.1 Study population
The target population of this study was the international Bachelor students from 1st grade to 4th grade at Faculty of Public Health, University of Debrecen. Out of 115, the total number of participated students was 83 (response rate: 72.6%). Data collection was taken place in the first two weeks of June 2016.
2.2 Questionnaire
A self-administered questionnaire was designed based on previously published survey instruments to investigate demographic data, lifestyle, sleep quality with the Pittsburgh Sleep Quality Index (PSQI), stress with the Perceived Stress Scale (PSS), and sleep belief with the Sleep Beliefs Scale (SBS).
Pittsburgh Sleep Quality Index (PSQI) can be used to measure the quality and patterns of sleep (Buysse, et al., 1989). It distinguishes between poor and good sleep quality based upon seven components regarding sleep, such as latency, duration, habitual sleep efficiency, subjective sleep quality, sleep disturbances, use of sleeping medications, and daytime dysfunction during the past month. PSQI score greater than five indicated poor sleep quality, while PSQI score less than six means good sleep quality. The global sleep quality score ranges from 0 to 21.
Perceived Stress Scale (PSS) known as one of the most widely used instruments to measure the perception of stress (Cohen et al., 1983). It determines the degree to which situations in one’s life are appraised as stressful, namely how unpredictable, uncontrollable, and overloaded is the life of the respondents. We used the short version of PSS, which is a four-item scale. Each item can be scored between 0-4, PSS scores
are calculated by reversing the scores of the second and third items, and then calculate the total score of the four items.
Sleep Beliefs Scale (SBS) investigate what the respondents think about the effects of selected behaviours upon sleep. It contains 20 questions on sleep knowledge through daily life (Adan et al., 2006). The SBS score ranges from 20 to 60, where higher score means better knowledge.
2.3 Procedure
A pilot study with 10 colleagues, including MSc/BSc students, was conducted to pre-test the reliability and legibility of the questionnaire. The pilot panel was asked to complete the questionnaire individually and record the time duration of completing it. Necessary modifications of the questionnaire were made after receiving the suggestions from the pilot panel.
We asked all of the BSc students who were present at the time of the data collection to take part in the survey. One of the researchers met the students before or after class. Students were informed about the research background and ethical considerations before completing the questionnaire. Filling out the questionnaire took approximately 15 minutes, during when, if any of the student asking questions about the questionnaire, the researcher answered it individually.
2.4 Statistical analysis
When all the questionnaires were collected, we coded and recorded the data in an Excel file. We used SPSS 21.0 (Chicago, USA) to do the statistical analysis. The level of significance was set at 0.05. Descriptive statistics were used to describe PSQI, PSS and SBS scale results. Kruskal-Wallis Test was used to compare the sleep components in different academic years. Independent t-test was utilized to compare the difference of sleep belief, perceived stress and sleep quality between females and males. In addition, linear regression adjusted for gender was used to investigate the relationship between sleep belief, stress and sleep quality.
3 Results
Thirty-two (38.5%) male students and 51 (71.5%) female students answered the questionnaire. More male students (56.25%) reported good sleep quality than females (41.2%).
By comparing the sleep components between different academic years, the non- significant result was found in all of the sleep components, which indicated that there is no difference between academic years regarding sleep components (sleep duration, sleep disturbance, sleep latency, day function due to sleepiness, subjective sleep quality and sleep medications). As showed in Table 1, all the significance levels were far from 0.05.
Table 1. Mean scores of sleep components in different academic yearsa,b PSQI
components 1st year 2nd year 3rd year 4th year p-value C1 0.86 ± 0.94 1.13 ± 0.74 0.96 ± 0.82 1.10 ± 0.83 0.73 C2 1.27 ± 1.03 1.29 ± 1.04 1.31 ± 0.88 1.46 ± 1.04 0.96 C3 0.77 ± 0.81 0.63 ± 0.88 0.77 ± 0.76 0.91 ± 1.14 0.83 C4 0.50 ± 0.91 0.57 ± 0.95 0.64 ± 1.04 0.73 ± 1.27 0.93 C5 1.23 ± 0.53 1.17 ± 0.38 1.19 ± 0.57 1.36 ± 0.50 0.74 C6 0.27 ± 0.77 0.25 ± 0.68 0.04 ± 0.20 0.27 ± 0.90 0.53 C7 1.14 ± 1.04 0.88 ± 0.68 1.08 ± 0.93 0.82 ± 0.75 0.64 C1: Subjective sleep quality, C2: Sleep latency, C3: Sleep duration, C4: Sleep efficiency, C5: Sleep disturbance, C6: Sleep medication, C7: Day function due to sleepiness a. Kruskal-Wallis Test
b. Grouping Variable: grade
Descriptive analysis of sleep belief perceived stress and sleep quality were performed.
The mean score of sleep belief was 43.0 (min. 30.0, max. 60.0; SD: 5.23). Perceived stress score ranged from 0.0 to 13.0, with a mean score of 6.30 (SD=2.61). The mean sleep quality score was 6.1 (min. 1.0, max. 14.0; SD=3.07).
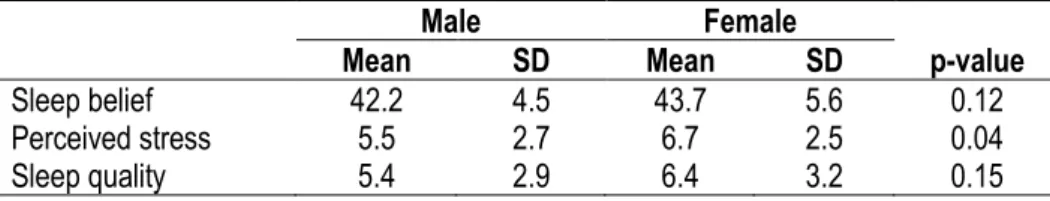
The difference in sleep belief, perceived stress and sleep quality between males and females were assessed. Perceived stress was statistically significant between males and females (p=0.04); however no difference was found in sleep belief (p=0.12) and sleep quality (p=0.15). Table 2 shows the result of the comparison of sleep belief, stress and sleep quality between genders.
Table 2. Comparison of sleep belief, stress and sleep quality between males and females
Male Female
Mean SD Mean SD p-value
Sleep belief 42.2 4.5 43.7 5.6 0.12
Perceived stress 5.5 2.7 6.7 2.5 0.04
Sleep quality 5.4 2.9 6.4 3.2 0.15
Linear regression was used to test the association between sleep belief, perceived stress and sleep quality. Sleep quality was the dependent variable. No significant result was found between sleep belief and sleep quality (p>0.05). The stress showed a statistically significant correlation with sleep quality (p<0.05). Table 3 shows the results in detail.
Table 3. The association between sleep belief, perceived stress and sleep qualitya Unstandardized
Coefficients t p-
value
95% Confidence Interval for B
B Std. Error Lower
Bound Upper Bound
Sleep belief -0.00 0.06 -0.00 0.99 -0.13 0.13
Perceived stress 0.28 0.13 2.20 0.03 0.03 0.54
a. Dependent Variable: Sleep Quality Score
4 Discussion
4.1 Sleep quality and college students
There was a big difference between the sleep quality of male and female students. The result was supported by Tsai’s research, which showed that gender differences in sleep patterns and sleep difficulties were remarkable in the group of young college students (Tsai, Li, 2004). A recent study also reported a high prevalence of sleep disorders in female students (Abdulghani et al., 2012). It is suggested to explore the reasons why female students experience more sleep problem. The academic year did not influences sleep quality components in our study, for which the reason can be the credit system.
4.2 Sleep belief and sleep quality
Sleep hygiene means all of those behaviours which can improve the quantity and quality of sleep (Stepanski, Wyatt, 2003), and it is based on sleep belief. The association between sleep hygiene and sleep quality has been researched in previous studies, and poor sleep quality was predicted by weak sleep hygiene variables (Brick et al., 2010).
Thus, the relationship between sleep belief and sleep quality is supposed to make sense in scientific research. Our results were in line with that where better sleep hygiene awareness does not necessarily guarantee better sleep quality (Voinescu, Szentagotai- Tatar, 2015). However, one sleep program showed that better sleep hygiene indicates less maladaptive beliefs about sleep (Kloss et al., 2015). The risk factors of sleep quality are diverse, such as mental health problems and irregular lifestyle (Lund et al., 2010).
4.3 Perceived stress and sleep quality
Students are exposed to a high amount of stress because of various reasons (e.g.
relationships and future concern), and this may have a negative impact on the quality of sleep and health, as our results showed it, too. It has been reported that psychological disorders are key factors responsible for the current sleep disorders among university students (Verlander et al., 1999). To guarantee the academic performance, it is essential to help the students to be physically and mentally healthy.
4.4 Limitation
Due to the fact that we investigated international students, potential culture habits on sleep may influence the results.
5 Conclusion
Male students sleep better than female students, and academic year do not seem to be associated with sleep quality in bachelor students. Health promotion program is highly suggested in order to improve sleep quality. However, based on our finding, there is not any association between sleep belief and sleep quality. Stress was closely related to sleep quality, so help students to improve their stress coping skills can help to promote their sleep quality, too.
Acknowledgement
The author Feifei Wang studied at the University of Debrecen where the data was collected, and now she is doing her PhD at Eötvös Loránd University by the time of submitting the manuscript. The authors would also like to acknowledge and thank all the lecturers at the University of Debrecen who helped to distribute and collect questionnaires in their classes and for the students who filled out the questionnaires.
References
Abdulghani, H., Alrowais, N., Bin-Saad, N., Al-Subaie, N., Haji, A., and Alhaqwi, A.
(2012): Sleep disorder among medical students: Relationship to their academic performance. Medical Teacher, 34(sup1), pp. S37-S41.
Adan A, Fabbri M, Natale V, and Prat G. (2006): Sleep Beliefs Scale (SBS) and circadian typology. Journal of Sleep Research.15(2), pp.125–132.
Ahrberg, K., Dresler, M., Niedermaier, S., Steiger, A., and Genzel, L. (2012): The interaction between sleep quality and academic performance. Journal of Psychiatric Research, 46(12), pp. 1618-1622.
Azad, M., Fraser, K., Rumana, N., Abdullah, A., Shahana, N., Hanly, P., and Turin, T.
(2015). Sleep Disturbances among Medical Students: A Global Perspective. Journal of Clinical Sleep Medicine. 11(01), pp.69-74.
BaHammam, A., Alaseem, A., Alzakri, A., Almeneessier, A., and Sharif, M. (2012): The relationship between sleep and wake habits and academic performance in medical students: a cross-sectional study. BMC Medical Education, 12(1), p.61.
Beiter, R., Nash, R., McCrady, M., Rhoades, D., Linscomb, M., Clarahan, M., and Sammut, S. (2015): The prevalence and correlates of depression, anxiety, and stress in a sample of college students. Journal of Affective Disorders, 173, pp. 90- 96.
Benington, J., and Frank, M. (2003): Cellular and molecular connections between sleep and synaptic plasticity. Progress in Neurobiology, 69(2), pp. 71-101.
Bosie, G., Tefera, T., and Hailu, G. (2012): Knowledge, attitude and practice with respect to sleep among undergraduate medical students of Mekelle University. Sleep and Biological Rhythms, 10(4), pp. 264-269.
Brick, C., Seely, D., and Palermo, T. (2010): Association Between Sleep Hygiene and Sleep Quality in Medical Students. Behavioral Sleep Medicine, 8(2), pp. 113-121.
Buysse, D., Reynolds, C., Monk, T., Berman, S., and Kupfer, D. (1989): The Pittsburgh sleep quality index: A new instrument for psychiatric practice and research. Psychiatry Research, 28(2), pp. 193-213.
Carskadon, M. (2011): Sleep in Adolescents: The Perfect Storm. Pediatric Clinics of North America, 58(3), pp. 637-647.
Cohen, S., Kamarck, T., and Mermelstein, R. (1983): A global measure of perceived stress. Journal of health and social behavior, 24, pp. 385-396.
Edinger, J., and Wohlgemuth, W. (2001): Psychometric comparisons of the standard and abbreviated DBAS-10 versions of the dysfunctional beliefs and attitudes about sleep questionnaire. Sleep Medicine, 2(6), pp. 493-500.
Gaultney, J. (2010): The Prevalence of Sleep Disorders in College Students: Impact on Academic Performance. Journal of American College Health, 59(2), pp. 91-97.
Gilbert, S., and Weaver, C. (2010): Sleep Quality and Academic Performance in University Students: A Wake-Up Call for College Psychologists. Journal of College Student Psychotherapy, 24(4), pp. 295-306.
Kloss, J., Nash, C., Walsh, C., Culnan, E., Horsey, S., and Sexton-Radek, K. (2015): A
“Sleep 101” Program for College Students Improves Sleep Hygiene Knowledge and Reduces Maladaptive Beliefs about Sleep. Behavioral Medicine, 42(1), pp. 48-56.
Lemma, S., Berhane, Y., Worku, A., Gelaye, B., and Williams, M. (2013): Good quality sleep is associated with better academic performance among university students in Ethiopia. Sleep and Breathing, 18(2), pp. 257-263.
Levenson, J., Miller, E., Hafer, B., Reidell, M., Buysse, D., and Franzen, P. (2016): Pilot study of a sleep health promotion program for college students. Sleep Health, 2(2), pp. 167-174.
Lund, H., Reider, B., Whiting, A., and Prichard, J. (2010): Sleep Patterns and Predictors of Disturbed Sleep in a Large Population of College Students. Journal of Adolescent Health, 46(2), pp. 124-132.
Morin, C., Stone, J., Trinkle, D., Mercer, J. (1993): Dysfunctional beliefs and attitudes about sleep among older adults with and without insomnia complaints. Psychology and Aging, 8(3), pp. 463-467.
Olds, T., Maher, C., Blunden, S., and Matricciani, L. (2010): Normative Data on the Sleep Habits of Australian Children and Adolescents. Sleep, 33(10), pp. 1381-1388.
Stepanski, E., and Wyatt, J. (2003): Use of sleep hygiene in the treatment of insomnia. Sleep Medicine Reviews, 7(3), pp. 215-225.
Sweileh, W., Ali, I., Sawalha, A., Abu-Taha, A., Zyoud, S., and Al-Jabi, S. (2011): Sleep habits and sleep problems among Palestinian students. Child and Adolescent Psychiatry and Mental Health, 5(1), pp. 25.
Tononi, G., and Cirelli, C. (2014): Sleep and the Price of Plasticity: From Synaptic and Cellular Homeostasis to Memory Consolidation and Integration. Neuron, 81(1), pp.
12-34.
Tsai, L. L., and Li, S. P. (2004): Sleep patterns in college students: Gender and grade differences. Journal of psychosomatic research, 56(2), pp. 231-237.
Verlander, L., Benedict, J., and Hanson, D. (1999): Stress and Sleep Patterns of College Students. Perceptual and Motor Skills, 88(3), pp. 893-898.
Voinescu, B., and Szentagotai-Tatar, A. (2015): Sleep hygiene awareness: its relation to sleep quality and diurnal preference. Journal of Molecular Psychiatry, 3(1), pp. 1.
Wolfson, A., and Carskadon, M. (1998): Sleep Schedules and Daytime Functioning in Adolescents. Child Development, 69(4), pp. 875-887.
Wolfson, A., and Carskadon, M. (2003): Understanding adolescent's sleep patterns and school performance: a critical appraisal. Sleep Medicine Reviews, 7(6), pp. 491- 506.
Zsuzsanna E. TÓTH – Vivien SURMAN
Developing a Service Quality Framework for a Special Type of Course
Abstract
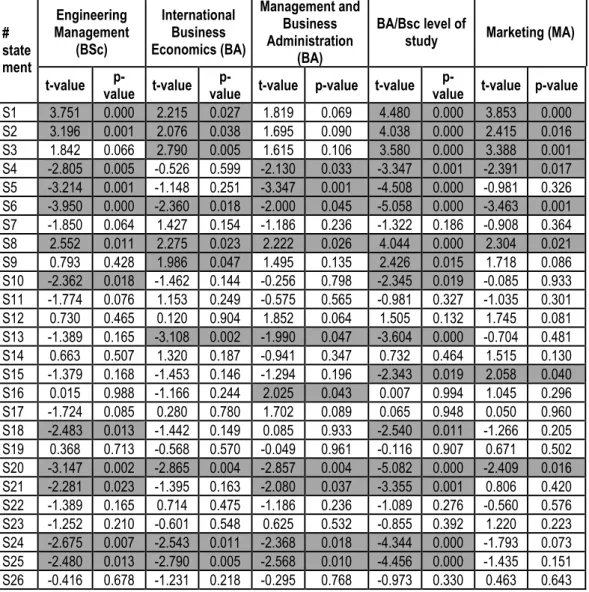
The main objective of the paper is the development of a service quality framework for a special course by appraising state of the art related to the measurement and evaluation of higher education service quality, particularly on the course level. By taking into consideration the similarities and differences between the various models put forward in the relevant literature and the features of the investigated courses, 26 statements were developed to measure service quality aspects of project work courses. The applied methodology utilizes the advantages of importance-performance analysis by using a 7- point Likert scale. Based on various statistical analyses in different segmentations of student feedbacks including different levels of study, study programs, project work courses and sub-departments, those statements are highlighted which can be considered as embedding critical to quality issues. The results are to be fed back to the related processes according to the ‘voice of students’ and combined with other quality management tools in order to better understand students’ expectations.
1 Introduction
In recent years, increasing attention has been paid to the education sector and the quality improvement of educational services (Lupo, 2013) due to the sector’s significantly strengthening economic impacts (Abdullah, 2006a, 2006b). However, it is a challenging task to find a widely accepted definition of quality in this sector (Khodayari and Khodayari, 2011). Therefore, service quality is also considered as a complex phenomenon (Qureshi et al., 2011) due to the great number of stakeholders including the
academic and non-academic staff, funding bodies, parents, companies, government and primarily students (Tam, 2001; Trivellas and Dargenidou, 2009; Rowley, 1997) and to the multidimensional role of the latter one in educational processes. Taking everything into account, the ‘amusement’ of direct customers is of the highest importance when defining service quality in higher education (HE) (Tang, 2002).
Many HE studies on service quality aspects have concentrated on effective course delivery mechanisms and the quality of teaching (see, e.g. Cheng and Tam, 1997;
Bourner, 1998; Athiyaman, 1997). There is a wide range of instruments in use to collect students’ feedbacks (Brennan and Williams, 2004). Course evaluations, completed by students usually at the end of a term, is considered as a feedback mechanism which pinpoints the strengths of courses and identifies areas of improvement. It should also help to reduce the gap between what the lecturers perceive and what the students perceive as the quality of teaching (Venkatraman, 2007).
In this paper, the development and the pilot application of a SERVQUAL-based course evaluation questionnaire are introduced, and the first results are demonstrated.
The Likert scale based questionnaire was developed for specific purposes, namely, the measurement and evaluation of service quality aspects in case of project work type courses which are not part of the traditional student evaluation of education (SEE) framework. As they may play an important role in the total student experience (resulting in a successful thesis work), it is of high importance to collect student feedbacks in order to implement the PDCA cycle for the related consultation and supervising processes.
The paper is structured as follows. Section 2 gives an overview of the relevant service quality literature in HE. Section 3 describes the main characteristics of project work type courses compared to traditional courses. Section 4 outlines the applied methodology, while Section 5 interprets the first results of that kind of survey application.
Section 6 summarizes the research implications and managerial conclusions. Finally, research limitations and possible future research directions are discussed.
2 Service quality issues in higher education
The definition and measurement of service quality (SQ) has been the subject of much debate over the last two decades (Dale, 2003) with particular attention to the development of valid, reliable and replicable measures of service quality (Dale, 2003;
Oldfield and Baron, 2000; Rowley, 1997, Kember and Leong, 2008). Therefore, it is a challenging and complex task to establish an appropriate model to measure the level of
(questionnaires) methods to collect students’ feedbacks (O’Neill and Palmer, 2004).
According to Clewes (2003), there are three major approaches: methods adapting the SERVQUAL instrument; methods applied for the assessment of teaching and learning quality and methods assessing total student experience.
The SERVQUAL model originating from the gap theory (Parasuraman et al., 1985) measures service quality initially with 97 statements in 10 dimensions which was later reduced to 22 statements with 5 dimensions in the final model (Parasuraman et al., 1988) which include the followings:
− Tangibles: physical facilities, equipment, appearance of personnel;
− Reliability: the ability to perform the desired service dependably, accurately, and consistently;
− Responsiveness: the willingness to provide prompt service and help customers;
− Assurance: employees' knowledge, courtesy, and ability to convey trust and confidence; and
− Empathy: the provision of caring, individualized attention to customers.
Owlia and Aspinwall (1996) were the first to offer an adaptation of service quality dimensions in higher education. Currently, there is still no general agreement on the measurement of SQ, or on the dimensions and their importance in the higher education context. Perceived service quality is undoubtedly of paramount strategic importance (Peters, 1992; Bemowski, 1991) in order to recruit and retain students and to enhance student satisfaction. As a result, the number of studies on the development and application of a HE specific SQ model is increasing. Most of the models use SERVQUAL as a basis, others utilize the methodology of SERVPERF based on the critics of the former one (see, e.g. Kincsesné et al., 2015; Teeroovengadum et al., 2016; Lupo, 2013, Abdullah, 2006a, 2006b). The model of HEdPERF (Abdullah, 2006a, 2006b), EDUQUAL (Mahapatra and Khan, 2007), HESQUAL (Teeroovengadum et al., 2016), COURSEQUAL (Kincsesné et al., 2015) and TEdPERF (Rodríguez-González and Segarra, 2016) are to be highlighted when discussing recent research on service quality in higher education.
A typical form of assessing service quality in this sector is focusing on course quality based on student feedbacks providing auditable evidence that students have the opportunity to comment on their courses and that such information is used to bring about improvements and encourage student reflection on their learning (Rowley, 2003;
Grebennikov and Shah, 2013). The studies with different cohorts of students conducted by Douglas et al. (2006), Grebennikov and Shah (2012), Gruber et al., (2010), Shah and Widin (2010) and Shah et al. (2010) confirm that student judgement of university experience is based on what happens within and beyond the classroom. Satisfied
students are likely to attend another lecture delivered by the same lecturer or opt for another module or course taught by her/him (Banwet and Datta, 2003). They also found that students’ intentions to re-attend or recommend lectures depended on their perceptions of quality and the satisfaction they felt after attending previous lectures.
The research on the measurement and evaluation of service quality in HE combined with course evaluations is still extensive. Studies are focusing merely on the application of SERVQUAL- or SERVPERF-based methodologies for course evaluation purposes. Stodnick and Rogers (2008) apply the SERVQUAL scale in the classroom by considering it as a narrower service encounter based on the premise that student perceptions of the overall university may not capture all the considerable variance. They claim that ‘if a student has one excellent instructor and one poor instructor and is asked about the quality of instruction at the university, they might answer ‘average’. While technically this is correct, it would be hard to use their response to make specific changes and improve service quality’. Kincsesné et al. (2015) established a SERVQUAL- based COURSEQUAL model including 24 statements in 5 dimensions evaluating each on a 5-point Likert scale. Four items were used to measure student satisfaction (1) perceived importance of the course content for the career of the student, (2) the course worth the need to pay tuition fee for the education, (3) the teacher’s education method increased the student’s interest towards the topic, and (4) overall satisfaction with the course. Udo et al. (2011) propose a modified SERVQUAL instrument to determine what factors influence their e-learning expectations of quality based on the fact that students and teachers play different roles than in traditional settings. Foropon et al. (2013) examine service quality provided in the classroom by applying the SERVQUAL instrument in two operation management courses. Adedamola et al. (2013) measure students' satisfaction with classroom facilities using the SERVPERF scale in case of Nigerian private universities.
Harvey (2011) acknowledges that it is important for universities to have effective mechanisms for collecting feedback data; however, it is even more inevitable for them to ensure they have in place an appropriate action cycle, in which the focus is not on the results but on using them for improvement purposes and for sustaining change.
3 Characteristics of project work courses
Fulfilling different levels of project works is an obligatory part of the curricula for hundreds of BA and MA students at the Faculty of Economic and Social Sciences. Project works are complex courses; the fulfilment of the detailed tasks is based on the execution of
accomplished either individually or in small teams. The primary aim of these courses is to solve real-life problems, carry out complex solutions utilizing the knowledge of previous studies by taking part in relevant organizational projects. During the semester students are to accomplish the different tasks set for that period by regularly consulting about the progress with assigned lecturers as consultants and presenting their milestones in the form of oral reports during or at the end of the semester. The output of each semester is a written paper which is evaluated according to specific aspects.
In case of BA or BSc programs, there are two or three levels of these courses depending on the type of the program, while in case of MA and MSc programs one semester of project works are to be accomplished before writing the final thesis. The goals of the different levels of project works vary as these courses are successive steps of the process which coach students how to write a thesis. During both fulfilling the project works and the thesis, students have to demonstrate that they can apply specific methodologies, tools and methods in a professional way when solving a real-life problem.
During these semesters, students work under the guidance of a consulting supervisor employed at the department to which the topic of the project work is professionally related. The consultant’s role is to offer a partnership by assisting the student through the flow of project works and thesis with suggestions and recommendations by regularly discussing the different steps. After the students completed and uploaded the written results of their project work, they prepare an oral presentation where their semester-long work processes and results are presented.
In case of these courses, there are many differences compared to traditional courses. Students work on the accomplishment of different tasks with their consultants.
They deal with various topics and real-life organizational problems with different lecturers from different departments. Students are provided individual attention during the semesters as they work together in a close partnership. Moreover, these courses are significant parts of the curriculum in a given program, and a thesis for students can serve as a basis of choosing a specific career and finding a job. During project works, students can master the necessary professional knowledge and those inevitable soft skills which are needed to be successful in the labour market. Based on the aforementioned, in case of project works most of the existing and widely used course evaluation methods are not working due to their unique characteristics.
4 Survey development
Our primary aim was to develop a SERVQUAL-based methodology to collect and analyse student feedbacks in case of project work courses. The following questions have
naturally arisen when analysing the requirements and perceptions of students: Is there any difference between lecturers? Is there any difference between the subgroups of the department embodying different professional knowledge and project work topics? Is there a significant difference between the requirements of students studying in different programs or at different levels?
The survey applied for the measurement and evaluation of the service quality of project work consultation consists of 26 statements which are listed in Table I. In this paper the importance of the statements and the consultant’s semester-long performance level is analysed with importance-performance analysis. Therefore, students were asked to express their opinion in two dimensions, namely, scoring the importance and the performance related to each statement using a Likert scale from 1 through 7, where score 1 stands for the lowest, and score 7 for the highest value in both dimensions. The performance dimension of a statement reflects how much the students are satisfied with the performance in the particular field addressed by the statement, while the important dimension is used to proclaim how much they consider important the addressed topic.
Cronbach-alphas were used to estimate the degree of reliability. Overall reliabilities were α=0.932 and 0.95 respectively for the importance and performance scales. α=0.95 was the overall reliability for both the importance-performance difference scores and importance * performance scores. These reliability measures exceeded the usual recommendation of α=0.70 for establishing internal consistency of the scale; therefore, the reliability of the scale was confirmed.
Table 1. Survey questionnaire
1 - 7 S1 - The guidelines related to the content requirements of the project work
are clear and can be well used. 1 - 7
1 - 7 S2 - The guidelines related to the formatting requirements are clear and can
be well used. 1 - 7
1 - 7 S3 - Consultant feedbacks on the different phases of the project work are provided both in an interpretable way and form. 1 - 7 1 - 7 S4 - The consultant offers appropriate, suitable consultation opportunities. 1 - 7 1 - 7 S5 - The consultant uses up-to-date tools and methods during consultations
and when giving feedbacks. 1 - 7
1 - 7 S6 - Consultations take place in a calm environment with appropriate
conditions. 1 - 7
1 - 7 S7 - The consultant keeps the jointly agreed deadlines, which supports the continuous progress of the project work. 1 - 7 S8 - The consultant is ready to help with the problems arising from the