Unique Physicochemical Patterns of Residues in Protein-Protein Interfaces
Tamas Lazar
1,2, Mainak Guharoy
1,2, Eva Schad
3, Peter Tompa
1,2,3,*1
VIB-VUB Center for Structural Biology, Vlaams Instituut voor Biotechnologie, Pleinlaan 2, 1050 Brussels, Belgium.
2
Structural Biology Brussels, Vrije Universiteit Brussel, Pleinlaan 2, 1050 Brussels, Belgium.
3
Institute of Enzymology, Research Centre for Natural Sciences, Hungarian Academy of Sciences, Magyar tudosok korutja 2, 1117 Budapest, Hungary.
KEYWORDS: physicochemical patterning, protein interface, surface patches, binding specificity, interface propensity.
ABSTRACT: Protein-protein interactions can be characterized by high-resolution structures of
complexes, from which diverse features of the interfaces can be derived. For the majority of
protein-protein interactions identified, however, there is no information on the structure of the
complex or the interface involved in the interaction. Understanding what surface properties drive
2 certain interactions is crucial in the functional evaluation of protein complexes. Here we show that the local patterning of the physicochemical properties of amino acids within surface patches is characteristic of interfaces. To describe this feature in a quantitative manner, we have defined a statistical potential, iPat, as a measure of surface patterning. iPat, which does not take evolutionary conservation or knowledge of the interaction partner into consideration, represents a function principally different from algorithms that consider intermolecular contacts. We assess its suitability for characterizing protein and peptide interfaces, and we demonstrate that iPat is uniquely descriptive for interfaces of proteins that undergo large conformational changes or that are involved in the binding of intrinsically disordered protein (IDP) partners. We suggest that as a stand-alone propensity or in combination with other features, iPat represents a new feature in analyzing the functional binding specificity of protein-protein interactions that has better predictive potential than other simple 1D features, such as hydrophobicity or stickiness.
1. Introduction
Macromolecular interactions involving proteins are central to cellular functions [1]. Studying protein- protein interactions to achieve an understanding of the underlying physicochemical principles have been in the focus of many studies at both the molecular and cellular levels [2–4]. The living cell represents a highly crowded environment, influencing the propensities of proteins to interact and also potentially promoting promiscuous binding [5,6]. Cells mitigate promiscuous, non-functional interactions by fine-tuning protein interfaces [7,8], and tightly regulating spatio-temporal aspects of protein abundance [9–11] for optimal affinity and specificity of interactions. Evolution has fine-tuned amino acid composition, solvent accessibility, geometry (shape complementarity, planarity, packing density) and physicochemical features
(hydrophobicity, stickiness, electrostatics, polarity, polarizability, amphiphilicity) of protein surfaces that mediate partner recognition [8,12–20]. An important goal of structural bioinformatics is to develop models based on these properties for the reliable description and prediction of binding sites on the protein surface.
It is known for a long time what biophysical forces drive protein-protein interactions, and what roles different residues with different properties can have in mediating the formation of protein complexes [2].
Many analyses have addressed the principal role of hydrophobic interactions in protein-protein associations [21–24] demonstrating obvious preferences but concluding that this parameter alone is not sufficient to describe interacting surfaces. It has been described in detail that charged and polar residues represent a significant fraction of interfaces and they can stabilize - while also enhance the rates of – protein-protein association [25]. Taking into account the effects of different residue types, amino acid propensities are also often calculated to assess protein binding, since they can have specific signatures on interface patches, discriminating them from the general surface or the interior of the protein [2,24,26]. Levy and colleagues attempted to derive a general propensity scale by showing that interface regions tend to be enriched or depleted in specific amino acids relative to surface regions, distilling a ‘stickiness’ scale [16], shown to be instrumental in identifying surface regions enabling homooligomerization [27].
As appears from these examples, statistical measures relying on single-residue features, such as hydrophobicity, stickiness, electrostatics, polarity, polarizability and amphiphilicity, have some power in discriminating interfaces from general surfaces. Machine learning approaches usually outperform these measures in predicting interfaces, but the exact physical picture of what lays behind specific interactions cannot be always uncovered. Here, we thought that a unique pattern of amino acids (amino acid features) on the surface characterizes interfaces better, as they encode specific surface information that can only be recognized by the cognate interaction partner. To approach this feature in a quantitative manner, we aimed to characterize protein-protein interfaces (or interface patches) by a function describing patterns of amino
4
acid properties. This function, “interface patterning (iPat)” is a residue-pair pseudo-potential which measures the propensity of surface residues with different properties (hydrophobic, polar, negative or positively charged) to be positioned around a central residue with a given property. iPat, computed for all residues on the protein surface, shows biases for regions corresponding to recognition sites, and it can score intramolecular contacts for each protein partner independently, without prior knowledge on the binding partner or intermolecular contacts.Our main finding is that iPat can distinguish surface residues involved in protein-protein or protein- peptide recognition interfaces from those located on the non-interacting surface better than a single-feature propensity scale such as hydrophobicity or stickiness. We suggest that its simplicity and performance should make it a useful complement to existing features and propensities for investigating the specificity of protein-protein interactions.
2. Results
In this work, we explore the physicochemical patterning of residues on protein surfaces (in terms of their side-chain properties, illustrated in Figure 1) and assess the applicability of this feature to discriminate between binding- versus non-binding surface patches on protein structures.
2.1. Description of the iPat (interface patterning) function
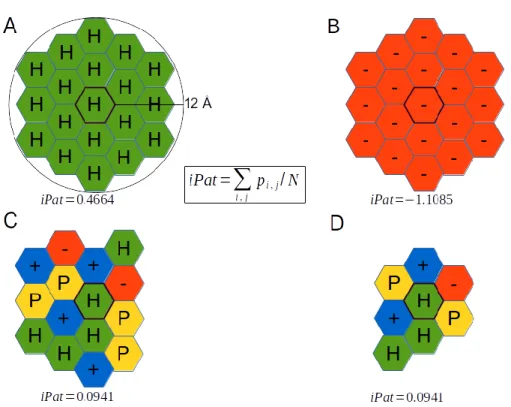
Referred to as ‘iPat’, this interface physicochemical patterning score measures the average propensity of residue types on the protein surface (Eq 1), grouped into hydrophobic, polar, negative and positively charged categories, to be located within a 12Å radial distance around a central residue with a given property (Figure 1). It is to be noted that a more powerful and sensitive function of surface patterning could be developed from amino acids (instead of amino acid types), but due to the combinatorial complexity that
would arise, it would be statistically untenable. Figure 1 illustrates the range of possible iPat values, computed for toy examples of different residue environments. As seen, a residue environment comprised entirely of hydrophobic residues (‘H’) acquires an iPat value of 0.4664; such a local residue environment may, for example, be found in the interfaces of high-affinity obligate homomers [2]. In contrast, a local residue neighborhood comprising only negatively charged residues yields an iPat value of -1.1085. An environment comprising mixed residue types with different properties will yield intermediate iPat values (e.g. 0.0941).
Figure 1. Scheme illustrating iPat
score calculations for different patches
(A) Patch consisting of only hydrophobic residues have a high iPat potential. (B) Patch consisting of only negatively charged residues have a low iPat potential. (C) Patch consisting of all types of properties have an intermediate iPat potential. (D) Since iPat is an intensive measure, patches with the same composition must have identical iPat potential. H: hydrophobic, P: polar uncharged, +: positively charged, -: negatively charged.
6
iPat values were calculated using a large, homology-filtered set of 1307 protein complexes downloaded from PDBSelect [28]. 90% of iPat scores (Eq 2-3) are between -0.7150 and 0.2122, but there are residues with iPat values reaching the theoretical maximum (iPat = 0.4664), i.e., corresponding to central hydrophobic residues surrounded entirely by other hydrophobic residues. Furthermore, the lowest value in the training set is not the theoretical minimum (iPat = -1.1085), but it is slightly higher (-1.0545), due to the presence of opposite charges or negatively charged/polar uncharged pairs in addition to pairs of negatively charged residues.Next, we compared the relative iPat pair frequencies between residues forming the interface core and the non-binding surface. These propensities are computed using Eq 2 (Materials and methods) and are depicted in Figure 2 as the relative frequencies of physicochemical pairings of residues (with 4 different properties) in the local environment of non-interface surface residues and in the local environment of completely buried interface residues (interface core). These relative frequencies were derived from the interfaces of the training set of 1307 protein complexes (see Materials and methods).
Figure 2. Heatmaps showing the propensities and observed frequencies of different
physicochemical properties for residue pairs found within surface patches constructed using 12Å radius.
(A) The propensity of residues with each of the 4 physicochemical properties (H: hydrophobic, P: polar uncharged, +: positively charged, -: negatively charged) within the cutoff distance from interface core residues of a given property. The propensities were computed as the log-ratio of the frequencies of observing the same types of contacts for residues on the protein surface not involved in binding (B) and the corresponding frequencies computed for interface core residues (C). For details see Eq. 2 of Materials and methods.
iPat was then used to contrast the properties of interfaces versus the non-binding surface. It was assessed if iPat can: 1) discriminate between residues that form known protein-protein interfaces and surface residues that are not part of known interfaces; 2) discriminate between residues in known (functional) interfaces and those involved in non-functional crystal contact interfaces, and, 3) discriminate between interface residues derived from known protein-peptide complexes and non-binding residues on the surface of peptide-binding domains.
Further, we derived the iPatprot (Eq 4) score measuring the difference of iPat values between the interface core and the surface of a protein, and evaluated its applicability to protein systems in which large conformational changes occur upon complex formation. Last, we provide a comparison of iPat with two one-dimensional residue propensity scales (Kyte-Doolittle hydrophobicity and stickiness), and show that this higher-order feature overcomes 1D propensity scales in discriminating interfaces from non-interacting surfaces.
2.2. Discriminating between interface residues and residues on the protein surface
8
A) Functional interfaces in protein complexesTo evaluate the potential of iPat in discriminating between interface residues and surface residues not involved in binding, we compared the distribution of iPat values of residues in the interface core to that of non-interface residues on the protein surface.
To this end, we applied iPat to proteins in the 1307 and 455 complexes of the training set and test set, respectively. Patches of iPat usually consist of 15-16 residues (AVG=15.41, SD=4.27, by limiting neighborhood of a central residue to surface residues within C – C distance of 12Å, cf. Materials and methods) and this number for the local environments of interface and non-interface surface residues does not differ. However, we investigated whether the number of residues in patches correlated with iPat scores but we did not find any significant linear correlations.
Figure 3 shows that significantly higher iPat values characterize the local environment of interface core residues (for definition, we used a burial threshold of >75% to assign the interface core residues, while the rest is assigned as rim residues) than of residues on the remainder of the protein surface, for both the training set (Figure 3A, p-value < 10-100, U-test), and the test set (Figure 3B, p-value < 10-100, U-test). These differences show that interfaces are characterized by property patterns distinct from those of the protein surface overall.
Figure 3. Distribution of iPat values of residues in the interface core and on the non-binding
surface in different data sets
(A) Training set; (B) Test set; (C) Crystal contact set; (D) Disordered protein/peptide set. For all complexes, we distinguished residues that belong to the surface or the interface. In all the sets, interface core residues (without the rim) had significantly higher iPat values computed for their local environments (residue C
α
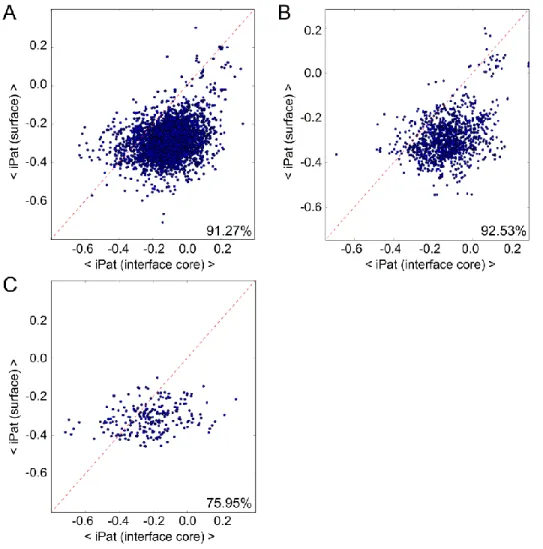
atoms closer than 12Å) than non-binding surface residues. Residues in interface cores of crystal contacts have significantly lower iPat scores than of functional interfaces. All p-values in U-test were very significant (see in the Results). Red lines show the medians and red diamonds show the mean values of the distributions on the box plots.By averaging the per-residue iPat values over all the residues in each type of environment, e.g. interface core and protein surface, respectively, we found that 91.27% and 92.53% of the protein chains in the training and test sets, respectively, had higher average iPat values for the interface core than for the non- binding surfaces (Figures 4A-B, p-value < 10-100, Wilcoxon signed-rank test). By further analyzing the few outliers of the test set, we found that the interface core of proteins with unsuccessful classification had
10
exceptionally lower (34.9% vs. 53.5%) while the non-interface surface much higher (40.5% vs. 32.7%) fraction of hydrophobic amino acids.Supplementary figure S1 shows a nice example for a homotrimeric enterotoxin complex, where two interfaces on the same protein structure have very different physicochemical patch composition (one is a charged interface, the other is a classical hydrophobic interface), thus the first is much less interface-like than the second (Fig. S1B) (even less interface-like than the general surface (Fig. S1A)). Interestingly, the general surface of the enterotoxin has many more residues having interface-like local environment, and indeed by mining PDB, one can identify one of these patches as being a binding site of a protein called claudin-4 (Fig. S1C-D).
Figure 4. Scatter plots of average iPat values for all interface core residues and non-binding
surface residues in individual protein chains of the analyzed data sets
For all complexes, we distinguished non-binding surface- and interface residues, and determined their iPat scores. For each protein, the average of scores of their non-binding surface vs. the average of scores of their interface core residues was plotted. Interface core residues (without the rim), on average, have significantly higher values than non-binding surface residues in both the training set (A) and the test set (B). In the training set 91.27% while in the test set 92.53% of the chains had higher iPat values for the interface core than for the non-binding surface. For crystal contacts (C), this trend was much less prominent, only 75.95%
of the chains had higher iPat values for the interface core than for the non-binding surface.
12
These observations indicate that the interface core within functional interfaces have a significantly different physicochemical patterning than non-binding surface residues. This is further illustrated by the average contributions of each of the property pair terms of the statistical potential to the iPat scores computed for surface and interface residues (Figures 2B-C). Fig. 2A indicates that the environment of interfaces residues is characterized by a more significant contribution of HH and much less of PP, whereas P+, P-, +-, and -- pairs are less frequent in the interface core.B) Functional interfaces versus crystal contacts
Next, we compared the iPat scores of nonspecific crystal packing contacts (of core residues involved in the contacts), denoted as “crystal interfaces” to that of core residues within functional protein interfaces and of surface residues, respectively. Figures 3A-C show that iPat scores of interface core residues tend to be higher than those of crystal interfaces (p-value = 4.18*10-93, U-test), which, in turn, are significantly higher than those of non-binding surface residues (p-value = 7.73*10-58, U-test).
A comparison of the averages of iPatvalues of crystal contacts to those of surface residues for individual proteins in the dataset shows that only 76% of the proteins in the data set of crystal contacts display higher scores for their interfaces (Figure 4C) compared to about 92% of the proteins in the data set of functional interfaces (Figures 4A-B). This smaller fraction of proteins, which display higher average iPat values for residues in crystal-contact interfaces than on the protein surface, is not surprising, given the much weaker and non-specific character of crystal contacts [8]. On the other hand, the fact that a large fraction of residues in crystal contacts still display higher iPat values than surface residues, indicates that these contacts are governed by the same physical principles as the contacts in functional interfaces, and probably involve regions of the protein surface that feature some propensity to interact, albeit weakly. Trends of this propensity can be gleaned from plots of the average contribution of each of the property pair terms of the pi,j statistical potential to the iPat scores computed for core residues in crystal contacts (Figure S2).
C) Interfaces of protein-peptide complexes
It has been well documented that intrinsically disordered proteins/regions (IDPs/IDRs) often engage in protein-protein interactions, mediated by short motifs or elongated domain-like regions [29]. These interacting regions are frequently made up of a continuous stretch of conserved amino acids in the polypeptide chain bound to structured domains [30]. Therefore, we also examined the extent to which iPat can discriminate between protein interfaces of structured domains that bind IDPs/IDRs, because IDPs/IDRs often undergo large-scale structural rearrangements (disorder-to-order transition or induced folding) upon binding [29]. Generally, protein-peptide interactions are thought of having lower affinities than those between structured subunits, especially when the bound peptide segments are short [31]. It is therefore of particular interest to see if these properties are reflected by particular trends in the iPat values.
Interestingly, a comparison of the distribution of iPat scores of core residues in the interfaces of the globular partner for 50 protein-peptide complexes (see Materials and methods) to those of surface residues shows that peptide-binding interfaces are also characterized by significantly higher iPat values than surface residues (Figure 3D, p-value = 3.05*10-27, U-test). Nevertheless, when plotting iPat values averaged over core residues in these interfaces against those of surface residues for individual complexes, only 78% of the subunits feature higher average scores, a proportion much closer to that of crystal contacts (76%) than globular interfaces (~92%). In spite of that, there is a statistically significant difference between the iPat score distributions of peptide-binding interfaces and crystal contact interfaces (p-value = 2.33*10-4, U-test).
2.3. Robustness to conformational changes
We derived iPatprot, an iPat-based scoring function, which reflects how different the physical patterning is for the interface than for the surface of a protein (see in Materials and methods). Since proteins can
14
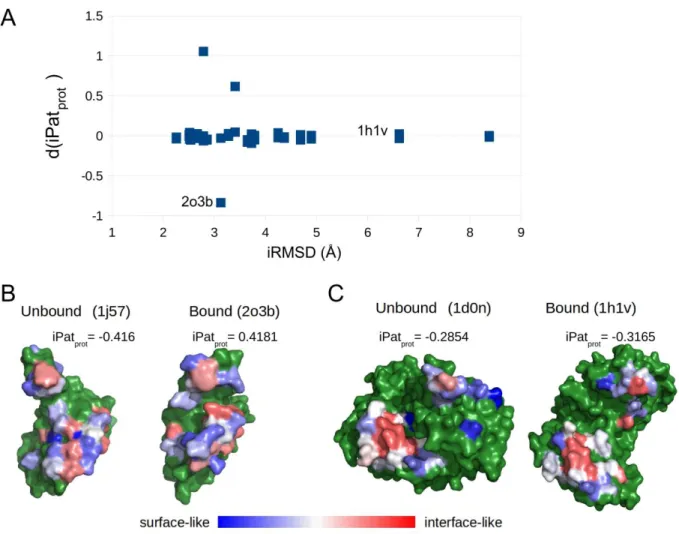
undergo large conformational changes, which is known to seriously compromise many bioinformatics applications, we tested how much the interface iPat score is affected the conformational transition between the unbound and the bound conformations. Pairs of structures were compared in their bound and unbound forms and the interface conformational change was characterized using an interface RMSD (iRMSD) value.The results show (Figure 5A) that – aside from a few exceptions – even large conformational changes (interface RMSD ≥ 2.26Å, defined by Protein-protein docking benchmark 5.0) at the interface had only negligible effect on the iPatprot scores, with no apparent effect on the iPat score even at higher iRMSD values. This robustness to conformational changes at the interface may stem from the fact that the iPatprot
function scores surface patches of the individual interacting subunits, rather than the intermolecular contacts (and other features of the binding interface between different subunits). Since a fraction of amino acids in interface patches are covalently bonded and moves like a kinematic chain, usually an interface patch has less degrees of freedom than intermolecular contacts in general.
Figure 5. Changes in iPatprot
scores due to conformational changes upon binding (measured in iRMSD) using the Protein-Protein Docking Benchmark 5.0 (dimeric difficult targets) data set
(A) Difference in the iPatprot scores calculated for the pairs of unbound and bound structures as the function of iRMSD. In most of the cases, a large change of the interface structure does not affect the iPatprot score.There are 3 outliers in this plot: two in the positive direction (PDB: 2ot3_A ← 1txu_A, 1fq1_B ← 1b39_A), meaning that the interface resembles the non-binding surface in the unbound state; and one in the negative direction (PDB: 2o3b_B ← 1j57_A), meaning that the interface core is already “interface- like” in the unbound form.
(B) Sugar-nonspecific nuclease inhibitor from Nostoc sp. in the unbound (PDB: 1j57_A) and bound (PDB: 2o3b_B) states in complex with nucA nuclease, with the iPat scores projected onto the surface. In
16
both panels, the sugar-nonspecific nuclease inhibitor is colored and rotated to the same orientation (by superposition). The blue-red color scale ranges from the theoretical minimum to the maximum of iPat score. Non-binding surface residues are colored with green.(C) Gelsolin fragment (aa. 412-742) in the unbound (PDB: 1d0n_B) and bound (PDB: 1h1v_G) states in complex with actin, with the iPat scores projected onto the surface. In both panels, the gelsolin is colored and rotated to the same orientation (by superposition). The blue-red color scale ranges from the
theoretical minimum to the maximum of iPat score. Non-binding surface residues are colored with green.
Within each interacting patch, the residues in general tend to preserve the same surrounding local physicochemical environment even when a large conformational change accompanies the binding event.
Only one exception was found in which the interface core residues of the unbound form were harder to differentiate based on their physical patterning. Comparing the iPat potentials projected onto the surface of the unbound structure of the Nostoc sp. sugar-nonspecific nuclease inhibitor (1j57_A) and its bound structure in complex with nucA nuclease (2o3b_B) (Figure 5B), there are clear differences between the two states. There is a visible conformational rearrangement in the non-interface and interface regions (iRMSD
= 3.13Å) that has a substantial effect on the iPat scores. Interestingly, in the unbound form, residues of high- and low statistical potential are intermixed on the surface, due to which the interface of nucA is harder to distinguish. In the case of the bound form, a bit less interface-like residue environments with the higher potentials (red) can be seen in the interface. Except for this special case, iPatprot performs very well for the rest of the targets. An example (Gelsolin : Actin, PDB: 1h1v) of extreme conformational change (iRMSD
= 6.62Å) is shown in Figure 5C, demonstrating the robustness of iPatprot score.
2.4. Comparison of iPat to one-dimensional propensity scales
The central idea behind the iPat potential is that interfaces not only have special physicochemical characteristics, they also carry unique information in the pattern of their residues, which may ensure discrimination between a given surface patch (interface) and a sea of competing, non-specific surfaces. In accord, this specific arrangement of residues can carry more information than the propensity of residues and/or their physicochemical properties. To demonstrate this conjecture, we compared the performance of iPat in discriminating interfaces and surfaces to two propensity scales often referred to in interpreting interface characteristics and specificity: stickiness [16] and hydrophobicity [32].
In these comparisons, we found that interface residues (with the rim included), on average, had significantly higher iPat values than non-binding surface residues (85.3%) (Figure S3A). In a collection of protein complexes with disordered protein/peptide binding sites, 67.81% of the chains had higher iPat values for the interface (Figure S3B). On the other hand, less than half of the chains had higher average stickiness or hydrophobicity values for the protein-protein and protein-peptide interfaces than for the non- binding surface (Figures S3C-D), although the same statistics restricted to the interface core gave a separation similar to iPat for stickiness and hydrophobicity as proteins had a stickier and more hydrophobic interface core than non-interacting surface (91-94% for protein-protein interfaces and 79-85% for disordered protein/peptide binding sites).
Analysis of the predictive power of iPat, compared to the other two propensity scales, yielded better results in the Receiver Operating Characteristic (ROC) analysis for all true positive and false positive rate cutoffs on our test set (Figure S4). Areas under the curves (AUCs) are comparable for hydrophobicity and stickiness, but AUC for iPat was better for both the interface core vs. non-interface distinction (0.65 vs.
0.60) and total interface vs. non-interface distinction (0.60 vs. 0.55). Although this performance is still lower than the performance of multi-feature interface predictors, it clearly points out that going beyond a 1D scale, by incorporating information coming from the local environment of a residue, has obvious benefits.
18
3. Discussion
Although deciphering the problem of protein recognition is actively pursued in molecular biology for decades, the case is far from being solved. With the explosion of high-throughput approaches in generating sequence, structure and interaction data, in silico characterization of protein binding sites plays increasingly important roles in the exploration of the protein-protein interaction space. This intensifying activity puts increasing demand on expanding the toolkit of protein interface analysis, in an attempt to bridge the gap between the number of monomeric structures solved or the number of interactions discovered and the number of protein complexes described at atomistic detail. Two particular, important aspects of interface analysis are that i) a large fraction of protein-protein interactions is mediated by IDPs, which lack well- defined structures in the unbound state, and that ii) judging the specificity of interactions is a complex and context-dependent problem.
Here, we introduce a novel concept in interface analysis, by suggesting that residue patterns may carry information on the uniqueness of a given surface region. We approach this feature by a statistical pseudo- potential, iPat, derived from amino acid (property) pair propensities. iPat measures the physicochemical patterning of surface patches, with the underlying assumption that functional, specific protein-protein interactions are mediated by surface regions (interfaces), that have a specific and non-random patterning different from that of competing non-binding surface patches. It is important to emphasize that iPat does not look at protein-protein contacts but considers the unique features of individual interacting proteins, which makes it distinct from other interface- and interaction scoring algorithms.
We verified the applicability of iPat for the recognition and characterization of interfaces by showing its ability to distinguish them from non-binding surfaces and non-specific crystal contacts. Its performance suggests its potential suitability in a broad spectrum of interface analysis applications. In addition, its
insensitivity to structural flexibility and conformational changes upon complex formation can be a significant benefit in studying specificity of interactions mediated by disordered regions of IDPs/IDRs, for example. This robustness most probably is achieved by the strategy of scoring the two subunits separately instead of scoring the contact observed in the complex.
The higher-than-random scores of crystal contact interfaces can be rationalized by the fact that proteins can have multiple, not yet discovered, interface regions at crystal contact sites, i.e. that they have some inclination to engage in protein-protein interactions, probably expressed in their behavior under crystallization conditions. In accord, it was recently proposed that the surfaces of proteins are largely covered (up to three-quarters of their area) by protein binding patches [33], and also that the surprisingly slow evolution of the physicochemical properties of protein surfaces can be accounted for by their extensive, mostly uncharacterized, functional interactions with other proteins (giving rise to the concept of
“quinary” structure) [34].
In all, the statistical analyses and the examples detailed here show that iPat expresses a special and specific feature of surfaces engaged in protein-protein interactions, and it may turn out to be a useful tool in assessing binding specificity and functional and evolutionary studies of protein-protein interactions. The main assets of using iPat derive from it being: i) quick, simple and transparent (and yielding a score amenable for structural-functional interpretation), ii) robust to conformational changes induced by binding (up to very high levels, on the order of 2-9Å), and iii) applicable even in the absence of information about the exact partner of the query structure.
Altogether, these favorable characteristics mean that the function can be easily combined with other features (such as structural complementarity, atomic packing or evolutionary information) and can be incorporated into practical applications, such as protein docking or interface prediction, in the future.
20
Moreover, the function could be reparameterized to characterize other types of protein interfaces, such as binding sites of small ligands, DNA or RNA.4. Materials and methods
4.1. Data sets of protein complexes for deriving and testing the iPat statistical potential
Training set: In order to define interface and non-interface residues on protein surfaces and compute the
statistics on the “patterning” of physicochemical properties of amino acids in the two types of environments, a data set of protein-protein complexes was compiled as follows. PDB entries corresponding to proteins displaying sequence identity not exceeding 25% [35] were downloaded from the Nov 2012 version of PDBselect [28]
.
Only X-ray structures of protein-protein complexes, determined at a resolution of 3.5Å or better, with < 5% of unresolved residues, and whose subunits comprise at least 40 residues were retained.The resulting data set comprised 1307 complexes listed in S1A Table. For each complex, atomic coordinates corresponding to the biological assembly (“biological assembly 1” description provided by the PDB) were downloaded.
Test set: A set of protein complexes not included, or only distantly related, to the proteins in the training
set was derived as follows: X-ray structure of protein-protein complexes, with resolution of 3Å or better, deposited in the PDB after November 2012 (following publication of the PDBselect data set used above) were downloaded. Homologous sequences were filtered out using a 25% sequence identity thresholds based on HSSP files [35], followed by a standard CD-HIT [36] 30% sequence identity filter. The second filtering step was required because HSSP files were not available for some newer PDB entries. This yielded a test set comprising 455 complexes listed in S1B Table.
Data set of crystal packing interfaces: To test the extent of discrimination between interfaces of
biological assemblies and crystal packing interfaces, a set of crystal packing interfaces was assembled from two data sets. The first data set comprised 87 dimeric crystal interfaces representing non-specific dimers from Bahadur et al. [37] with interface areas larger than 800Å2 (contributed by both subunits). The second was the Duarte-Capitani data set (DCxtal) [38] which comprises large crystal contacts with buried interface area of at least 1000Å2 (per subunit). As a quality control step, we used the PISA [39] and EPPIC [38] web servers to remove interfaces corresponding to an inferred biologically assembly from the DCxtal data. If both servers predicted a dimer to be a biological assembly, or if the crystal contact was not found in the asymmetric unit, the entry was removed. In total, only 25 entries from DCxtal were retained. The final data set comprised 111 crystal dimers listed in S1C Table.
Data set of protein-peptide complexes: Co-crystal structures of globular protein domains bound to peptide
fragments belonging to intrinsically disordered proteins/regions (IDPs/IDRs) were downloaded from the PDB. Limits of disordered regions were inferred from the amino acid sequences in the DisProt 7.0 [40,41]
database. The retrieved data set was then manually pruned to remove disordered regions gaining proper tertiary fold upon binding. The final set contained a total of 50 protein-peptide complexes listed in S1D Table.
Data set of protein complexes where the subunits display conformational changes upon association: To
evaluate the robustness of our score to conformational changes of protein subunits upon association, we used structures from the Protein-protein docking benchmark 5.0 [42]. This benchmark provides structures of both isolated subunits and their complexes along with the interface root-mean-square deviation (iRMSD) values. For the ‘difficult’ dimeric complexes (iRMSD at least 2.26Å), we calculated the scores for both the bound and unbound structures after mapping the interface residues of the bound subunits onto the corresponding unbound protein structure.
22 4.2. Definition of surface and interface residues
Surface residues in a protein are defined as residues having a solvent accessibility of at least 10%.
Accessibility values were computed using STRIDE [43] as follows:
Accessibility(aa) = ASAp (aa) / ASAref (aa) (1)
where ASAp(aa) is the solvent accessible surface area of the amino acid residue (aa) in the protein (subunit or complex), and ASAref(aa) is the solvent accessible surface area of the same amino acid (aa) in the Gly- aa-Gly tripeptide [44].
Residues belonging to a binding interface are defined as residues that lose accessible surface area upon complex formation, as compared to the unbound state of the protein subunit. Interface residues were separated into 2 classes, core residues and rim residues, using the definition of Schärer [45], which employs a percent burial threshold to assign the core residues. Here, we chose this threshold as greater than 75%
burial (i.e., Accessibility (aa) ≤ 25%). In a few complexes that had no core residues in their interface, the interface rim was used for the analysis.
4.3. Deriving the iPat score
Each amino acid is assigned to one of four basic physicochemical properties:
Hydrophobic: Ala, Leu, Met, Phe, Pro, Tyr, Trp, Ile, Val Polar (uncharged): Asn, Cys, Gln, Ser, Thr, Gly
Positively charged: Arg, Lys, His Negatively charged: Asp, Glu
There are several advantages to considering amino acid properties rather than the 20 amino acid types, besides the extreme combinatorial complexity of using 20 different amino acids: 1) amino acid properties
influence the distribution of amino acids across the protein matrix and therefore also their binding propensities, 2) grouping amino acids by properties enables to compile more robust statistics for features of binding interfaces, 3) amino acid properties are more conserved in evolution than specific amino acids;
4) amino acid properties were shown to confer advantages in computational protein design [46], fold recognition [47] and disorder prediction [48]; and 5) they do reflect basic modes of interactions (such as hydrophobic, electrostatic, H-bond) across interfaces. Calculating pairwise propensities for protein-protein interactions using a reduced set of amino acids were not carried out so far -- as far as we know -- but the applicability of 202/2 amino acid doublet propensities in analyzing protein-RNA interfaces was demonstrated by Kim et al. [49].
For a given interface or non-interface residue k, with a given property i, we computed the frequency of observing the property pairs fij, where j=1,4 are properties of the surrounding residues within a defined cutoff distance from residue k. The fij for interface residues were computed only for the interface core residues. Interface rim residues were not considered since they are believed to contribute less to the affinity and specificity of the binding and their properties represent a transition between the surface and interface core [8].
The statistical potentials (pij) for each property pair (a 4x4 matrix of property pairs) (Fig. 2A) were calculated as the logarithm of the ratio of the relative frequency (fij) of this pair in the local environment of interface core residues, and in the local environment of surface residues that are not part of an interface:
pij = log ( fi,j (interface core) / fi,j (non-interface surface) ) (2) where
fi,j= ni,j / ∑ ni,j i,j
nij represents the number of instances of a residue pair with properties i and j in the local environment considered.
24
The local environment of a given surface or interface residue was computed using a 12Å radial distance cutoff defining a surface patch around the residue represented by its Cα atom. C atom could also be used for this purpose and would produce highly similar results, since the difference in distance between Cα and C is negligible compared to the overlap between areas defined by the radial distance (12Å) cutoffs around these atoms. The radial distance cutoff was selected on the basis of an exploratory analysis of the distribution of maximum Cα-Cα distances between residues in interfaces of complexes of the training set (Fig. S5). Furthermore, the 12Å had previously been found to generate an optimal contrast between specific and nonspecific interfaces in terms of their local packing density by Janin and colleagues [37]. At this cutoff value, even the smallest binding interface comprised multiple patches. We then define the iPat score for a given interface or surface residue k, with property i as follows:iPat(k, i) = ∑ pi,j i,j / N (3)
The averaging in Eq 3 is carried out over all property pairs i,j where i is the central residue and j corresponds to all residues within the 12Å cutoff from the central residue (k) (Fig. 1). pi,j is defined in Eq 2 and N is the number of residues in the given patch.
4.4. Using iPat to score entire protein surfaces
To be able to score proteins considering the difference in the average iPat score for its interface and for its general surface, we used the following expression:
iPatprot= {
−d ( (c, s); (c + s 2 ,c + s
2 )) = −√(c −c + s 2 )
2
+ (s −c + s 2 )
2
= −√(c − s)2
2 𝑖𝑓 𝑐 > 𝑠
d ( (c, s); (c + s 2 ,c + s
2 )) = √(c −c + s 2 )
2
+ (s −c + s 2 )
2
= √(c − s)2
2 𝑖𝑓 𝑐 ≤ 𝑠
c = <iPat (interface core) > ; s = <iPat (surface) > (4)
where <iPat(interface core) > represents the average of scores for all interface core residues belonging to a given subunit in a protein complex and <iPat (surface) > represents the average of scores for all non- interacting surface residues for the corresponding subunit of the complex. iPatprot represents the Euclidean distance of a given data point from the diagonal on the scatter plots (Fig. 4). When <iPat(interface core) >
is greater than <iPat (surface) >, the data point is below the diagonal and iPatprot has a negative value, representing a favorable score.
4.5. Implementation, statistics and figure generation
The property pair frequencies and statistical potential calculations were implemented in Python (2.7.6) using the ‘numpy’ and ‘panda’ modules. Input and output files were processed by in-house Python and Perl (v5.18.2) scripts. Statistical analysis of the data was carried out using Python. To evaluate if two distributions are significantly different, the Mann-Whitney U nonparametric unpaired test was used.
Significant differences between paired samples were tested by the Wilcoxon signed-rank test. Both tests were computed in Python using the ‘scipy’ module. Box plots and scatter plots were generated with the
‘matplotlib’ module. Visual displays of protein structures were obtained with PyMOL 1.7 (http://pymol.org).
The source codes of iPat are available in GitHub: https://github.com/lazartomi/iPat/
ASSOCIATED CONTENT:
Supporting information:
Supplementary figures (5): Figure S1. (Clostridium perfringens enterotoxin trimer (PDB:
3ZIW) with the iPat scores projected onto the surface), Figure S2. (Heatmaps calculated for crystal
26 packing dimers showing the frequencies of middle-range contacts between residues of different physical properties.), Figure S3. (Scatter plots of average iPat, stickiness and hydrophobicity values for all interface residues (rim residues included) and non-binding surface residues in individual protein chains of the analyzed data sets.), Figure S4. (Receiver Operating Characteristic (ROC) analysis of iPat, hydrophobicity and stickiness on the test set.) and Figure S5. (Frequency distribution of maximum Cα-Cα atom distances of interfaces in the training set.) + Supplementary
table: Table S1. (Protein Data Bank identifiers of proteins in the data sets.) – file type: DOCXAUTHOR INFORMATION
Corresponding Author: Peter Tompa
* Email: peter.tompa@vub.be
ORCID: Peter Tompa: 0000-0001-8042-9939
Author Contributions: PT, ES and TL conceived the conceptual framework of the study. MG and PT designed the computational analysis. TL performed the analysis with technical support from MG. MG, ES and PT supervised the analysis. TL and PT wrote the paper. All authors reviewed the manuscript.
Funding Sources: This work was supported by the Odysseus Grant G.0029.12 from Research Foundation Flanders (FWO) and OTKA grant K124670 to Peter Tompa and by the OTKA grant PD-OTKA 108772 to Eva Schad.
Notes: The authors declare no competing financial interest.
ACKNOWLEDGMENT
The authors thank Shoshana J. Wodak and Mauricio Macossay-Castillo for their help and useful comments, and Tamas Horvath for suggestions on an earlier version of this manuscript.
ABBREVIATIONS
IDP, intrinsically disordered protein; IDR, intrinsically disordered region; RMSD, root mean square deviation; PDB, Protein Databank.
REFERENCES
1. Alberts B. The Cell as a Collection of Protein Machines: Preparing the Next Generation of Molecular Biologists. Cell. 1998, 92, 291–294.
2. Jones S, Thornton JM. Principles of Protein-Protein Interactions. Proc. Natl. Acad. of Sci.
USA. 1996, 93, 13–20.
3. Wodak SJ, Janin J. Structural Basis of Macromolecular Recognition. Adv. Protein Chem.
2002, 61, 9–73.
4. Aloy P, Russell RB. The Third Dimension for Protein Interactions and Complexes.
Trends Biochem. Sci. 2002, 27, 633–638.
5. Phillip Y, Schreiber G. Formation of Protein Complexes in Crowded Environments--from
in vitro to in vivo. FEBS Lett. 2013, 587, 1046–1052.
28 6. Deeds EJ, Ashenberg O, Gerardin J, Shakhnovich EI. Robust Protein Protein Interactions in Crowded Cellular Environments. Proc. Natl. Acad. Sci. USA. 2007, 104, 14952–14957.
7. Janin J. Quantifying Biological Specificity: The Statistical Mechanics of Molecular Recognition. Proteins. 1996, 25, 438–445.
8. Janin J, Bahadur RP, Chakrabarti P. Protein-Protein Interaction and Quaternary Structure.
Q. Rev. Biophys. 2008, 41, 133–180.
9. Wang M, Herrmann CJ, Simonovic M, Szklarczyk D, von Mering C. Version 4.0 of PaxDb: Protein Abundance Data, Integrated Across Model Organisms, Tissues, and Cell-Lines.
Proteomics. 2015, 15, 3163–3168.
10. Thul PJ, Åkesson L, Wiking M, Mahdessian D, Geladaki A, Ait Blal H, Alm T, Asplund A, Björk L, Breckels LM, Bäckström A, Danielsson F, Fagerberg L, Fall J, Gatto L, Gnann C, Hober S, Hjelmare M, Johansson F, Lee S, Lindskog C, Mulder J, Mulvey CM, Nilsson P, Oksvold P, Rockberg J, Schutten R, Schwenk JM, Sivertsson Å, Sjöstedt E, Skogs M, Stadler C, Sullivan DP, Tegel H, Winsnes C, Zhang C,
Zwahlen M, Mardinoglu A, Pontén F, von Feilitzen K, Lilley KS, Uhlén M, Lundberg E. A Subcellular Map of the Human Proteome. Science. 2017, 356, eaal3321.
11. Hesketh GG, Youn JY, Samavarchi-Tehrani P, Raught B, Gingras AC. Parallel Exploration of Interaction Space by BioID and Affinity Purification Coupled to Mass Spectrometry. Methods Mol. Biol. 2017, 1550, 115–136.
12. Lu H, Lu L, Skolnick J. Development of Unified Statistical Potentials Describing Protein-Protein Interactions. Biophys. J. 2003, 84, 1895–1901.
13. Porollo A, Meller J. Prediction-based Fingerprints of Protein-Protein Interactions.
Proteins. 2007, 66, 630–645.
14. Kufareva I, Budagyan L, Raush E, Totrov M, Abagyan R. PIER: Protein Interface Recognition for Structural Proteomics. Proteins. 2007, 67, 400–417.
15. Zhang QC, Deng L, Fisher M, Guan J, Honig B, Petrey D. PredUs: A Web Server for Predicting Protein Interfaces Using Structural neighbors. Nucleic Acids Res. 2011, 39, W283–
287.
16. Levy ED, De S, Teichmann SA. Cellular Crowding Imposes Global Constraints on the Chemistry and Evolution of Proteomes. Proc. Natl. Acad. Sci. USA. 2012, 109, 20461–20466.
17. Guharoy M, Chakrabarti P. Secondary Structure Based Analysis and Classification of Biological Interfaces: Identification of Binding Motifs in Protein-Protein Interactions.
Bioinformatics. 2007, 23, 1909–1918.
18. Fernández-Recio J. Prediction of Protein Binding Sites and Hot Spots. Wiley Interdiscip.
Rev. Comput. Mol. Sci. 2011, 1, 680–698.
19. Guharoy M, Chakrabarti P. Conservation and Relative Importance of Residues Across Protein-Protein Interfaces. Proc. Natl. Acad. Sci. USA. 2005, 102, 15447–15452.
20. Mezei M. Statistical Properties of Protein-Protein Interfaces. Algorithms. 2015, 8, 92–99.
21. Korn AP, Burnett RM. Distribution and Complementarity of Hydropathy in Multisubunit Proteins. Proteins. 1991, 9, 37–55.
22. Young L, Jernigan RL, Covell DG. A Role for Surface Hydrophobicity in Protein- Protein Recognition. Protein Sci. 1994, 3, 717–729.
23. Vakser IA, Aflalo C. Hydrophobic Docking: A Proposed Enhancement to Molecular Recognition Techniques. Proteins. 1994, 20, 320–329.
24. Tsai CJ, Lin SL, Wolfson HJ, Nussinov R. Studies of Protein-Protein Interfaces: A
Statistical Analysis of the Hydrophobic Effect. Protein Sci. 1997, 6, 53–64.
30 25. Sheinerman FB, Norel R, Honig B. Electrostatic Aspects of Protein-Protein Interactions.
Curr. Opin. Struct. Biol. 2000, 10, 153–159.
26. Levy ED, De S, Teichmann SA. Cellular Crowding Imposes Global Constraints on the Chemistry and Evolution of Proteomes. Proc. Natl. Acad. Sci. USA. 2012, 109, 20461–20466.
27. Garcia-Seisdedos H, Empereur-Mot C, Elad N, Levy ED. Proteins Evolve on the Edge of Supramolecular Self-Assembly. Nature. 2017, 548, 244–247.
28. Griep S, Hobohm U. PDBselect 1992-2009 and PDBfilter-select. Nucleic Acids Res.
2010, 38, D318–319.
29. Tompa P, Davey NE, Gibson TJ, Babu MM. A Million Peptide Motifs for the Molecular Biologist. Mol Cell. 2014, 55, 161–169.
30. Mészáros B, Tompa P, Simon I, Dosztányi Z. Molecular Principles of the Interactions of Disordered Proteins. J. Mol. Biol. 2007, 372, 549–561.
31. Dogan J, Gianni S, Jemth P. The Binding Mechanisms of Intrinsically Disordered Proteins. Phys. Chem. Chem. Phys. 2014, 16, 6323–6331.
32. Kyte J, Doolittle RF. A Simple Method for Displaying the Hydropathic Character of a Protein. J. Mol. Biol. 1982, 157, 105–132.
33. Tonddast-Navaei S, Skolnick J. Are Protein-Protein Interfaces Special Regions on a Protein’s Surface? J. Chem. Phys. 2015, 143, 243149.
34. McConkey EH. Molecular Evolution, Intracellular Organization, and the Quinary Structure of Proteins. Proc. Natl. Acad. Sci. USA. 1982, 79, 3236–3240.
35. Dodge C, Schneider R, Sander C. The HSSP Database of Protein Structure-Sequence
Alignments and Family Profiles. Nucleic Acids Res. 1998, 26, 313–315.
36. Huang Y, Niu B, Gao Y, Fu L, Li W. CD-HIT Suite: A Web Server For Clustering and Comparing Biological Sequences. Bioinformatics. 2010, 26, 680–682.
37. Bahadur RP, Chakrabarti P, Rodier F, Janin J. A Dissection of Specific and Non-specific Protein-Protein Interfaces. J. Mol. Biol. 2004, 336, 943–955.
38. Duarte JM, Srebniak A, Schärer MA, Capitani G. Protein Interface Classification by Evolutionary Analysis. BMC Bioinformatics. 2012, 13, 334.
39. Krissinel E, Henrick K. Inference of Macromolecular Assemblies from Crystalline State.
J. Mol. Biol. 2007, 372, 774–797.
40. Sickmeier M, Hamilton JA, LeGall T, Vacic V, Cortese MS, Tantos A, Szabo B, Tompa P, Chen J, Uversky VN, Obradovic Z, Dunker AK. DisProt: The Database of Disordered
Proteins. Nucleic Acids Res. 2007, 35, D786–793.
41. Piovesan D, Tabaro F, Mičetić I, Necci M, Quaglia F, Oldfield CJ, Aspromonte MC, Davey NE, Davidović R, Dosztányi Z, Elofsson A, Gasparini A, Hatos A, Kajava AV, Kalmar L, Leonardi E, Lazar T, Macedo-Ribeiro S, Macossay-Castillo M,
Meszaros A, Minervini G, Murvai N, Pujols J, Roche DB, Salladini E, Schad E, Schramm A, Szabo B, Tantos A, Tonello F, Tsirigos KD, Veljković N, Ventura S,
Vranken W, Warholm P, Uversky VN, Dunker AK, Longhi S, Tompa P, Tosatto SC. DisProt 7.0: A Major Update of the Database of Disordered Proteins. Nucleic Acids Res. 2017, 45, D1123–D1124.
42. Vreven T, Moal IH, Vangone A, Pierce BG, Kastritis PL, Torchala M, Chaleil R, Jiménez-García B, Bates PA, Fernandez-Recio J, Bonvin AM, Weng Z. Updates to the
Integrated Protein-Protein Interaction Benchmarks: Docking Benchmark Version 5 and Affinity
Benchmark Version 2. J. Mol. Biol. 2015, 427, 3031–3041.
32 43. Frishman D, Argos P. Knowledge-based Protein Secondary Structure Assignment.
Proteins. 1995, 23, 566–579.
44. Chothia C. The Nature of the Accessible and Buried Surfaces in Proteins. J. Mol. Biol.
1976, 105, 1–12.
45. Schärer MA, Grütter MG, Capitani G. CRK: An Evolutionary Approach for Distinguishing Biologically Relevant Interfaces from Crystal Contacts. Proteins. 2010, 78, 2707–2713.
46. Kamtekar S, Schiffer JM, Xiong H, Babik JM, Hecht MH. Protein Design by Binary Patterning of Polar and Nonpolar Amino Acids. Science. 1993, 262, 1680–1685.
47. Murphy LR, Wallqvist A, Levy RM. Simplified Amino Acid Alphabets for Protein Fold Recognition and Implications for Folding. Protein Eng. 2000, 13, 149–152.
48. Weathers EA, Paulaitis ME, Woolf TB, Hoh JH. Reduced Amino Acid Alphabet is Sufficient to Accurately Recognize Intrinsically Disordered Protein. FEBS Lett. 2004, 576, 348–
352.
49. Kim OTP, Yura K, Go N. Amino Acid Residue Doublet Propensity in the Protein-RNA Interface and its Application to RNA Interface Prediction. Nucleic Acids Res. 2006, 34, 6450–
6460.
TABLE OF CONTENTS GRAPHIC
(for table of contents only)
Unique physicochemical patterns of residues in protein-protein interfaces