The transcription factor EGR2 is the molecular linchpin connecting STAT6 activation to the late, stable epigenomic program of alternative macrophage
polarization
Bence Daniel,1,2,3,11,12Zsolt Czimmerer,4,12Laszlo Halasz,1,2,3,12Pal Boto,4Zsuzsanna Kolostyak,4 Szilard Poliska,4Wilhelm K. Berger,1,2,3Petros Tzerpos,4Gergely Nagy,4Attila Horvath,4
György Hajas,5Timea Cseh,4Aniko Nagy,4Sascha Sauer,6,7,8,9Jean Francois-Deleuze,10 Istvan Szatmari,4Attila Bacsi,5and Laszlo Nagy1,2,3,4
1Department of Medicine,2Department of Biological Chemistry, Johns Hopkins University School of Medicine, St. Petersburg, Florida 33701, USA;3Institute for Fundamental Biomedical Research, Johns Hopkins All Children’s Hospital, St. Petersburg, Florida 33701, USA;4Department of Biochemistry and Molecular Biology, Faculty of Medicine, University of Debrecen, Debrecen 4032, Hungary;5Department of Immunology, Faculty of Medicine, University of Debrecen, Debrecen 4032, Hungary;6Otto Warburg Laboratory, Max Planck Institute for Molecular Genetics, Berlin 14195, Germany;7CU Systems Medicine, University of Würzburg, Würzburg 97070, Germany;8Berlin Institute for Medical Systems Biology,9Berlin Institute of Health, Max-Delbrück- Center for Molecular Medicine, Berlin 13125, Germany;10Centre National de Génotypage, Institut de Génomique, Commissariat à l’Énergie Atomique, Evry 91000, France
Macrophages polarize into functionally distinct subtypes while responding to microenvironmental cues. The identity of proximal transcription factors (TFs) downstream from the polarization signals are known, but their ac- tivity is typically transient, failing to explain the long-term, stable epigenomic programs developed. Here, we mapped the early and late epigenomic changes of interleukin-4 (IL-4)-induced alternative macrophage polarization.
We identified the TF, early growth response 2 (EGR2), bridging the early transient and late stable gene expression program of polarization. EGR2 is a direct target of IL-4-activated STAT6, having broad action indispensable for 77%
of the induced gene signature of alternative polarization, including its autoregulation and a robust, downstream TF cascade involving PPARG. Mechanistically, EGR2 binding results in chromatin opening and the recruitment of chromatin remodelers and RNA polymerase II.Egr2induction is evolutionarily conserved during alternative po- larization of mouse and human macrophages. In the context of tissue resident macrophages,Egr2expression is most prominent in the lung of a variety of species. Thus, EGR2 is an example of an essential and evolutionarily conserved broad acting factor, linking transient polarization signals to stable epigenomic and transcriptional changes in macrophages.
[Keywords: EGR2; IL-4; macrophage polarization; epigenomic regulation; transcription factor network]
Supplemental material is available for this article.
Received July 28, 2020; revised version accepted September 11, 2020.
Macrophages (MFs) are integral parts of innate immunity and represent the first line of defense against invading pathogens. These activities require plasticity and rapid re- sponses to environmental cues, leading to the deployment of epigenomic mechanisms resulting in specific and stable gene expression programs. MF gene expression is thought
to be regulated at three levels. The first level is a perma- nent program established by the developmental regu- lation and is maintained by lineage-determining transcription factors (LDTFs) like PU.1, CEBP, and AP-1.
The second level is an adaptation to a given microenviron- ment brought about by distinct tissue-specific
11Present address: Department of Pathology, Stanford University School of Medicine, Stanford 94305, California, USA.
12These authors contributed equally to this work.
Corresponding author: lnagy@jhmi.edu
Article published online ahead of print. Article and publication date are online at http://www.genesdev.org/cgi/doi/10.1101/gad.343038.120.
© 2020 Daniel et al. This article is distributed exclusively by Cold Spring Harbor Laboratory Press for the first six months after the full-issue publi- cation date (see http://genesdev.cshlp.org/site/misc/terms.xhtml). After six months, it is available under a Creative Commons License (Attribu- tion-NonCommercial 4.0 International), as described at http://creative- commons.org/licenses/by-nc/4.0/.
1474 GENES&DEVELOPMENT 34:1474–1492 Published by Cold Spring Harbor Laboratory Press; ISSN 0890-9369/20; www.genesdev.org
polarization signals (Amit et al. 2016; Guilliams et al.
2020) modulating TFs’ activity (Bonnardel et al. 2019);
i.e., singular polarizing cytokines such as IL-4 or IL-13 via signal transducer and activator of transcription 6 (STAT6). The third level of regulation takes place tran- siently upon pathogen encounter or inflammatory stimu- lation (Glass and Natoli 2016). Therefore, MF polarization is part of normal physiologic processes, actively contribut- ing to controlling infection, cancer, and inflammatory disease progression (Lawrence and Natoli 2011). Conse- quently, investigation of the polarization process became an intensely researched topic in immunology with thera- peutic ramifications.
The two end points of the contiguous spectrum of mac- rophage polarization are the classical polarization of mac- rophages (M1 MFs) via TLR or inflammatory cytokine signaling such as interferon γor at the opposite end of the spectrum, alternative polarization (M2 MFs) induced by IL-4 or IL-13 (Murray et al. 2014). These two models are widely used to learn about the molecular events of polarization of MFs (Murray et al. 2014). Functionally, classically polarized MFs are characterized by high anti- microbial activities critical for host defense, while alter- natively polarized MFs exhibit a characteristically more anti-inflammatory profile contributing to tissue-regenera- tion, tissue-remodeling, and the resolution of inflamma- tion (Shapouri-Moghaddam et al. 2018). The in vivo roles of alternatively polarized MFs are highlighted in al- veolar MFs in the steady-state and different pathological conditions including asthma and allergies, parasite infec- tion, fibrosis, and cancer (Gordon and Martinez 2010;
Cohen et al. 2018) . The cytokines IL-4 or IL-13 are the ini- tiators of this stable gene expression program and cellular phenotype in its purest form and phosphorylated STAT6 acts as a downstream immediate transcriptional regula- tor. STAT6 is required for alternative polarization by IL- 4 in bone marrow-derived macrophages (BMDM) and in vivo to mount effective antihelminth defense (Rückerl and Allen 2014). However, the requirements and contri- bution of myeloid or macrophage STAT6 are not as well understood due to the lack of genetic evidence establish- ing MF cell-autonomous function, as well as establishing the contribution of the various aspects of Th2 immune responses. Thus, BMDM represents the gold standard model to study the epigenomic and molecular details of polarization.
The TFs PU.1, AP-1, C/EBP, and IRF are all critical for MF development and function, establishing the MF-spe- cific regulatory element landscape (lineage identity) (Heinz et al. 2015). Moreover, TF binding at low accessible genomic regions (labeled regulatory regions) also contrib- utes to lineage identity in macrophages (Horvath et al.
2019), and form a molecular landing strip for signal-depen- dent transcription factors (SDTFs). These genomic loci are readily used during the initiation of polarization and con- fer plasticity. The early steps of alternative MF polariza- tion have been studied, and the role of de novo/latent enhancers, mediating new cellular functions as well as providing cellular memory, has been established (Heinz et al. 2015). This is triggered by STAT6 homodimers
that act in a rapid and transient fashion. DNA binding of STAT6 alters the expression of hundreds of genes within the first few hours of polarization, including several TFs.
Due to its transient mechanism of action, the majority of STAT6 is released from the chromatin after 24 h of cy- tokine exposure (Czimmerer et al. 2018). Therefore, the polarization program enters into a self-sustained, largely STAT6-independent stable state. This observation leads to a so-far unresolved conundrum on how transiently act- ing STAT6 induces a stable and sustained polarization program.
Several STAT6-induced TFs have been described as es- sential regulators of the alternative MF phenotype, in- cluding the peroxisome proliferator-activated receptorγ (PPARG) (Odegaard et al. 2007), KLF4 (Liao et al. 2011), IRF4 (Satoh et al. 2010), MYC (Pello et al. 2012), and more recently BHLHE40 (Jarjour et al. 2019). The latter is reported to specifically control the proliferation of large peritoneal MFs when IL-4 is abundant (Jarjour et al. 2019).
Our recent study suggests that the nuclear receptor PPARG is a late regulator of the alternative polarization program via ligand-regulated gene expression and tran- scriptional memory. Importantly, neither of these TFs possess widespread regulatory roles when MFs transit from the early to late polarization state (Daniel et al.
2018a).
Although the listed TFs are induced by STAT6 and their expression is sustained beyond STAT6’s presence, their action is highly specific, controlling very confined parts of the broad polarization program. Therefore, there is a hiatus in our understanding, leading to the proposition that broader epigenomic mechanism(s) and/or factor(s) directly controlled by STAT6 must exist, acting as molec- ular linchpin(s) to link the early transient and late stable molecular events of polarization.
We took an unbiased systematic approach in the search for such epigenomic regulators, integrating both the map- ping of genome activity patterns and de novo motif analy- sis. Using the combination of P300 (general coactivator with histone acetyltransferase activity) and H3K27ac chromatin immunoprecipitation sequencing (ChIP-seq), we defined the early and late genome activity patterns of alternative polarization in BMDMs. Our analyses, which included genetic gain and loss-of-function studies, identi- fied the TF EGR2 acting as a molecular linchpin between IL-4-activated STAT6 and a downstream stable transcrip- tional network of polarization.
Results
Mapping the temporal genome activity patterns of alternative MF polarization
In order to obtain robust and unbiased data sets to map the early transient and late stable events of alternative polar- ization we generated a time course of epigenomic, cistro- mic, and transcriptomic changes. We used murine bone marrow-derived macrophages (BMDMs referred to as MFs) and IL-4-mediated MF polarization as a model. Ma- ture, unstimulated MFs received IL-4 for 1 h (short-term
EGR2 governs M2 macrophage polarization
polarization) and 24 h (long-term polarization) to reveal early and late genome activities. We devised an approach that maps significant changes in P300 binding and its correlation with H3K27ac levels (histone modification correlating with P300 activity), using ChIP-seq to map ac- tive enhancers (Creyghton et al. 2010).
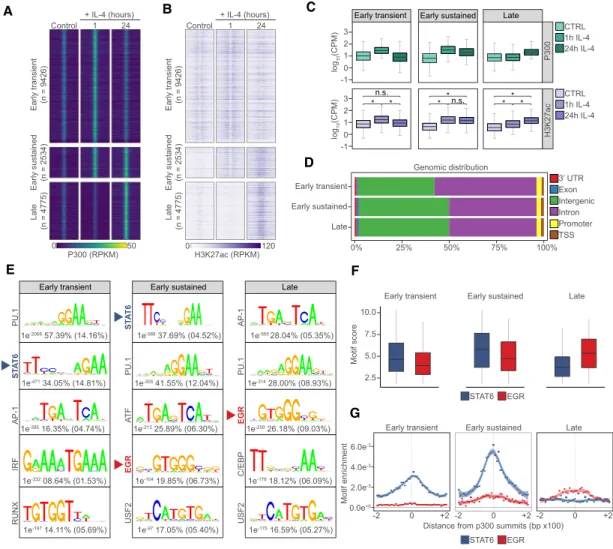
First, we identified genomic regions with differential P300 and H3K27ac levels followed by de novo motif dis- covery in the underlying genomic regions. This approach revealed the activated (n= 16,735) and repressed (n= 17,582) regulatory regions of polarization, while 14,353 sites showed no change (Fig. 1A;Supplemental Fig. S1A;
Supplemental Table S1). Clustering the activity patterns of regulatory elements yielded three activated and three repressed groups. Activated regulatory elements exhibited
“early transient”(activated at 1 h and lost activity by 24 h;
n= 9426),“early sustained”(activated at 1 h and retained activity at 24 h;n= 2534), and“late” genomic activities (activated only by 24 h; n= 4775). Repressed regulatory elements followed very similar patterns by featuring
“transiently”repressed (repressed at 1 h, but relieved of re- pression by 24 h;n= 12,496),“early”repressed (n= 1346) and “late” repressed genome activity sites (n= 3740) (Fig. 1A–C; Supplemental Fig. S1A,B). The majority of
E F
A B C
D
G
Figure 1. Regulatory elements with distinct temporal genome activity patterns identify and link the EGR motifs to late genome activ- ities. (A) Read distribution plot of P300 binding in the three groups showing distinct genome activity pattern in control and IL-4 polarized macrophage for the indicated periods of time. Results are represented in RPKM (reads per kilobase per million mapped reads) values. (B) Read distribution plot of H3K27ac signal in the three induced genome activity pattern groups in control and IL-4 polarized macrophage for the indicated periods of time. Signals are visualized around P300 summits. RPKM values are plotted. (C) Average binding signal for P300 and H3K27ac are represented as box plots on the genomic regions showing induced genome activity patterns. Average log10CPM (counts per million mapped reads) values are plotted. Significant changes are determined with Wilcoxon test atP< 0.05. (D) Genomic distribution of the regulatory elements exhibiting distinct genome activity pattern. (E) Motif enrichment plots on the regulatory regions exhibiting different genome activity patterns. For each motif logo,P-value and percentage of genomic regions that contain the given motif in the target (P300-bound) and background genomic regions (in parenthesis) are shown. (F) Box plot representation of STAT6 and EGR motif scores on the induced genome activity pattern groups. Significant changes are determined with Wilcoxon test atP< 0.05. (G) Distribution of the enriched STAT6 and EGR motifs around the identified P300 summits are shown for the induced genome activity pattern groups in a
±200-bp window. Shaded areas represent the 95% confidence interval for LOESS smoothed means.
Daniel et al.
1476 GENES&DEVELOPMENT
regulatory elements exhibiting increased genome activi- ties were located on intergenic and intronic regions with marginal differences between the different categories (Fig. 1D), while a significant portion (∼40%) of transiently repressed genomic regions occurred at promoters (Supple- mental Fig. S1C).These analyses uncovered the dynamics of the epigenomic changes, cataloged the immediate early and long-term, sustained genome activities of alternative MF polarization and prompted us to seek the drivers of the observed changes.
Late and sustained genome activity patterns associate with the binding motif of the EGR transcription factor family
In order to identify candidate TFs mediating differential genome activity patterns, we turned our attention to the sequence determinants of the genomic regions exhibiting changes. Motif enrichment analysis identified the TF mo- tifs associated with MF-specific regulatory regions across the three different genome activity groups (e.g. PU-1, AP- 1, IRF, RUNX, and C/EBP) (Horvath et al. 2019). We could confirm that genomic regions of early activation (“early transient” and “early sustained”) were enriched for the STAT6 TF-binding motif, the initiator of the polarization process. Importantly, we observed the enrichment of nov- el TF motifs that have not been linked to genome activa- tion in this model and were largely specific to genomic regions with sustained activity such as EGR and USF2 (Fig. 1E). Among these, EGR motifs were enriched specif- ically in the“early sustained”and“late”genome activity groups, indicating the potential importance of the respec- tive TF family at these genomic regions (Fig. 1F,G). How- ever, EGR motifs were not revealed using the enrichment analysis at repressed sites (Supplemental Fig. S1D), super- vised motif score analysis at“transiently”repressed geno- mic regions uncovered similarly strong EGR motifs to the ones detected at“late”induced sites (Supplemental Fig.
S1E). Interestingly,“transiently”repressed regions exhib- ited rapid loss of P300 and H3K27ac at 1 h but genome ac- tivity returned to the basal level by 24 h (Supplemental Fig. S1A). Altogether, this is indicative of EGR TFs being transcriptional activators of the late polarization program and may contribute to repression via indirect mecha- nisms. Prompted by these results, we decided to embark on evaluating the roles of EGRs in genome activation dur- ing alternative macrophage polarization.
EGR2 is a direct IL-4/STAT6 target with an expansive enhancer network
Our analyses thus identified an enrichment for the EGR motif at polarization-induced regulatory regions and pre- dicted roles for this TF family in the late molecular pro- gram of polarization. The EGR TF family consists of four members with homologous DNA-binding domains (Poirier et al. 2007). Our most recent transcriptome-wide studies demonstrated the induced expression of Egr2 along with the marker genes (Retnla,Chil3, andArg1) of alternative polarization (Czimmerer et al. 2018; Daniel
et al. 2018b). Importantly, other EGR family members (Egr1,Egr3, andEgr4) were barely expressed and IL-4 had no impact on their expression (Supplemental Fig. S2A).
TheEgr2transcript was below our detection limit in unstimulated cells; however, it showed rapidly induced and sustained mRNA levels in the presence of IL-4.
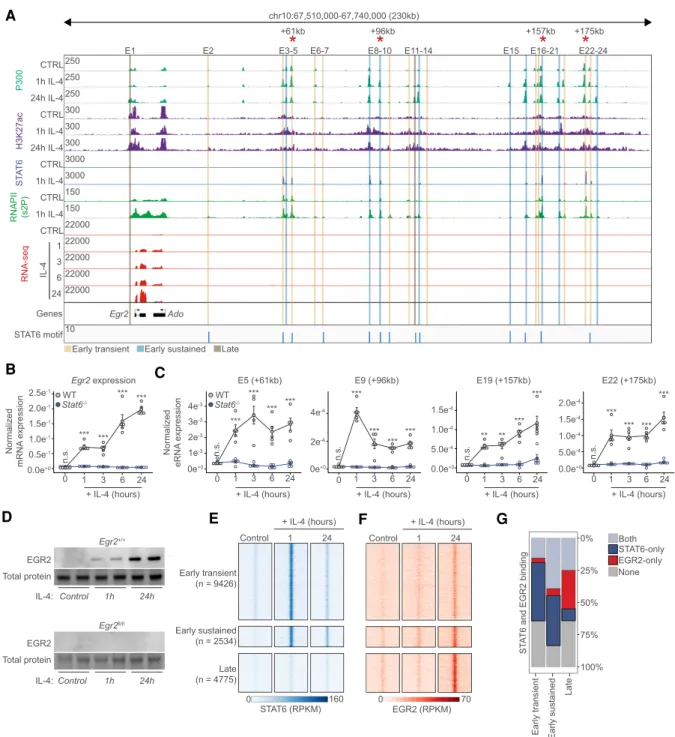
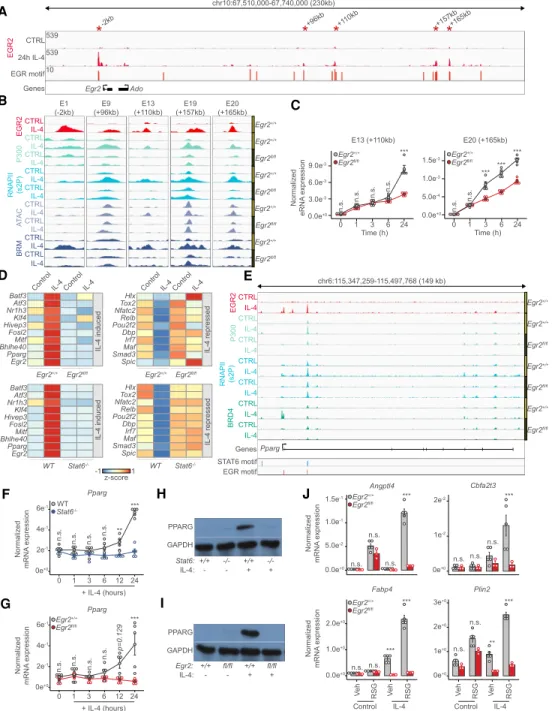
Thus, we took a closer look at the Egr2locus utilizing ChIP-seq data for P300, H3K27ac, STAT6, and RNAPII- pS2 (elongating RNA polymerase II), which informed us about the existence of an enhancer cluster of∼23 putative enhancer regions downstream from the gene and one enhancer located upstream (E1) (Fig. 2A; Supplemental Table S2). These putative enhancer regions contained STAT6 motifs (Fig. 2A) and exhibited slightly different ge- nome activity patterns and STAT6 occupancies, with a few of them showing“late,”while most of them showed
“early transient” and “early sustained” activities (pre- sented in Figs. 1, 2A). UsingStat6−/−MFs we could dem- onstrate that Egr2is an IL-4 and Stat6-dependent gene using a time-course experiment (1-, 3-, 6-, and 24-h-long exposure) (Fig. 2B). Also, we selected four distant enhancer regions (+61, +96, +157, and +175 kb) bound by STAT6 and having increased P300, H3K27ac, and RNAPII signals af- ter 1-h IL-4 stimulation for validation purposes. Enhancer RNA synthesis, as a marker of enhancer activity, was rap- idly induced at 1 h and maintained the induced levels over the time course in a strictly IL-4- and Stat6-dependent manner (Fig. 2C). Thus,Egr2is an immediate early target of the IL-4/STAT6-activated transcriptional program and harbors an elaborate STAT6-bound enhancer network spanning almost 200 kb.
Polarization-induced EGR2 populates the macrophage genome largely avoiding the STAT6 cistrome due to its distinct temporal dynamics
The regulation and expression level ofEgr2are indicative of robust and long-term regulatory roles during the polar- ization process. In order to evaluate the protein levels and IL-4-mediated induction, we carried out Western blot analyses. EGR2 protein was not detectable in control mac- rophages, but IL-4 exposure led to robust induction (Fig.
2D;Supplemental Fig. S2B). Thus, we set out to generate a genome-wide map of EGR2-bound genomic regions after 1 and 24 h of IL-4 polarization using ChIP-seq analysis (re- ferred to as the EGR2 cistrome). We performed a compar- ative analysis with the STAT6 cistrome in the same experimental system using our published data sets (Czim- merer et al. 2018). In unstimulated MFs, negligible binding was detected for both STAT6 and EGR2 (Supple- mental Fig. S2C,D). As we and others reported previously, STAT6 rapidly populated the MF genome as early as 1 h after IL-4 exposure (∼21,000 binding sites) (Ostuni et al.
2013; Czimmerer et al. 2018). EGR2 binding was also measurable at this time point (∼10,000) binding sites), al- though very low binding signals could be detected. After 24 h, the STAT6 cistrome diminished substantially, while the EGR2 cistrome went through a remarkable expansion and binding signal increase representing close to∼30,000 binding sites at this late time point (Supplemental Fig.
EGR2 governs M2 macrophage polarization
E F B
A
C
D G
Figure 2. The transcription factor EGR2 is a direct STAT6 target. (A) Genome browser view on theEgr2locus. ChIP-seq results for P300, H3K27ac, STAT6, and RNAPII (s2P [2-phosphoserine form]) is shown in control (CTRL) and IL-4 polarized macrophages. RNA-seq results are also shown on the indicated IL-4 time course. Putative enhancers are highlighted (E1–E24) and their genome activity pattern is indi- cated as determined in Figure 1. Red asterisks indicate enhancers for which enhancer RNA levels are measured inC. (B) RT-qPCR mea- surements of theEgr2mRNA levels on the indicated time course from wild-type (WT) andStat6−/−macrophages. The level of mRNA is normalized to the expression ofPpia. Experiments were repeated five times, and significant changes between groups were calculated by two-way analysis of variance (ANOVA). (C) RT-qPCR measurements of enhancer RNA levels on four distant enhancers over the indicated time course from WT andStat6−/−macrophages. Experiments were repeated five times and significant changes between groups were cal- culated by two-way analysis of variance (ANOVA). (D) Western blot of EGR2 expression in wild-type andEgr2fl/flmacrophages in the pres- ence or absence of IL-4. Experiments were repeated four times. One representative blot is shown with duplicate samples. Total protein serves as a loading control. (E) Read distribution plot of STAT6 binding in the three induced genome activity pattern groups in control and IL-4 polarized macrophage for the indicated periods of time in a 2 kb window around the P300 summits. RPKM (reads per kilobase per million mapped reads) values are plotted. (F), Read distribution plot of EGR2 binding in the three induced genome activity pattern groups in control and IL-4 polarized macrophage for the indicated periods of time in a 2-kb window around the P300 summits. RPKM (reads per kilobase per million mapped reads) values are plotted. (G) Stacked bar plot representation of the cobinding properties of STAT6 and EGR2 in the three regulatory element groups showing induced genome activity patterns.
Daniel et al.
1478 GENES&DEVELOPMENT
S2B,C). These results show that there is temporal separa- tion between the STAT6 and EGR2 cistromes. Side by side comparison of the STAT6 and EGR2 cistromes on the genomic regions having differential genome activities documented on Figure 1 also indicated strong spatial sep- aration. Characteristically, STAT6 occupied sites with
“early transient,”while EGR2 exhibited stronger binding signals at “early sustained” and “late” genome activity sites with very little overlap (Fig. 2E–G). The genomic re- gions bound by both factors belonged to“early sustained” genome activity regions, but even there, binding was tem- porally separated (Fig. 2E–G). These results clearly show that there is spatial and temporal separation between the TF cistromes, indicating the existence of an EGR2 dominated, late polarization program and making it un- likely that EGR2 acts as a collaborator factor of STAT6.
The IL-4/STAT6/EGR2 axis is required to regulate gene expression in alternatively polarized MFs
In order to probe whether the IL-4/STAT6/EGR2 axis is in- deed functional in MFs, we performed a side-by-side com- parison using MFs differentiated from the bone marrow of Stat6−/−(full-body knockout) andEgr2-deficient (LysM- CreEgr2fl/fl[conditional knockout, referred to asEgr2fl/
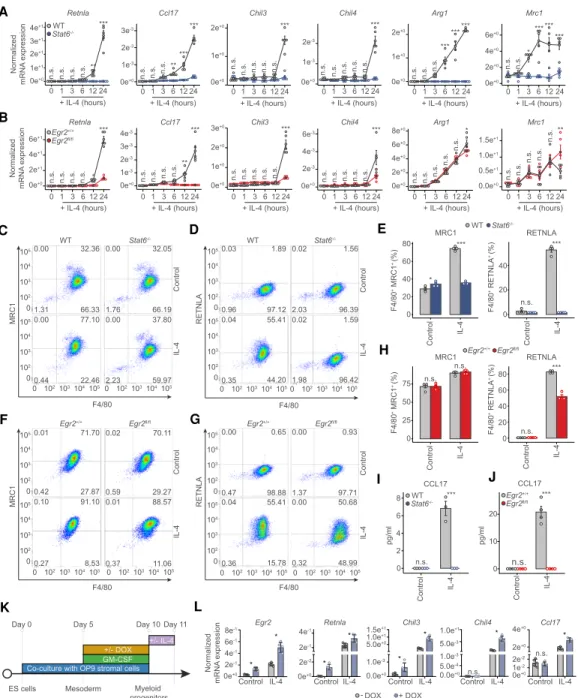
fl]) mice. We show thatEgr2fl/flMFs are devoid ofEgr2(Sup- plemental Fig. S3A). Furthermore, neither Stat6−/− nor Egr2fl/flMFs were different from wild type regarding the ex- pression of MF cell surface markers (ADGRE1: F4/80 and macrophage mannose receptor 1 [MRC1]) (Fig. 3C,F, con- trol condition;Supplemental Fig. S3B–E) in the unstimu- lated state, thus representing fully mature cells. After a general characterization of the unstimulated MF state, we assessed the mRNA expression of a selected set of alter- native polarization marker genes (Retnla,Ccl17,Chil3, Chil4,Arg1, andMrc1) using samples collected at six dif- ferent time points (1, 3, 6, 12, and 24 h) following IL-4 treat- ment. In the absence ofStat6, all six genes had abrogated response to IL-4 (Fig. 3A). Of these,Ccl17showed total, Retnla, Chil3, and Chil4 close to absolute dependence onEgr2, while the induction ofArg1andMrc1was inde- pendent ofEgr2(Fig. 3B). Next, we chose one representa- tive gene from each of these classes and determined protein expression. Using flow cytometry, we studied the protein expression of the phagocytic receptor MRC1 and RETNLA (Resisitin-like moleculeα) with roles in the res- olution of inflammation as a secreted protein (Nair et al.
2009). Both MRC1 and RETNLA displayed IL-4/STAT6- dependent expression (Fig. 3C–E). Loss ofEgr2did not af- fect the expression of MRC1, but it was required for the full induction of RETNLA (Fig. 3F–H). Enzyme-linked im- munosorbent assay (ELISA) for the CC chemokine CCL17 with roles in autoimmune diseases (Saeki and Tamaki 2006) and pulmonary fibrosis (Belperio et al. 2004) secreted by MFs exhibited an absolute dependence on bothStat6 and Egr2 (Fig. 3I,J). Thus, protein expressions followed changes in mRNA levels in all three cases indicating that MF function is likely to be substantially altered in the absence ofEgr2. After establishing thatEgr2is required and necessary for many STAT6-regulated polarization-
specific changes we sought to examine whetherEgr2was sufficient to bring about such changes.
Therefore, we performed gain-of-function experiments on myeloid cells differentiated from embryonic stem cells harboring a doxycycline (DOX)-inducible minigene en- codingEgr2(Fig. 3K; Bencsik et al. 2016). DOX efficiently induced the expression of EGR2, which was further aug- mented in the presence of IL-4 (Fig. 3L). Overexpression of Egr2 led to induced expression of Retnla and Chil3 even in the absence of IL-4. IL-4 exposure induced the expression of all the measured genes (Egr2,Retnla, Chil3, Chil4, and Ccl17), which was facilitated by the overexpression ofEgr2(Fig. 3L). Therefore,Egr2is neces- sary and sufficient to induce the expression of at least a select set of polarization specific marker genes. However, this requirement has a range from none to substantial to absolute, depending on the gene. Thus, we set out to map the extent of this dependence in a genome-wide fashion.
Loss of EGR2 severely impacts the transcriptome of alternative polarization
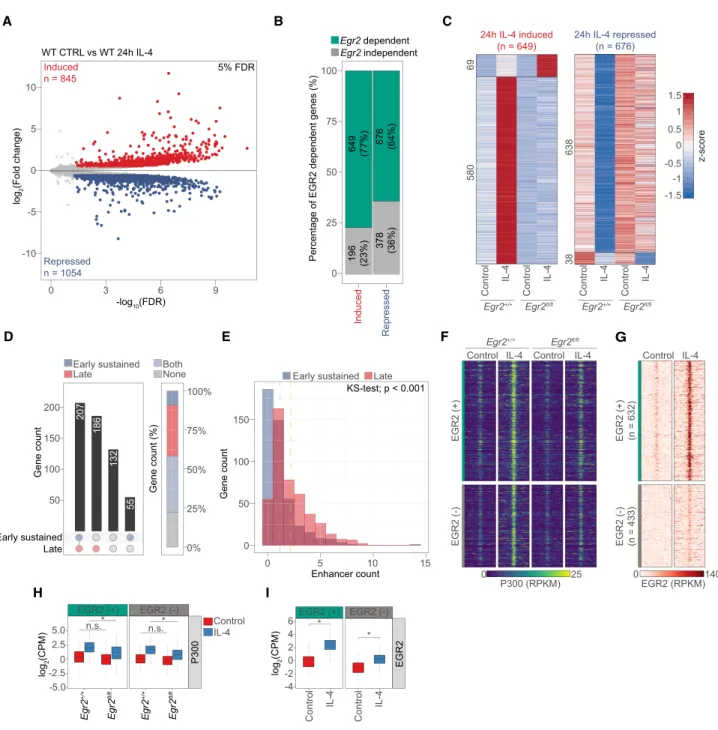
In order to shed light on the extent of theEgr2-dependent late polarization program, we performed RNA-seq experi- ments in wild-type andEgr2fl/flmacrophages following 24 h of IL-4 polarization. Principal component analysis and clustering of the samples based on Euclidean distance re- ported good reproducibility, no impact on the unstimu- lated MF state and the critical roles of IL-4 and EGR2 in bringing about the alternative polarization program (Sup- plemental Fig. S4A,B). Notably, members of the EGR fam- ily (Egr1,Egr3, andEgr4) do not compensate for the loss of Egr2 (Supplemental Fig. S4C). Global gene expression analysis identified 845 induced and 1054 repressed genes after 24 h of IL-4 treatment (Fig. 4A). Importantly, loss of Egr2 affected 77% (649/845) of the induced and 64%
(676/1054) of the repressed gene program (n= 3; FDR 5%) (Fig. 4B; Supplemental Table S3). Of the 649 IL-4- and EGR2-induced genes, 580 showed lower or abolished sensitivity to IL-4, while 69 responded to a greater extent upon cytokine treatment in the absence ofEgr2. The de- gree of repression also got diminished on 638 gene loci, while 38 genes showed facilitated repression in the Egr2−/−(Fig. 4C).
Assessing the effects of the loss ofStat6orEgr2on the IL-4/EGR2-regulated gene programs revealed gene mod- ules where the linkage of the two TFs can be appreciated using RNA-seq. We observed the following gene modules (all requiring STAT6) (Supplemental Fig. S4D): (1) IL-4/
STAT6-induced genes, where EGR2 negatively impacts expression; (2) IL-4/STAT6/EGR2-induced genes; (3) IL- 4/STAT6/EGR2-repressed genes; (4) IL-4/STAT6-re- pressed genes, where EGR2 has restraining activity on re- pression; (5) IL-4/STAT6-induced genes without EGR2- dependent regulation; and (6) IL-4/STAT6-repressed genes that lack EGR2 dependence. This analysis underlines the significant linkage between IL-4/STAT6 and EGR2, but also establishes that STAT6 is not entirely dependent on EGR2 to induce the late program.
EGR2 governs M2 macrophage polarization
E
F B A
C D
I
K L
J G
H
Figure 3. Both STAT6 and EGR2 are required to regulate gene expression during alternative macrophage polarization. (A) RT-qPCR mea- surements on the indicated marker genes of alternative macrophage polarization from WT andStat6−/−macrophages over the indicated time course of IL-4 treatment. The level of mRNA is normalized to the expression ofPpia. Experiments were repeated five times, and significant changes between groups were calculated by two-way analysis of variance (ANOVA). (B) RT-qPCR measurements on the indi- cated marker genes of alternative macrophage polarization from WT andEgr2fl/flmacrophages over the indicated time course of IL-4 treat- ment. The level of mRNA is normalized to the expression ofPpia. Experiments were repeated five times, and significant changes between groups were calculated by two-way analysis of variance (ANOVA). (C) Representative FACS plot of MRC1 (CD206) and ADGRE1 (F4/80) expression in control and IL-4 polarized macrophages from WT andStat6−/−animals. (D) Representative FACS plot of RETNLA and ADGRE1 (F4/80) expression in control and IL-4 polarized macrophages from WT andStat6−/−macrophages. (E) Percentages of MRC1 (CD206), ADGRE1 (F4/80) and RETNLA, ADGRE1 (F4/80) double-positive macrophages in control and IL-4 treated conditions from WT andStat6−/−macrophages. Experiments were repeated three times, and significant changes between groups were calculated by two-way analysis of variance (ANOVA). (F) Representative FACS plot of MRC1 (CD206) and ADGRE1 (F4/80) expression in control and IL-4 polarized macrophages fromEgr2+/+andEgr2fl/flanimals. (G) Representative FACS plot of RETNLA and ADGRE1 (F4/80) expres- sion in control and IL-4 polarized macrophages fromEgr2+/+andEgr2fl/flanimals. (H) Percentages of MRC1 (CD206), ADGRE1 (F4/80) and RETNLA, ADGRE1 (F4/80) double-positive macrophages in control and IL-4 treated conditions fromEgr2+/+andEgr2fl/flanimals. Exper- iments were repeated three times, and significant changes between groups were calculated by two-way analysis of variance (ANOVA). (I,J) CCL17 levels determined by ELISA in control and IL-4-polarized WT,Stat6−/−andEgr2+/+, Egr2fl/flmacrophages. Experiments were per- formed three times for theStat6−/−, while four times for theEgr2fl/flconditions, and significant changes were identified by two-way anal- ysis of variance (ANOVA). (K) Experimental scheme of the gain of function experiments using embryonic stem cells (ES) differentiated towards the myeloid lineage in coculture with OP9 stromal cells, in the presence of GM-CSF. Doxycycline (DOX) was used to induce Egr2levels at the indicated time before IL-4 treatment (24-h exposure). Cells were harvested for gene expression analysis at day 11. (L) RT-qPCR measurements of the indicated genes from embryonic cell differentiated myeloid cells harboring a doxycycline (DOX)-inducible EGR2 expressing construct. Cells were polarized with IL-4 (24 h) or left untreated (control). The level of mRNA is normalized to the ex- pression ofPpia. Experiments were repeated five times and significant changes were identified by unpairedt-test atP< 0.05.
A C
-1.5 -1 0 1 0.5 1.5
z-score
24h IL-4 induced (n = 649)
24h IL-4 repressed (n = 676)
Control IL-4
Egr2+/+ Egr2fl/fl
Control IL-4
-0.5
-log10(FDR)
0 3 6 9
log2(Fold change) 10
0
-5
-10 5
Repressed n = 1054 Induced n = 845
WT CTRL vs WT 24h IL-4
5% FDR 100
75
25 50
0
Percentage of EGR2 dependent genes (%)
B
Egr2 dependent Egr2 independent
Induced Repressed
649 (77%) 676 (64%)
196 (23%) 378 (36%) 69580 63838
50 Gene count100
200
Gene count (%)
100%
75%
50%
25%
0%
Early sustained Late
Both None
100
50
0
Gene count
Enhancer count
15 10
5 0
Early sustained Late
207 186 132 55
150
KS-test; p < 0.001
150
Early sustained Late
E
D F
H
25 0
P300 (RPKM) 0EGR2 (RPKM)140
EGR2 (+) (n = 632)EGR2 (-) (n = 433) Control IL-4
Egr2+/+ Egr2fl/fl
Control IL-4 Control IL-4
G
-4 -2 0 2 4
log2(CPM)
log2(CPM) Egr2+/+ Egr2fl/fl
-5.0 -2.5 0 2.5
5.0 n.s. *
EGR2 (+) EGR2 (-)
Egr2+/+ Egr2fl/fl
I
EGR2 (+)EGR2 (-)
EGR2 (+) EGR2 (-)
*
* n.s.* Control 6
IL-4
EGR2P300 Control IL-4
Egr2+/+ Egr2fl/fl
Control IL-4
Control IL-4 Control IL-4
Figure 4. EGR2 controls alternative macrophage polarization. (A) Volcano plot of IL-4-induced and -repressed genes in wild-type (WT) macrophages. (B) Stacked bar plot showing the percentages of the IL-4/Egr2-dependent and -independent induced and repressed genes.
(C) Heat map representation of IL-4 altered,Egr2-dependent gene expression. IL-4-induced (left) and IL-4-repressed (right) gene expression is visualized inEgr2+/+andEgr2fl/flmacrophages. (D) Classification of IL-4-induced andEgr2-dependent genes based on the annotated number of regulatory regions exhibiting early sustained or late genome activity patterns. Gene counts for each bar are represented and the circlesbelowindicate the presence or absence of annotated regulatory elements from the genome activity groups. Percentage-wise distribution of the IL-4/Egr2-dependent genes with enhancer regions of the indicated genome activity patterns (stacked bar plot at the right). (E) Regulatory regions showing early sustained and late genome activity patterns are annotated to IL-4/Egr2-induced genes. The number of regulatory elements (enhancer count) annotated to the genes is shown. Differences between distributions were determined by Kolmogorov–Smirnoff test. (F) Read distribution plot of P300 ChIP-seq signal at EGR2 (+) and EGR2 (−) regions fromEgr2+/+and
Egr2fl/flmacrophages in the absence (control) and presence of IL-4 (24 h). (G) Read distribution plot of EGR2 ChIP-seq signal at regulatory
regions showing significant increment in P300 binding around IL-4/Egr2-induced genes. Regions of high EGR2-binding intensity [EGR2 (+)] and with negligible binding [EGR2 (−)] are annotated to the target genes based on genomic proximity. RPKM values are plotted. (H) Box plot representation of the average binding intensity of P300 ChIP-seq from the same conditions as presented inF. Log2transformed CPM (counts per million) values are depicted. Significant changes are determined with Wilcoxon test atP< 0.05. (I) Box plot representation of the average binding intensity of EGR2 at EGR2 (+) and EGR2 (−) regions. Log2transformed CPM (counts per million) values are depicted.
Significant changes are determined with Wilcoxon test atP< 0.05.
EGR2 governs M2 macrophage polarization
Next, we turned our attention to the putative regulatory regions around the IL-4 and EGR2-induced genes display- ing distinct genome activity patterns. Significantly, the majority of the EGR2-induced genes had regulatory ele- ments (±100 kb around the transcription start site) exhib- iting“early sustained,” “late,” or both of these in these genome activities (448/580) in agreement with the pro- posed late and broad stabilizing roles of EGR2. We could not assign such regulatory regions to 132 genes and 55 genes had regulatory elements bearing“early sustained” genome activity (Fig. 4D). The number of regulatory re- gions annotated to IL-4 and EGR2-induced genes showed that the largest gene set possessed only one regulatory el- ement, and these had a bias towards having “early sus- tained”genome activity. Similar number of genes could be linked to two regulatory regions associating with slightly more genomic regions of“late”genome activity.
This latter trend was, in general, true for all of the genes that had more than two annotated enhancers (Fig. 4E).
Thus, transcriptome analysis revealed the very large ex- tent EGR2 is required for the IL-4 initiated late and stable al- ternative MF polarization program. Moreover, these genes are associating with genomic regions of“early sustained” and“late”genome activities strongly suggesting that the ef- fect of EGR2 on polarization-specific gene regulation is di- rect. Therefore, we next wanted to identify the molecular mechanisms by which EGR2 impacts gene expression.
EGR2 induces epigenomic remodeling by direct and indirect means
Identification of the genes with IL-4/STAT6 and EGR2-de- pendent induction allowed us to take a closer look at the epigenetic state of the surrounding regulatory regions. For these analyses, we used 580 genes showing reduced IL-4- induced expression in Egr2−/−MFs. We annotated 1065 regulatory regions falling into a ±100-kb genomic window around the transcription start site of these genes and ex- hibiting IL-4- and EGR2-dependent P300 recruitment based on ChIP-seq data (Fig. 4F,H). Of these regions, 59% (632/1065) bound EGR2 (+), while 41% (433/1065) showed negligible binding signal; thus, we designated them EGR2 negative (−) (Fig. 4G,I). Importantly, EGR2 (+) sites were annotated to 356 EGR2-dependent genes in- dicating direct regulatory roles, accounting for 54% of the total EGR2-induced gene program. Regarding genomic lo- calization, 95% of these genomic regions were distal sites, while 5% were promoter proximal sites (Supplemental Fig. S4E). EGR2 (+) genomic regions showed strong enrich- ment for the EGR TF binding motif. STAT6 and AP-1 mo- tifs were present to similar degrees under both EGR2 (+) and (−) sites. In addition, EGR2 (−) sites showed enrich- ment for the TF motif, MITF, which has been linked to MF functions by physically interacting with the myeloid LDTF, PU.1 (Supplemental Fig. S4F; Luchin et al. 2001).
This classification provided the basis of our analysis to ex- amine the roles of EGR2 at these putative regulatory ele- ments around EGR2-dependent genes.
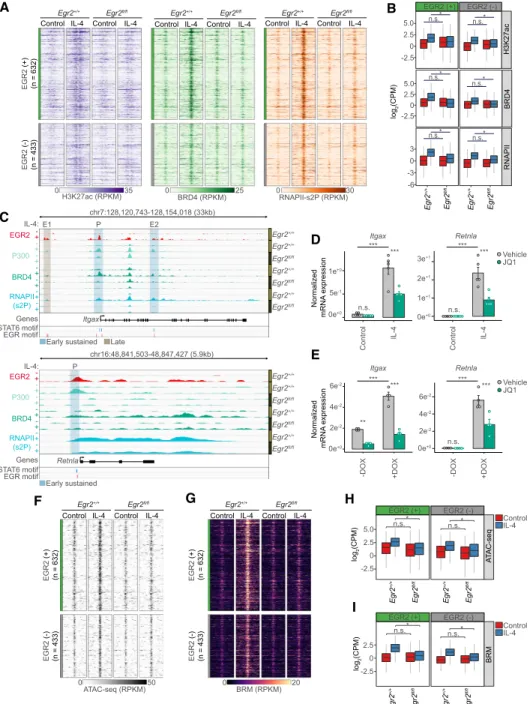
Assessing the active enhancer mark H3K27ac reported that both EGR2 (+) and (−) regions had elevated acetyla-
tion levels in an IL-4 and EGR2-dependent manner (Fig.
5A,B). These data implicate the binding of acetylated his- tone reader proteins to facilitate transcriptional initiation and elongation. Thus, we examined whether EGR2 was required for the recruitment of the acetylated histone reader, Bromodomain-containing protein 4 (BRD4) and whether it correlated with the presence of the elongating RNA polymerase II (RNAPII). BRD4 is required for the phosphorylation of the C-terminal domain of RNAPII on Ser-2 by recruiting the P-TEFb complex to favor transcrip- tional elongation (RNAPII-pS2) (Jang et al. 2005). ChIP-seq analyses for both BRD4 and RNAPII-pS2 showed IL-4-in- duced enrichment at EGR2 (+) and (−) sites, where IL-4- mediated recruitment was EGR2-dependent. (Fig. 5A,B).
To asses whether inhibition of BRD4 affects the IL-4 and EGR2-dependent program, we applied the JQ-1 inhibitor, which ablates the binding ability of BRD4 to acetylated histones in the paradigm of alternative polarization. The inhibitor was added in the last 12 h of the 24-h long IL-4 treatment paradigm in order to avoid the inhibition of the early transcriptional events (Supplemental Fig. S5A).
We examined two representative genes (ItgaxandRetnla) where EGR2 is both required for IL-4-induced transcrip- tion and also for the recruitment of P300, BRD4, and RNAPII-pS2 (Fig. 5C;Supplemental Table S2). The genes showed very low expression levels in the unstimulated state, but IL-4 robustly induced transcription, which was dampened by BRD4 inhibition (Fig. 5D). Similarly, we confirmed these results in our gain of function model sys- tem (Supplemental Fig. S5B) by showing that the exclu- sively EGR2-mediated induction of Itgax and Retnla was impaired upon BRD4 inhibition (Fig. 5E), while it does not have a negative effect on DOX-induced EGR2 ex- pression (Supplemental Fig. S5C). Our results establish the requirement for EGR2 in both the transcriptional and epigenetic programming of IL-4 polarized MFs. How- ever, it remained unclear whether EGR2 also contributed to chromatin remodeling.
EGR2 is required for alternative polarization-induced chromatin remodeling
To examine EGR2’s role in chromatin remodeling during polarization, we assessed chromatin accessibility using as- say for transposase-accessible chromatin sequencing (ATAC-seq) (Buenrostro et al. 2013). Both EGR2 (+) and EGR2 (−) genomic regions exhibited weak ATAC-seq sig- nals in the unstimulated state, but IL-4 very substantially induced accessibility. Polarization-induced chromatin changes were abrogated in the absence of Egr2(Fig. 5F, G). In search of a mechanism, we were wondering whether members of the SWI/SNF, ATP-dependent chromatin re- modeling complex are also recruited to these regions and exhibit similar dependencies. Thus, we assessed the ge- nome-wide localization of Brahma (BRM or SMARCA2), having key ATPase activities in the complex, changing chromatin structure by altering the contacts of nucleo- somes with DNA (Gatchalian et al. 2020). ChIP-seq un- equivocally supported our hypothesis and showed IL-4 and EGR2-dependent chromatin binding of BRM at both
Daniel et al.
1482 GENES&DEVELOPMENT
E
F A B
C
D
I
G H
Egr2+/+
Egr2+/+
Egr2+/+
Egr2+/+
Egr2fI/fI
Egr2fI/fI Egr2fI/fI
Egr2+/+
Egr2+/+
Egr2+/+
Egr2+/+
Egr2fI/fI
Egr2fI/fI Egr2fI/fI
Figure 5. EGR2 establishes an enhancer network in the proximity of its target genes and remodels chromatin. (A) Read distribution plot of H3K27ac, BRD4, and RNAPII-pS2 ChIP-seq signal at EGR2 (+) and EGR2 (−) regions fromEgr2+/+andEgr2fl/flmacrophages in the ab- sence (control) and presence of IL-4 (24 h). (B) Box plot representation of the average binding intensities of H3K27ac, BRD4, and RNAPII- pS2 ChIP-seq from the same conditions as presented inA. Log2transformed CPM (counts per million) values are depicted. Significant changes are determined by Wilcoxon test atP< 0.05. (C) Genome browser view on theItgax andRetnlaloci. ChIP-seq results for EGR2 in wild-type macrophages (Egr2+/+) and P300, BRD4, and RNAPII-pS2 in bothEgr2+/+andEgr2fl/flmacrophages are shown. Polarized (24 h of IL-4 treatment) and control conditions are depicted for each protein. (D) RT-qPCR measurements ofItgaxandRetnlamRNA levels in JQ1 (BRD4 inhibitor) treated control and IL-4 polarized macrophages. Vehicle indicates solvent control for the JQ1 treatment. The level of mRNA is normalized to the expression ofPpia. Experiments were repeated five times, and significant changes between groups were calculated by, two-way analysis of variance (ANOVA). (E) RT-qPCR measurements ofItgaxandRetnlamRNA levels in JQ1 (BRD4 inhib- itor) treated myeloid cells possessing a doxycycline sensitive, EGR2 expressing construct. Experiments were performed in the absence (−) and presence (+) of DOX. Vehicle indicates solvent control for the JQ1 treatment. The level of mRNA is normalized to the expression of Ppia. Experiments were repeated five times, and significant changes between groups were calculated by two-way analysis of variance (ANOVA). (F) Read distribution plot of ATAC-seq signal at EGR2 (+) and EGR2 (−) regions fromEgr2+/+andEgr2fl/flmacrophages in the absence (control) and presence of IL-4 (24 h). RPKM values are plotted. (G) Read distribution plot of BRM ChIP-seq signal at EGR2 (+) and EGR2 (−) regions fromEgr2+/+andEgr2fl/flmacrophages in the absence (control) and presence of IL-4 (24 h). (H) Box plot represen- tation of the average signal intensity of ATAC-seq at EGR2 (+) and EGR2 (−) regions. Log2transformed CPM (Counts Per Million) values are depicted. Significant changes are determined with Wilcoxon test atP< 0.05. (I) Box plot representation of the average signal intensity of BRM ChIP-seq at EGR2 (+) and EGR2 (−) regions. Log2transformed CPM (counts per million) values are depicted. Significant changes are determined with Wilcoxon test atP< 0.05.
EGR2 (+) and EGR2 (−) sites (Fig. 5G,I), perfectly aligning with our ATAC-seq results. Genes (Retnla and Itgax) where EGR2 alone could induce gene expression in the gain-of-function paradigm appeared to be very sensitive to the loss ofEgr2and were unable to recruit BRM to their promoters correlating with complete loss of promoter ac- cessibility (Supplemental Fig. S5D).
These findings, along with the previously observed ef- fects on genome activity patterns highlight the require- ment for EGR2 during alternative polarization as a mediator of transcriptional activation and chromatin re- modeling, acting immediately downstream from STAT6.
The fact that there are similar changes at genomic regions lacking EGR2 binding raised the possibility that these in- direct effects are carried out by EGR2-induced TFs further downstream, leading to the establishment of an at least three-tiered transcriptional cascade.
EGR2 binds and activates enhancers on theEgr2locus indicative of autoregulation
We found so far that EGR2 is induced by the transiently acting STAT6, but its cistrome remains stable, raising the question of what maintains its expression at later time points once STAT6 is gone? We took a closer look at the putative enhancer regions of theEgr2gene locus and observed that EGR2 binds to at least five of these reg- ulatory regions (E9: +96 kb, E13: +110 kb, E19: +159 kb, E20: +165 kb), including one near its promoter (E1) (Fig.
6A). Moreover, all of these regulatory elements possess strong EGR motifs. Looking at our ChIP-seq and ATAC- seq results informed us about the IL-4 and EGR2-depen- dent recruitment of P300, RNAPII, and BRM, while de novo chromatin opening of the E13 enhancer got abrogated in the absence of EGR2 (Fig. 6B). As a proof of principle, we selected two of these enhancers (E13 and E20) and determined their transcriptional activities during the po- larization time course. Enhancer RNA measurements confirmed the presumed role of EGR2 in the induction of both E13 and E20. Specifically, E13 exhibited late EGR2- dependence (24 h), while E20 appeared to be EGR2 regulat- ed at a very early (3-h) time point as well (Fig. 6C). Impor- tantly, the earliest enhancer activities (1 h) were not affected by the loss ofEgr2, in agreement with the previous findings that STAT6 initiates the expression ofEgr2(Fig.
6C). Thus, long-term, high expression level ofEgr2is likely to be at least in part, maintained by an autoregulatory feed- back loop, where EGR2 occupies some of its own enhanc- ers, sustaining its own expression and converting a transient signal to a stable one.
EGR2 regulates the transcription factor cascade of polarization
Next, we assessed the role of EGR2 in the regulation of the downstream TF cascade of alternative polarization. We used the TF database called TFcheckpoint consisting of 1020 TFs (Chawla et al. 2013). Overlaying this list with all the expressed genes (n= 10,943) in macrophages yielded 339 TFs. Of these, 173 showed IL-4 dependent regulation
and 76% (n= 132) wereEgr2-dependent. Loss ofEgr2had minimal enhancing effects on IL-4-mediated TF gene acti- vation or repression (facilitated repressionn= 4, facilitated activationn= 6), while it was required for IL-4-mediated repression of 72 and activation of 50 TF genes, respectively (Supplemental Fig. S6A,B;Supplemental Table S4). Of the IL-4-induced TFs, more have been reported as important regulators of alternative polarization for instancePparg, Klf4,Myc, andBhlhe40but our analyses point to other po- tential candidates, all downstream from STAT6 and EGR2 (Fig. 6D).
Next, as a proof of principle and to establish the hierar- chical relationship between STAT6, EGR2, and a special- ized downstream TF, we focused on PPARG due to its roles in the maintenance of alternative macrophage polar- ization and lipid ligand-induced gene expression and the fact that it was believed to be regulated by STAT6 (Lavin et al. 2014; Dai et al. 2017; Murray 2017). On thePparg gene locus, EGR2 binds to several putative enhancers, re- cruiting P300, BRD4, and RNAPII (Fig. 6E). Gene expres- sion measurements validated the absolute IL-4/STAT6 and EGR2-dependent regulation ofPparg(Fig. 6F,G). In ad- dition, protein expression of PPARG was also entirely Stat6- andEgr2-dependent in the presence of IL-4 (Fig.
6H,I;Supplemental Fig. S6C,D). Moreover, IL-4 facilitated ligand-induced transcription on some of the canonical PPARG target genes (Angptl4, Cbfa2t3, Fabp4, and Plin2) (Daniel et al. 2018b) in an EGR2-dependent manner (Fig. 6J). These results lend strong support to the notion that EGR2 acts immediately downstream from STAT6 and acts upstream of a large number of TFs establishing at least three layers of regulation or an even more complex TF cascade of alternative macrophage polarization.
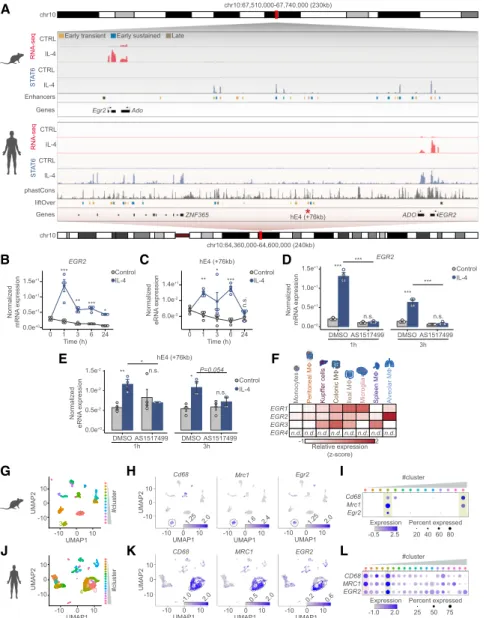
The IL-4/STAT6-inducedEgr2axis is evolutionarily conserved in mouse and human macrophages
EGR2 appears to be a critical regulator of IL-4-induced po- larization of murine macrophages. However, alternative polarization is quite divergent between mice and humans (Noël et al. 2004). Thus, we decided to assess whether IL-4 is able to induce EGR2 in human CD14+monocyte-de- rived differentiating macrophages (Supplemental Fig.
S7A). First, we examined the mouse and human Egr2 gene loci that exhibited considerable conservation as re- vealed by phastCons tracks between the two species (Fig. 7A). Second, we carried out extensive gene expression measurements in the two species. For these experiments, we also included the other major Th2 cytokine IL-13, which robustly inducesEgr2expression in BMDMs (Sup- plemental Fig. S7B). Human macrophages showed similar- ly robust and sustained EGR2 expression upon either IL-4 or IL-13 exposure (Fig. 7B;Supplemental Fig. S7C). More- over, we observed conservation between some of the dis- tant regulatory regions of the mouse and human Egr2 loci. One of these enhancers that is located +76 kb from the human EGR2 gene exhibited strong IL-4-induced en- hancer RNA expression (Fig. 7C). Next, we used a specific STAT6 inhibitor (AS1517499) as a pharmacological loss- of-function tool to assess the roles of STAT6 in IL-4-
Daniel et al.
1484 GENES&DEVELOPMENT
E
F B A
C
D
G I
H J
Figure 6. The IL-4/STAT6/EGR2 axis controls the transcription factor cascade of alternative macrophage polarization. (A) Genome browser view on theEgr2locus. Shown are EGR2 ChIP-seq results in unstimulated (CTRL) and IL-4 polarized macrophages. Motif scores of the EGR motifs overlapping with putative enhancer elements are indicated. Asterisks indicate EGR2 bound regions magnified inB. (B) Genome browser images on the enhancer regions highlighted inA. Shown are ChIP-seq results for EGR2, P300, RNAPII(s2P), and BRM in
Egr2+/+andEgr2fl/flmacrophages in the absence (control) and presence of IL-4 (24 h). ATAC-seq results in the same conditions are also
shown. (C) Enhancer RNA expression detected by RT-qPCR on the indicated loci. The level of eRNA is normalized to the expression ofPpia. Experiments were repeated five times, and significant changes between groups were calculated by two-way analysis of variance (ANOVA). (D) Heat map representation of IL-4 altered (induced and repressed),Egr2-dependent (top) and Stat6-dependent (bottom) tran- scription factor gene expression. IL-4-induced (left) and IL-4-repressed (right) gene expression is visualized in the two genotypes. (E) Ge- nome browser view on thePparggene locus. ChIP-seq data for EGR2 in wild type macrophages (Egr2+/+) and P300, RNAPII(s2P) and BRD4 in bothEgr2+/+andEgr2fl/flmacrophages are shown. Polarized (24 h of IL-4 treatment) and control conditions are depicted for each track.
Regulatory regions with STAT6 and EGR motifs are highlighted. (F) RT-qPCR measurements ofPpargmRNA levels in wild-type (WT) and Stat6−/−control and IL-4 polarized macrophages over the indicated time course. The level of mRNA is normalized to the expression of Ppia. Experiments were repeated five times, and significant changes between groups were calculated by two-way analysis of variance (ANOVA). (G) RT-qPCR measurements ofPpargmRNA levels inEgr2+/+andEgr2fl/fcontrol and IL-4 polarized macrophages over the in- dicated time course. The level of mRNA is normalized to the expression ofPpia. Experiments were repeated five times, and significant changes between groups were calculated by two-way analysis of variance (ANOVA). (H) Western blot of PPARG expression in wild-type (Stat6+/+) andStat6−/−macrophages in the presence or absence of IL-4. Experiments were repeated four times. One representative blot is shown. GAPDH serves as a loading control. (I) Western blot of PPARG expression inEgr2+/+andEgr2fl/fmacrophages in the presence or absence of IL-4. Experiments were repeated four times. One representative blot is shown. GAPDH serves as a loading control. (J) RT-qPCR measurements ofAngptl4,Cbfa2t3,Fabp4,and Plin2mRNA levels inEgr2+/+andEgr2fl/flcontrol and IL-4 polarized macrophages exposed