(2010) pp. 225–240
http://ami.ektf.hu
The software developers’ view on product metrics — A survey-based experiment ∗
István Siket, Tibor Gyimóthy
Department of Software Engineering University of Szeged, Hungary
Submitted 12 November 2009; Accepted 14 February 2010
Abstract
Object-oriented metrics are becoming evermore popular and they are used in many different areas of software development. Many researchers have showed in practice that object-oriented metrics can be efficiently used for quality assurance. For example, a lot of experimental results confirm that some of the object-oriented metrics (likecoupling,size, and complexity) are able to predict the fault-proneness of classes. Quality assurance experts usu- ally accept that actively applying metrics can help their work. On the other hand, developers tend not to use metrics because they do not know about them, or if they do know about them, they do not really know how to use them. Hence we devised aSurveyto ask developers with different levels of ex- perience about the use of metrics. Our hypothesis was that developers with different levels of experience might have significantly different views about the usefulness of metrics.
In the Survey four metrics (size,complexity,coupling, andcode duplica- tion) were examined. TheSurvey asked questions about the participants’ ex- perience and skills, then it asked questions about how the participants would probably use these metrics for software testing or program comprehension, and at the end the relative importance of the metrics was assessed.
The main result of theSurvey is a list which contains those cases where the views about the metrics from developers having different experience sig- nificantly differ. We think that getting to know the developers’ views better can help us to create better quality models based on object-oriented metrics.
Keywords:Survey, object-oriented metrics, program comprehension, software testing.
∗This study was supported in part by the Hungarian national grants OTKA K-73688 and TECH_08-A2/2-2008-0089-SZOMIN08.
225
1. Introduction
Quite a lot of object-oriented metrics have been defined and published (for example, Brito e Abreu’s MOOD metrics [5]) since Chidamber and Kemerer published the first notable article in this area, which discussed 6 object-oriented design metrics [4].
Besides their “simple presentation”, they investigated how metrics could be applied for quality assurance. Other surveys looked at the relationship between the object- oriented metrics and the number of bugs found and corrected in software products.
For example, Basili et al. [1] examined the relationship between Chidamber and Kemerer metrics and the fault density on a small/medium-sized software system.
We repeated Basili’s experiment on Mozilla [8], while Olague et al. [9] carried out a similar experiment on six different versions of Rhino, but they examined more metrics. The common conclusion of these studies was that metrics could be used to predict bugs, hence they can be used to measure the quality aspect of a piece of software.
In general we can say that experts very familiar with metrics accept that met- rics can be used efficiently in different areas of software development. On the other hand, developers hardly use metrics in their everyday work because they do not know the metrics well enough, or they know about the metrics but they do not know how they can apply them. Therefore we devised a Survey to get to learn about the developers’ knowledge and views of object-oriented metrics and also to see how experience influences the assessment of their practical worth. We asked 50 software engineers working at our department on industrial and R&D projects to take part in our experiment and to fill out an online Survey. The participants’ ex- perience was wide ranging because there were both very experienced programmers and students with very little experience among them. Our hypothesis was that there was a significant difference between the views of senior programmers experi- enced in different areas of software development and junior developers about the usefulness of metrics. This experiment validated these suspicions in many cases.
For example, the senior and junior programmers often judged generated classes with bad metric values quite differently, regardless of the metric they were asked about. On the other hand, we did not find any significant difference in certain situ- ations. One example might be that the senior and junior participants’ opinions did not differ significantly from the point of view of program comprehension. Hence, one of the Survey results is a set of hypotheses. The aim of a further investigation is to validate these results by involving some of our project partners. If we can reliably characterize the views of senior and junior developers about the usefulness of metrics, then we could develop the kind of metric-based tools which support development and run more efficiently.
In this paper we will proceed as follows. In the next section we will introduce the Survey and the main results will be discussed in detail. In Section 3 we will discuss several other articles which addressed the same problems. Then in Section 4 we will present our main conclusions, and outline our plans for future study.
2. Survey
In this section we will present the Survey and our main findings. It contained over 50 questions, so due to lack of space we cannot present all the questions and results. Therefore we will only describe the Survey in general, and only the most interesting questions and most important results will be elaborated on.
The Survey can be divided into three parts. The first part (Section 2.1) contains several general questions about the participants’ experience and skills. From the responses we were able to get a general picture about the participants.
The rest of the questions examined the participants’ views about the object- oriented metrics and about the connection between these metrics and program comprehension & testing. Since object-oriented programming is class-based, we examined only class-level metrics. We could have examined many different metric- categories and specific metrics but in that case the Survey would have been too long. Therefore only four general categories (size, complexity, coupling, and code duplications) and only one metric per category were selected for the Survey.
• Thesize metric we chose was Lines of Code (LOC), which counts all non- empty and non-comment lines of the class and all its methods implemented outside the class definition.
• Weighted Methods for Class (WMC), which measures the complexity of a class, is defined as the sum of the complexity of its methods where the McCabe cyclomatic complexity is used to measure their complexity.
• Coupling metrics measure the interactions between the program elements and Coupling Between Object classes (CBO), the chosen metric from this category, counts the number of other classes “used” by the given class.
• In the case ofcode duplications (later we will refer to this category asclones as well), theClone Instances(CI) metric was chosen which counts the number of duplicated code instances which are located inside the class.
In the second part (Section 2.2) the metrics were examined one by one; more precisely, we asked exactly the same questions about all four metrics to see what the participants thought about them. The third part can be found at the end of the Survey (Subsection 2.3) where the metrics were examined together in the questions and the participants had to rank the metrics by their importance.
The 50 participants who filled out the questionnaire at our Software Engineering Department all work on industrial and R&D projects. They ranged from begin- ner students to experienced programmers so the participants’ experience and skills differed greatly. Consequently we examined how the different levels of experience influenced their assessment on the practical worth of the metrics examined in the Survey. This meant that besides the presentation of the answers and their dis- tribution, statistical methods were applied to see whether experience affected the participants’ responses or not.
In the following we will present the most important parts of the Survey and the conclusions drawn from it in the following way: after each question or group of questions (if they belong together) the possible answers and the set of participants
who indicated the given answer are presented in percentage terms. In addition, after each question we discuss the results and conclusions drawn.
2.1. Questions about the participants’ skills
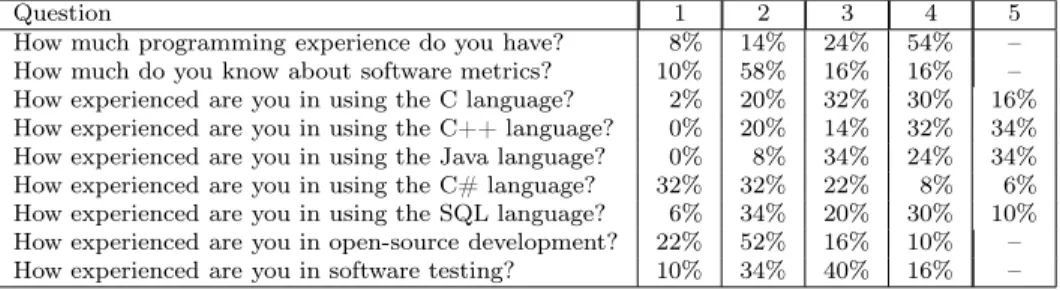
The first questions measured the participants’ experience and skills. The partic- ipants had to rank their experience and skills from 1 (least experienced) to 4 or 5 (most experienced).1 Since there was no point in drawing any conclusion from the individual questions, the following questions were examined together and the conclusions drawn are presented after them. So, first the questions and the distri- butions of the answers are presented in Table 1.
Question 1 2 3 4 5
How much programming experience do you have? 8% 14% 24% 54% – How much do you know about software metrics? 10% 58% 16% 16% – How experienced are you in using the C language? 2% 20% 32% 30% 16%
How experienced are you in using the C++ language? 0% 20% 14% 32% 34%
How experienced are you in using the Java language? 0% 8% 34% 24% 34%
How experienced are you in using the C# language? 32% 32% 22% 8% 6%
How experienced are you in using the SQL language? 6% 34% 20% 30% 10%
How experienced are you in open-source development? 22% 52% 16% 10% – How experienced are you in software testing? 10% 34% 40% 16% –
Table 1: The general questions and the distributions of the replies
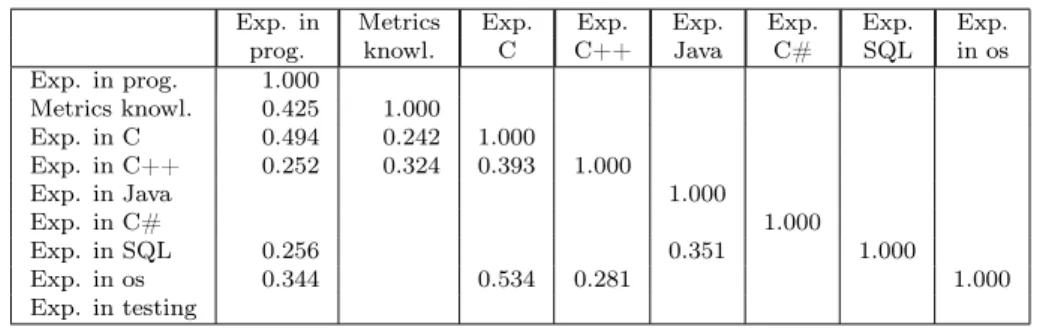
First, we examined whether there was any connection between the different ex- perience and skills mentioned above. In spite of the fact that the results inferred from these questions cannot really be generalized to any other group of develop- ers because they are greatly influenced by the group structure of our department, we will present them and briefly explain them. We applied the Kendall tau rank correlation [3] with a 0.05 significance level to see whether there was any connec- tion between the participants’ experience and skills or not. Table 2 contains only the significant correlation coefficients. These results highlight some of the typical features of our department. For example, our most experienced programmers use C/C++ (the corresponding correlation coefficients are 0.494 and 0.252) and many of them took part in open source projects as well (0.344), where all the project were written in C/C++ (0.534 and 0.281). Java and C# are less frequently used in our department (there are no significant correlations) but our applications writ- ten in Java also use databases, which indicates a correlation between Java and SQL (0.351). And finally, object-oriented metrics are one of our research areas, hence many of us working here are very familiar with them.
Now, we will examine how experience and skills acquired in different areas influenced the responses. The results of 5 out of the 9 questions listed above were
1The answers for these questions were full sentences expressing different levels of experience and skills, so the programmers could easily and accurately rank themselves on the given scale.
However due to lack of space we cannot present these answers here but only their distributions.
Exp. in Metrics Exp. Exp. Exp. Exp. Exp. Exp.
prog. knowl. C C++ Java C# SQL in os
Exp. in prog. 1.000
Metrics knowl. 0.425 1.000 Exp. in C 0.494 0.242 1.000 Exp. in C++ 0.252 0.324 0.393 1.000
Exp. in Java 1.000
Exp. in C# 1.000
Exp. in SQL 0.256 0.351 1.000
Exp. in os 0.344 0.534 0.281 1.000
Exp. in testing
Table 2:Correlation between experience in different areas and skills
included (experience in C, Java, C# and SQL were not taken into account). In the rest of this study we applied only two categories, senior (experienced) and junior (inexperienced), thus the 4 or 5 possible answers of a question had to be placed into one of the two categories. Since there was no exact definition about a person’s amount of experience in a particular area, we drew the borderline between the categories ourselves. We categorized the responses for the 5 questions and the results can be seen in Table 3.
Question No. of junior part. No. of senior part.
Experienced in programming 23 (46%) 27 (54%)
Metrics knowledge 34 (68%) 16 (32%)
Experienced in C++ 17 (34%) 33 (66%)
Experienced in open-source 37 (74%) 13 (26%) Experienced in testing 22 (44%) 28 (56%)
Table 3: The scores obtained for the senior and junior participants
2.2. Questions about metrics separately
The following questions examined the metrics separately, which means that only one metric was considered in each question. Besides the usefulness of metrics, we examined whether there was any significant difference between the responses of the senior and the junior participants. We applied Pearson’s χ2 test with a 0.1 significance level to see whether there was statistical correlation between the expe- rience level and the judgment of metrics. Thenull hypothesisis that a participant’s judgment of a metric does not depend on experience. The alternative hypothesis is that experience influences a participant’s judgment of metrics. In each case we carried out a test and either accepted the null hypothesis or rejected it (then, we accepted the alternative hypothesis).
We know that the size of the sample is small, hence the test is less reliable and since the sample was collected from our department the results cannot really be generalized to any other software engineering team. In spite of this, the results presented in this article show that it is worth investigating this topic in greater
depth because the results reveal a potential problem about the usage of metrics in practice.
In the following, each question was asked for each metric category (although there was one case where it was no use asking about code duplications). For all the questions and for each experience and skill group defined in the previous subsection we examined the connection between the experience and skills and the replies given to the questions. These results are also presented after the questions.
2.2.1. Metrics used for program comprehension and testing
The first two kinds of questions examined how metrics can help in understanding or testing an unknown part of a familiar program. The question was posed for understandingwith asizemetric only, but the same one was asked withcomplexity, coupling, and clonemetrics, and all four questions were repeated with testing.
Question1: Suppose that you haveto become familiar with(or to test) a system whose development you did not take part in. Does the size (complexity,coupling, and clones) of the classes in the system influence your understanding (testing approach)?
• A1: Yes, it is easier to understand them if the system consists of more, but smaller classes
• A2: Yes, it is easier to understand them if the system consists of fewer, but bigger classes
• A3: No, the size of the classes does not influence my understanding
• A4: I am not sure
• A5: In my opinion, size itself is not enough for this and I suggest using other metrics as well
Metric Understanding Testing
A1 A2 A3 A4 A5 A1 A2 A3 A4 A5
Size 28% 6% 10% 6% 50% 36% 10% 16% 6% 32%
Complexity 68% 6% 6% 0% 20% 80% 2% 2% 2% 14%
Coupling 56% 12% 6% 4% 22% 80% 2% 2% 0% 16%
Clones 64% 8% 14% 4% 10% 64% 8% 14% 4% 10%
Table 4: The distributions of the replies for Question1
The distributions of the responses for the four key questions are summarized in Table 4. The figures in bold represent the answers which were selected by most participants. From the point of view of understanding half of the participants would have chosen other metrics than size (A5), while 28% of them said that programs containing more but smaller classes were more understandable (A1). In the case of testing the scores changed a lot because 36% of them indicated that it was easier to test programs that had more but smaller classes (A1), but only slightly fewer participants (32%) wanted to choose another metric than size (A5). In the case of complexity, coupling and clones more than the half of the participants said that it was easier to understand programs containing more but less complex or less
strongly coupled classes, or classes containing fewer clones (A1). This score is even more remarkable in the case of testing.
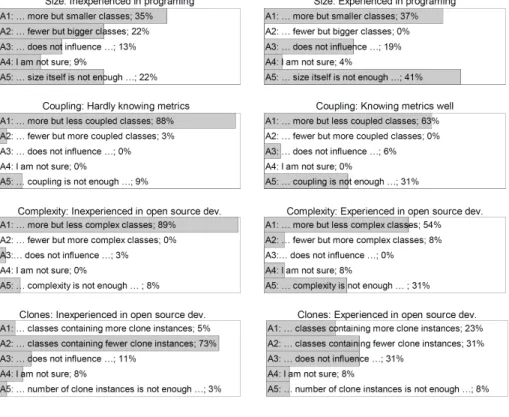
Figure 1: The distributions of the senior and junior participants’
answers for Question1 when testing was considered
We found that from the point of view of understanding there was no significant difference between the responses of the senior and junior participants. On the other hand, with testing we found that, in 4 out of the 20 cases, experience and skills significantly influenced the person’s assessment of the metrics. Figure 1 shows the distributions of the responses of the senior and junior participants for the questions where the difference is significant and their justifications are the following:
Experience in programming and size: 22% of the participants inexperi- enced in programming thought that it was easier to test fewer but bigger classes while experienced ones rejected this answer. On the other hand, many more expe- rienced programmers (41% versus 22%) thought that size itself was not enough to decide this question.
Metric knowledge and coupling: 25% fewer people quite familiar with met- rics thought that low coupling was better for testing but significantly more of them (8% versus 31%) thought that coupling itself was not enough to assess the testing aspect.
Experience in open source and complexity: Most of the programmers
not experienced in open source systems (89%) thought that more but less complex classes could be tested more easily while only 54% of open source developers, which is 35% less than the other group, had the same opinion. On the other hand, almost one third (31%) of open source developers said that complexity was not enough while only 8% of the other group marked this option.
Experience in open source systems and clones: Most of the inexperienced open source programmers (73%) said that fewer clones were easier to test. However, the experienced group was divided on this point since 3 possible answers were chosen with more or less the same frequency (from 23% to 31%).
2.2.2. Acceptable reasons for bad metric values
When a part of a given source code has bad metric values (e.g. due to strong coupling), it is suggested that the code be refactored so as to improve its quality.
But in some cases bad metric values may be accepted. For example, we will not refactor a well-known design pattern just because of its bad metric values. The next questions examined what kind of reasons the participants can accept for this.
Question2: What reasons would you accept for a class being too large? (Several answers can be marked.)
• A1: No reason at all
• A2: A well-known design pattern
• A3: The implemented functionality requires a large size
• A4: The source code of the class is generated from some other file
• A5: The class must fit a given API
• A6: If the large size does not make understanding difficult
• A7: It has been tested and works properly
• A8: I cannot decide
• A9: Any other reason (with a justification)
Metric A1 A2 A3 A4 A5 A6 A7 A8 A9
Size 2% 34% 52% 56% 56% 24% 28% 2% 4%
Complexity 2% 36% 80% 46% 30% 36% 28% 2% 0%
Coupling 4% 36% 56% 38% 52% 26% 26% 8% 0%
Clones 18% 42% 22% 68% 24% 12% 14% 4% 4%
Average 6.5% 37% 52.6% 52% 40.5% 24.5% 24% 4% 2%
Table 5: The acceptance rates of the different reasons (Question2)
Table 5 shows the distributions of the replies, expressed in percentage terms.2 It is interesting that though many participants said that bad metric values made understanding and testing difficult, only a few of those questioned indicated that they did not accept any reason (A1) or that they could not decide (A8) based on a large size, complexity or coupling. More participants (18%) rejected the clones option but this percentage is still not very high, so we can say that to some extent
2Since an arbitrary number of replies could be given for these questions, the sum of the scores for a question is not 100%.
bad metrics values can be accepted. The answers fromA2toA7that reflect some special excuses got notable scores. The most widely accepted reasons were the implemented functionality (A3) andthe generated code(A4) butthe design patterns (A2) andthe given API (A5) also had high scores. The remaining two reasons (A6 andA7) are still worth examining but they got much lower scores.
We also examined the difference between the senior and junior participants’
responses in this case. More answers could be marked for this question, therefore every answer was handled separately and we examined whether there was a sig- nificant difference between the answers of the senior and junior participants who accepted the given reason. Since answers A1,A8, andA9 were rarely marked, we decided to exclude them from any further investigation. On the other hand, the excluded answers are just synonyms of “I do not know”, therefore all real excuses will be discussed. Table 6 shows the results where the possible answers can be found in the rows and the given metric categories are presented in the columns.
Where a significant difference was found between the answers of the two groups, an abbreviation of the participant’s experience or skill was written in that table cell.
For example,test in the second row (A3) and in the second column (Complexity) means that there was a significant difference between the replies of participants experienced in testing well and the replies of participants with little experience in testing.
Size Complexity Coupling Clones
A2
A3 test o.s., test
A4 exp, met, C++, test exp, met, C++, test exp, met exp, met, C++, test A5 exp, met
A6
A7 exp, met, C++, o.s. met o.s. met, test
Table 6: Significant correlations between the participant’s experi- ence and skills and the different excuses
Since too many significant cases were found, we will discuss them in general and only one example will be presented. First, we will analyze the results from the point of view of experience groups. Metric knowledge (met) influenced the judgment of metrics in 8 out of the 24 cases, which is 33.3%. Experience in programming (exp) and experience in testing (test) influenced their judgment 6 times (25%), while experience in C++ (C++) influenced their judgment 4 times (16.7%). Experience with open source systems had the smallest effect because the replies of the two groups differed only in 3 cases (12.5%). We may conclude from these questions that the participants’ experience or skills have a notable influence on the judgment of metrics.
Next, we examined how the opinions of the participants varied based on the given replies. The judgment of generated classes (A4) affected the opinions of the senior and junior participants in most cases: programming experience and metric knowledge always divided their opinions and having experience in C++
and experience in testing influenced them significantly in 3 cases. On the other hand, experience in open source development had no effect in this case. A typical opinion about thetested code(A7) was the other possible reason that had different judgments. In this case, the judgments ofsize andclones differed in four and two cases, respectively, but with the other two metric categories the answers of the two groups were very similar in four out of the five cases. This means that here the difference between the opinions of the senior and junior participants was significant in 8 out of the 20 cases examined. After these observations it was interesting that the judgments ofunderstandable source code(A6) anddesign pattern(A2) were the same. Only several significant differences were found when the other two reasons (A3 andA5) were investigated.
Figure 2: The distributions of the senior and junior participants’
replies (Question2)
Due to lack of space we cannot discuss all 27 significant differences one by one, hence we present only one example. Figure 2 shows that 74% of the participants experienced in programming accept large generated classes and only 26% of them reject such classes. On the other hand, only 35% of the participants inexperienced in programming accept it and 65% of them reject large generated classes. This is a good example because it shows how much the senior and junior participants’
judgment of metrics can differ.
2.2.3. Sharing testing resources based on metrics
Testing is a very important phase of software development. Its aim is to reveal all the bugs in the source code, but for large software packages this is impossible because the testing resources (testers, time, etc.) are limited. Hence, we have to share testing resources among the parts of a program and it is important how we do it. The better the testing resources are shared, the more effective the testing phase is, which means that more bugs can be found. We examined how the partic- ipants would probably share testing resources if they knew the metric values of the elements in advance. A very simple example (consisting of two classes) was chosen to see how the participants would share testing resources.
Question3: Suppose that there are two classes in an unknown system where the size of class A is 1000 lines (LOC) and the size of class B is 5000 lines. The quality of the two classes is almost the same. During the development the size of class A increased by 10 percent and the size of class B increased by 2 percent. How would you share your testing resources?
• A1: I would test only class A
• A2: I would spend 90% of the testing res. on class A and 10% on class B
• A3: I would spend 75% of the testing res. on class A and 25% on class B
• A4: I would spend the testing resources equally on the two classes
• A5: I would spend 25% of the testing res. on class A and 75% on class B
• A6: I would spend 10% of the testing res. on class A and 90% on class B
• A7: I would test only class B
• A8: I would not determine it based on size
• A9: I cannot decide
The same question was asked for complexity where the complexity (WMC) values of class A and B were 100 and 500, and for coupling where the coupling (CBO) values of class A and class B were 20 and 100, respectively. We did not ask about code duplications here because it would not have made any sense.
Metric A1 A2 A3 A4 A5 A6 A7 A8 A9
Size 0% 0% 8% 12% 30% 0% 0% 48% 2%
Complexity 0% 4% 10% 34% 30% 6% 0% 12% 4%
Coupling 0% 2% 10% 28% 28% 6% 4% 20% 2%
Table 7: The distributions of the replies for Question3
The results of the responses are listed in Table 7. Almost half (48%) of the participants said that they would not share testing resources based on size (A8) while 30% of them said they would spend 75% of the testing effort on class A (A5).
With the complexity issue, most participants (34%) said they would share testing resources equally between the two classes (A4) but only slightly fewer (30%) said that they would spend 75% of the testing resources on class A (A5). In the case of coupling answersA4andA5 got the same response (28%), which is very similar to what we got with complexity.
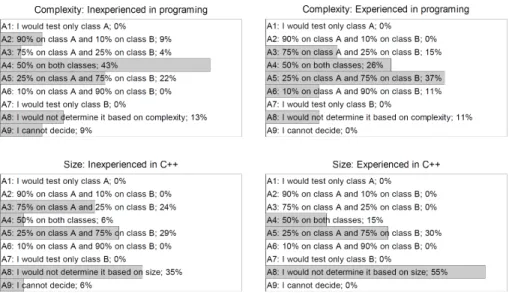
Figure 3: The distributions of the senior and junior participants’
replies for Question3
We found in two cases that experience and skills had a significant effect on the kind of answers of Question3(see Figure 3). These two cases are the following:
Experience in programming and complexity: 48% of the (37% and 11%) participants experienced in programming thought that it was the absolute complex- ity of the classes that matters from a testing perspective and not the increment after a change (A5andA6). In contrast, participants inexperienced in programming said they would share testing resources equally (A4).
Experience in C++ and size: More than half of the senior C++ program- mers (55%) would not rely on size for test design (A8), and they (30%) thought that absolute size was more important than any increment (A5). The opinions of the junior C++ programmers were heterogeneous, which meant that two answers conflicting with each other (A3andA5) had significant scores and they were almost the same (24% and 29%).
Besides these four questions (actually, there are a lot of questions but they can be classified into four basic categories), there were other questions which examined the metrics individually. Due to lack of space they will not be presented in detail, but will be mentioned only briefly.
We analyzed ten systems3and calculated the averages of the metrics and what percentage of the classes exceeded the triple of the average of the metric values in question. For a given metric both values of the systems were presented anony- mously on a diagram and the participants were asked to classify the systems into 7 quality categories using the diagrams. The categories ranged fromvery bad qual- ity to very good quality. We gave the same task for all four metrics mentioned previously.
We investigated the participants’ opinions about what the optimal size (com- plexity and coupling) for a class in an object-oriented system was (minimum and maximum values could be given) and what the code size was, above which the clone instances should be eliminated (a limit could be given).
2.3. Questions about the importance of metrics
In the third part of the Survey the importance of each metric was examined. In these questions more than one metric was used at the same time and the partici- pants had to select those they thought were the better ones, and they also had to rank them.
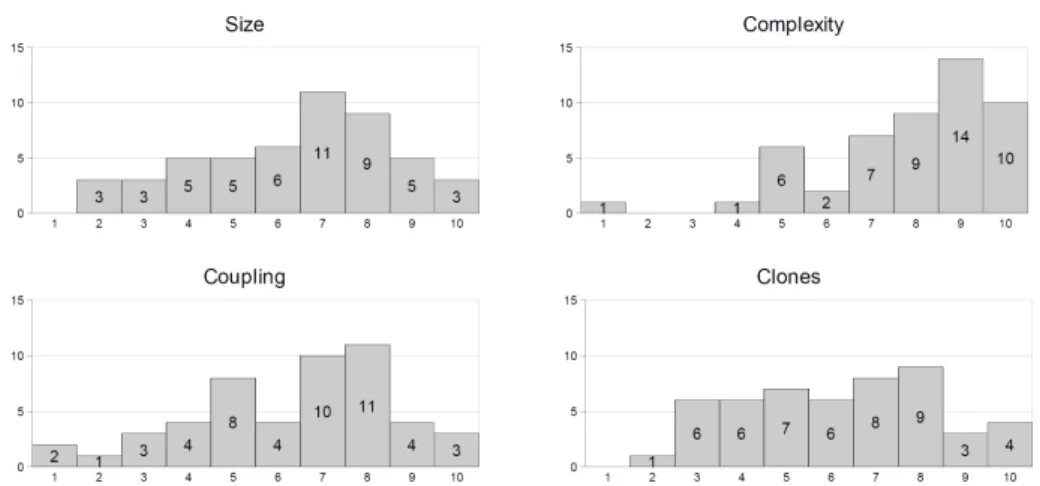
Question4, the only question delineated from this part of the Survey, examined the importance of the metrics from a testing point of view. The participants had to weight the four metrics (size, complexity, coupling, and code duplications) when deciding how useful the four metrics were. The weight ranged from 1 (the least useful) to 10 (the most useful).
Figure 4 gives a histogram representation of the responses. According to the participants surveyed,complexityis the most relevant metric because the two high-
3We analyzed 6 industrial and 4 open source systems. Among the industrial ones there were telecommunications, a graphical application, and a code analysis system, while the four open source systems were Tamarin, WebKit, Mozilla, and OpenOffice.org.
Figure 4: The distributions of the senior and junior participants’
replies for Question4
est weights got the biggest response and its average (7.88) is the largest. The two most frequent weights of the other three metrics are the same (weights 7 and 8) and their averages (size 6.40, coupling 6.34, and clones 6.20) are almost the same. De- spite the fact that the distributions of the three metrics differ, we can say that their degree of importance is very similar, but they seem less important than complex- ity. This result is slightly surprising because in an earlier paper [8] we investigated which metrics could be used to predict the fault-proneness of the classes and we found that CBO (coupling) and LOC (size) metrics came out top while WMC (complexity) got a lower score, which seems to contradict these new findings.
2.3.1. An experiment on Mozilla
In an earlier paper [8] we examined the fault-proneness property of eight object- oriented class level metrics. We calculated the metrics for seven different versions of Mozilla [12] (from version 1.0 to version 1.6), collected the reported and corrected bugs from the bug tracking system called Bugzilla [2] and associated them with the classes. This way we knew the metric values and the number of bugs for each class in each version so we could examine how well the different metrics could predict the fault-proneness property of classes. Although we had all the necessary information for all the Mozilla versions, we chose version 1.6, which contained 3,209 classes, and carried out the experiment on this version. We applied a statistical method (logistic regression) and machine learning (neural networks and decision tree) to predict whether a given class was bug-free (containing no bug) or faulty (containing at least one bug). We examined the metrics one by one with each method and the results of the three methods were very similar. We found that CBO was the best metric but LOC was only a slightly worse and WMC also gave good results. On the other hand, code duplication was not examined, so we have no information about the usefulness of the CI metric.
We carried out an experiment to investigate the result of Question4 on Mozilla version 1.6. We examined which weight combination given by the participants could find the most classes which contained at least 10 bugs. For this we defined a simple model in the following way: for each class we calculated the weighted sum of its four normalized metrics (LOC, CBO, WMC and CI) where the weights were the answers of Question4. Then, the classes were sorted by their weighted sum and the top 177 were selected as faulty classes. We selected only the top 177 because there were 177 classes in Mozilla version 1.6 which contained at least 10 bugs. We examined how many of the 177 classes selected by the given model really contained at least 10 bugs so we could compare the “quality” of the models. The more such classes the model found, the better it was. We examined all 50 models and discovered that the best one found 113 out of the 177 classes, which means that it found 63.8% of the worst classes. Here, the weights of the model were the following: size = 3, complexity = 8, coupling = 9, and clones = 3.
3. Related works
Our earlier experiment on Mozilla [8] was described in Section 2.3.1 above. In this summary we can see that metrics can be used for fault-proneness but at a different level. However, instead of presenting other similar empirical validations (e.g. Yu et al. [13], Fioravanti and Nesi [6], Basili et al. [1], and Olague et al. [9]), we will summarize another survey.
The ISO/IEC 9126 international standard [10] defines the relationship between the system quality and ISO/IEC 9126 subcharacteristic. The Software Improve- ment Group (SIG) introduced another level below the subcharacteristics which consists of system properties and they defined a binary mapping between ISO/IEC 9126 subcharacteristics and system properties. José et al. [11] carried out a survey to examine the connection between system properties and quality characteristics for maintainability. 22 software quality experts of SIG were asked to take part in their experiment. The participants had to compare the 4 maintainability subchar- acteristics with each other (6 comparisons) and the 9 systems properties with each other for each subcharacteristic (4 times 36 comparisons), so a participant had to make 150 comparisons. They used a scale of 1 (equal importance) to 5 (extreme importance) to rate the relative importance. There were three main questions that they wanted to answer with their survey.
Does the weighted mapping represent agreement among experts? The result was that, at the level of subcharacteristics, 2 out of 4 relations were non-consensual, while at the level of system properties 7 out of the 36 relations were non-consensual.
How similar are the weighted mapping and binary mapping? After the evalua- tion they found that in 7 cases the result had to be excluded because there was no consensus; in 21 cases the result confirmed the earlier definitions; in 2 cases new relations were found; and 6 were not presented.
Can the difference between the mappings be somehow used to refine the quality model? In the case of mapping from subcharacteristics to maintainability, the re-
sults suggested that the relative weight of testability should be increased and the weight of stability should be decreased. However, the consensus among the experts was too small to warrant the change. On the other hand, there was a better consen- sus among the experts for mapping from system properties to subcharacteristics.
After excluding non-consensual relations, several changes were recommended.
4. Conclusions and future work
The main motivation for this Survey was to learn more about the developers’
expertise and opinions concerning object-oriented metrics and to investigate how experience influenced their assessment of metrics.
The main contributions of this paper are the following. Firstly, we listed a set of interesting questions of our Survey which examined the software engineers’ opinions about four object-oriented metrics. Secondly, we presented the distributions of the replies and drew some conclusions about them. Thirdly, we examined the relationship between the experience and skills of our programmers. Fourthly, we applied a statistical method to see how experience affects the assessment of these metrics and we devised hypotheses based on them. And finally, we carried out an experiment on Mozilla to see which metrics were important in bug prediction.
Our main observations are the following. First, we did learn more about the participants’ opinions concerning the four metrics in different situations. Second, we found that in certain cases experience in different areas significantly affects the assessment of the metrics. Third, the importance of metrics in testing is not in accordance with the results of experiments [8, 1] which examined the relation- ship between metrics and fault-proneness. Fourthly, we devised several hypotheses which asserted that there were significant differences between the senior and junior programmers’ assessments of metrics (for example, generated code with wrong met- ric values was judged differently in 14 out of the 20 cases). The main conclusion is that we need to investigate this topic in greater depth because some of the results here are quite surprising.
In the future we plan to repeat this experiment with our industrial partners to survey the same questions, but in different circumstances. This way we can verify our observations and we should have more reliable conclusions. Furthermore, we will refine the Survey by using the experience gained during this experiment. We examined only four metric categories here, but there are many other interesting issues which are worth investigating. Hence, we plan to incorporate other kinds of metrics (e.g.cohesion metrics) and design issues (e.g.bad smells [7]) into our next Survey.
References
[1] Basili, V. R., Briand, L. C., Melo, W. L., A Validation of Object-Oriented Design Metrics as Quality Indicators, InIEEE Transactions on Software Engineering,
volume 22, (1996) 751–761.
[2] Bugzilla for Mozilla, http://bugzilla.mozilla.org.
[3] Chalmer, B. J., Understanding Statistics, CRC Press, 1986.
[4] Chidamber, S. R., Kemerer, C. F., A Metrics Suite for Object-Oriented Design, InIEEE Transactions on Software Engineering 20,6(1994), (1994) 476–493.
[5] e Abreu, F. B., Melo, W., Evaluating the Impact of Object-Oriented Design on Software Quality, In Proceedings of the Third International Software Metrics Symposium, IEEE Computer Society, March 1996, 90–99.
[6] Fioravanti, F., Nesi, P., A Study on Fault-Proneness Detection of Object- Oriented Systems, In Fifth European Conference on Software Maintenance and Reengineering (CSMR 2001), March 2001, 121–130.
[7] Fowler, M., Beck, K., Brant, J., Opdyke, W., Roberts, D., Refactoring:
Improving the Design of Existing Code, Addison-Wesley Pub Co, 1999.
[8] Gyimóthy, T., Ferenc, R., Siket, I., Empirical Validation of Object-Oriented Metrics on Open Source Software for Fault Prediction, In IEEE Transactions on Software Engineering, volume 31, IEEE Computer Society, October 2005, 897–910.
[9] Olague, H. M., Etzkorn, L. H., Gholston, S., Quattlebaum, S., Empirical Validation of Three Software Metrics Suites to Predict Fault-Proneness of Object- Oriented Classes Developed Using Highly Iterative or Agile Software Development Processes, InIEEE Transactions on Software Engineering, volume 33, June 2007, 402–419.
[10] International Standards Organization. Software engineering - product quality - part 1: Quality model, ISO/IEC 9126-1 edition, 2001.
[11] Kanellopoulos, Y., Correia, J. P., Visser, J., A Survey-based Study of the Mapping of System Properties to ISO/IEC 9126 Maintainability Characteristics, In The International Conference on Software Maintenance (ICSM’09), IEEE Computer Society, September 2009, 61–70.
[12] The Mozilla Homepage, http://www.mozilla.org.
[13] Yu, P., Systä, T., Müller, H., Predicting Fault-Proneness using OO Metrics:
An Industrial Case Study, InSixth European Conference on Software Maintenance and Reengineering (CSMR 2002), March 2002, 99–107.
István Siket, Tibor Gyimóthy Department of Software Engineering University of Szeged
H-6720 Szeged Árpád tér 2.
Hungary
e-mail: siket@inf.u-szeged.hu gyimi@inf.u-szeged.hu