Microtopography Changes in Wear Process
Béla Palásti-Kovács*, Zoltán Néder**, Árpád Czifra**, Károly Váradi**
* Budapest Polytechnic, H-1081 Budapest, E-Mail:palasti.bela@bgk.bmf.hu
** Budapest University of Technology and Economics, H-1111 Budapest E-Mail:varadik@eik.bme.hu
Abstract
Wear experiments and measurements were performed to study surface microtopography changes. Investigations extended to wear in the course of the non-lubricated sliding friction of ground bronze-steel sliding pairs. In the knowledge of 3D microtopography, asperities were statistically processed. Asperities were replaced by paraboloid and pyramidal surfaces, in order to determine the distribution of the direction angle of asperities, the height distribution of the peak points, the radius distribution of the peak curvatures, and slope angle distribution. These can be properly used for characterizing microtopography changes in the course of the wear process. It was also examined what additional information was provided by SEM recordings of surfaces on surface structure, with particular regard to tribological phenomena.
Key words: microtopography, asperities, wear, statistical analysis
1. Introduction
The operation, reliability, and lifetime of parts produced in different ways greatly depend on the quality of machined surfaces as well. Higher quality criteria require adequate accuracy of manufacturing as well as a deeper analysis of surface microtopography. Surface quality includes surface microgeometry discrepancies, such as roughness and waviness as well as the physical and chemical conditions of the surface layer, the latter including plastic deformation in the course of machining, hardness of the surface layer, residual stress, texture, and chemical composition [1].
The relationship between surface quality and the wear process has been studied by Whitehouse [2], Hirst and Hollander [3] and others; however, no general correlation has been managed to be established. Nevertheless, practical research is characterized by investigation of the wear of particular material pairs under certain
changes of only few surface roughness parameters (ex. average roughness). In most cases only the impact of initial surfaces of varying roughness is investigated there as well.
This study involves surface microgeometry investigations. The aim is to trace microgeometry changes on surfaces in the course of the wear process. In our work, the results of tests by stylus instrument and scanning electron microscope were processed to characterize the wear process on surfaces. For evaluation, surface asperities were replaced by paraboloids and pyramids and the distribution function changes of the surfaces received this way were studied.
2. Test and evaluation procedures for studying the wear process
2.1. Wear experiments
The aim of the experiments performed was to model the friction / wear process of machine elements under certain circumstances by wear experiments simple to be performed by which the changes of surface microtopography can be obtained.
Steel track
Clamp Bronz specimen
Screw spindle
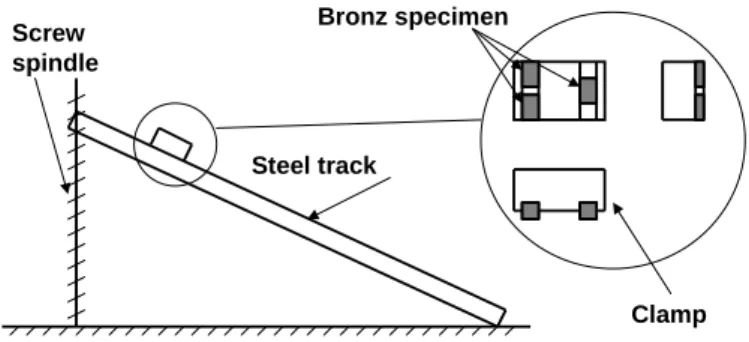
Figure 1. Arrangement of the experiment
A steel sliding track was used for the tests, where bronze specimens were slid (Figure 1). Both materials had ground surfaces. On the steel track, there were grooves of grinding in the direction of relative displacement, while those on the specimens were perpendicular thereto. The length of the sliding track was 700 mm and the nominal load of the specimens examined was 0.0125 MPa (10 N).
Specimens were managed to be slid down by setting the slope using a screwed spindle. The environment temperature was 21 °C and there was no considerable warming between the surfaces in the course of the tests. This can be explained by
the small number of cycles, low load, and low sliding speed. No lubrication was applied; the only layer of lubrication was produced by the atmosphere of the lab.
2.2. Measurement technique
Specimen microtopography was recorded at 2 different places using a Perthen Concept type stylus instrument. The size of the surface measured was 1x1 mm, with a sampling distance of 0.5 and 2 μm (2000x500 points), respectively. There was no use of higher resolution due to the 1 μm tip radius of the stylus needle and the error probability of lateral shift. An inaccuracy of the stylus instrument is that it ”flattens” real surfaces, therefore it provides a ”filtered” image. However, the characteristics of scanned surfaces can be quantified in the form of various parameters. Measurements were performed on identical surface section in each phase of the wear process, therefore the changes of a given surface section can be traced accurately, not only statistically, in the course of the wear process.
Surfaces were also recorded by a JEOL JSM 5310 type scanning electron microscope. Electron microscope recordings can present the smallest details of a surface, therefore certain phenomena can be explained and the “microscopic world” of surfaces can be explored.
2.3. Surface microtopography evaluation
One of the most frequently applied evaluation techniques is the use of statistical functions and parameters. It is obvious to use due to the statistical nature of surface topography data. Initially, only the scalar parameters known from mathematical statistics were used; by now, however, further parameters have been defined. Surfaces can be characterized by functions well-known from statistics:
the distribution function, showing the distribution of measurement points around the mean-plane and the density function, yielding the value of material partition at a given height level.
Additionally to the statistical parameters known from the literature, regular surfaces substituting asperities were used for processing the cluster of points yielded by measurements. A significant benefit of this processing technology is that well-defined mathematical functions need to be examined this way instead of processing a ”disordered” cluster of points. Obviously, this processing technology has an inherent modeling error, namely the kind of surface to replace asperities.
Paraboloid and pyramid surfaces proved to be the most suitable ones. They were used for defining the distribution of the direction angle of asperities, the height distribution of the peak points, the radius distribution of the peak curvatures and to determine slope angle distribution.
3. Results
3.1. Visual characterization of the wear process
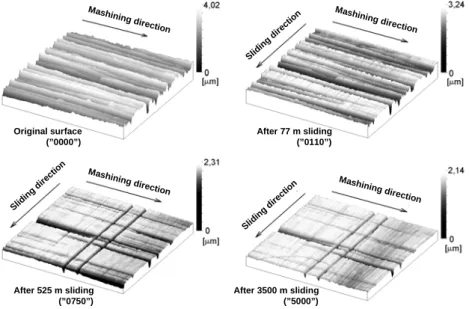
Figure 2 illustrates the changes of bronze sliding surfaces in various phases of the wear process. It can be observed that in the initial phase of the wear process (wear cycle 110) the higher asperities (crests) partly disappear, being somehow
”stumped”, and the asperities of the countering surface are ”finely” copied to this surface in accordance with the direction of relative movement.
Original surface (”0000”)
Mashining direction
Mashining direction
Mashining direction Mashining direction
Sliding direction Sliding direction
Sliding direction
After 77 m sliding (”0110”)
After 525 m sliding (”0750”)
After 3500 m sliding (”5000”)
Figure 2. Wear process of a bronze specimen
This copying is partial since not a perfect copy of the track surface is generated but only grooves formed by the highest crests and peaks, the size of which probably strongly depends on the load. This phenomenon can be interpreted as a deformation process, where ”deformation resistance” depends on the depth of the grooves and the material, while the deforming force is in proportion with the surface load. The new pattern on the surface is generated as a balance between these two quantities. In the next phase of the process (wear cycle 750), some deeper scratches appear on the surface in the direction of sliding. This may be explained by the fact that some particles separated from the bronze surface and embedded to the steel surface have left their grooves on the countering surface. In this phase of the wear process, minor bronze deposits became visible on the steel surface, and a small amount of wear particles were to be observed at the bottom of the slope. In the meantime, the size of the contour contact area reached the size of
the nominal contact area and the wear process considerably decreased. If these wear groves are compared to the wear grooves in the figure representing to wear cycle 110, it can be established that a finer pattern is generated in the later state.
This corresponds to the deformation theory outlined above as the deformation force mentioned there is constant in the course of the process, but ”deformation resistance” may only remain constant as the number of grooves increases if the depth thereof is reduced. At wear cycle 5000, only some very deep grooves remained from the original grinding: an almost completely new pattern was formed on the surface.
20μm Sliding direction 5μm
Figure 3. SEM recordings of the bronze surface after 5000 wear cycles
In order to further observe the wear process, SEM photos were also made of the surfaces to illustrate the final worn condition (Figure 3). The scratches in the direction of sliding can be properly observed on the ”new” surface mentioned above, with the original grooves of machining almost completely disappeared.
There is a rough scratch along the middle of the image, probably formed by a hard particle. The rest of the scratches, however, are really fine. It can also be observed that the material is smearing into the grooves. This considerable strain can be explained by a high contact pressure. Since the size of the real contact area took up only a small part of the nominal contact area, the real contact pressure was a much greater then the nominal contact pressure. It can be seen that the grooves of machining are partly covered with worn particles, and even deeper are formed in the course of the wear process. In the highly enlarged image, two small wear particles can be observed, deposited on the surface and almost entirely embedded.
”Having escaped” later on, they can give rise to new deep scratches.
3.2. Characterization of the wear process based on the characterization of asperities
The quantitative evaluation of experimental results was performed by characterization with distribution functions rather than by the traditionally applied parametric evaluation technique. The benefit thereof lies in its broader information content as surface characteristics are defined by their respective distribution functions rather than by an average scalar parameter.
3.2.1. The high distribution curve and the bearing area curve
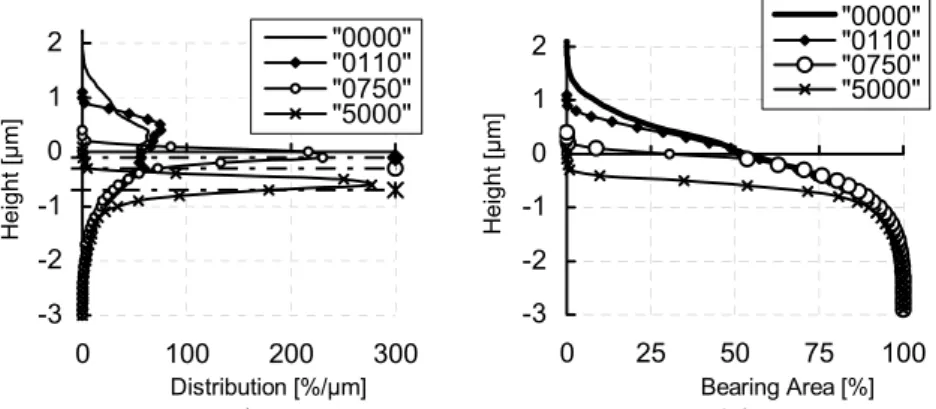
A number of functions and parameters can be used for characterizing surface topography [7]. Figure 4 shows the height distribution of the original and worn surface. In the course of the analysis of height distribution curves, the problem of adjustment arose, namely how to place the curves pertaining to particular wear phases into the same diagram to refer to actual changes.
It would be an error to perform adjustments according to mean-plane as the wear process brings about more dominant changes in the upper layers of the surface, in the proximity of asperities. The formation of observable plateaux entails a
”downward” displacement of mean-plane.
The most realistic option for adjustment seems to be adjustment according to the lowermost point. However, lowermost points cannot be considered to be constant, either. This is explained by the following reasons:
In the course of the wear process, new deep grooves may be formed, the depth of which may exceed the depth of the lowermost point of the original (or previous) surface. Therefore lowermost points go lower.
Major plastic deformations frequently occur in the course of the wear process. This may mean that the asperities wearing off are not removed in the form of wear particles but they are ”smeared” into the valleys, or the valleys themselves are filled up by wear particles; thereby considerably affecting the lower part of the height distribution curve.
Opportunities provided by visual display (particularly SEM), answering questions on the nature of the wear process, may offer guidelines in clarifying the problem.
In our investigations, we came to the conclusion that the depth of new scratches does not exceed the depth of the original pattern, and ”smearing” into the valleys is not of such degree that it would exert a dominant influence on results, therefore adjustment according to the lowermost point can be accepted.
-3 -2 -1 0 1 2
0 100 200 300
"0000"
"0110"
"0750"
"5000"
Distribution [%/μm]
)
Height [μm]
-3 -2 -1 0 1 2
0 25 50 75 100
"0000"
"0110"
"0750"
"5000"
Bearing Area [%]
b )
Height [μm]
Figure 4. The height distribution curves (a) and the bearing area curves (b) fitted by the lowermost points
In the course of adjustment, an increasing adjustment displacement was necessary as the wear process progressed. Compared to the mean-plane of the original surface, the mean-plane was displaced by 0.1, 0.3, and 0.7 μm at wear cycles 110, 750, and 5000, respectively, assuming that the lowermost point of the curves was physically the same point. The mean-planes pertaining to each distribution function are indicated in Figure 4.
It can be established that peaks go lower as the wear process progresses, with the highest peaks wearing away. In the course of the process, the height distribution curve becomes ever more “acute” and asymmetrical. This means that measurement points are agglomerated at a given height level, where there are many surface points, therefore the ”plateaux” observed earlier are formed. The fact that the asymmetry of the curve is also increased indicates that primarily the
”upper” layers were changed in the course of the formation of the new surface, with asperities disappearing from there and replaced by a new pattern consisting of lower peaks. At the end of the wear process studied the new surface is almost entirely below the mean of the initial surface. This obviously results in a refinement of the surface as well as in the fact that a considerable part of the original pattern completely disappears, therefore the surface is not only transformed but an entirely new microtopography is generated.
In Figure 4b the bearing area curve was also fitted by the lowest point. It can be observed that the curve not only moves down, but the gradient of it becomes smaller. That is why the load bearing ability of the formed plateaux-like surfaces is better.
3.2.2. Asperity analysis
A number of methods have spread for defining and examining asperities (8-point method [8], contour mapping [9, 10], etc.), indicating that the experts involved in this subject have not yet found an advisable method which would be generally applicable and acceptable. In the present case, our attention is directed to wear processes; this is the reason why investigations are focused on the characterization of asperities. As regards wear processes in the event of dry friction, dominant changes from the viewpoint of surface quality occur in the proximity of asperities.
-1 -0,5 0 0,5 1 1,5 2
0 100 200 300
"0000"
"0110"
"0750"
"5000"
Distribution [%/μm] a.)
Height [μm]
-1 -0,5 0 0,5 1 1,5 2
0 100 200 300
"0000"
"0110"
"0750"
"5000"
Distribution [%/μm]
Height [μm]
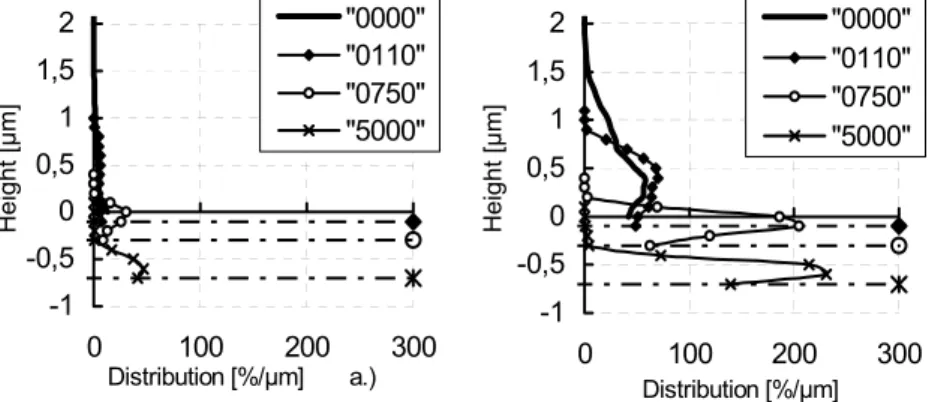
Figure 5. Height distribution of a.) smaller asperities (area less than 40 μm2) b.) larger asperities (area greater than 40 μm2)
Studying the measured microtopography, a new procedure was applied instead of filtering in the traditional sense. Essentially, the ”filtering” process is based on the principle that only asperities larger than a certain size have a significant impact on the wear process. Results are distorted by minor peaks on the surface of these asperities. Therefore asperities with a smaller area than the one specified were jointed by the algorithm into dominant asperities and evaluation was performed using those. Thus, each “elevation” located over the mean-plane, with a local maximum and an area exceeding a certain size was defined as an asperity. Figure 5 shows that the significance of asperities with an area lower than 10 cells (40 μm2) is negligible: they do not have a dominant impact on the microtopography, particularly in the initial phases of the wear process. By studying the height distribution curve, it can also be established that the consideration of peaks smaller than 10 cell sizes may yield to false results because their number is comparable to the number of major peaks, while their area is much smaller.
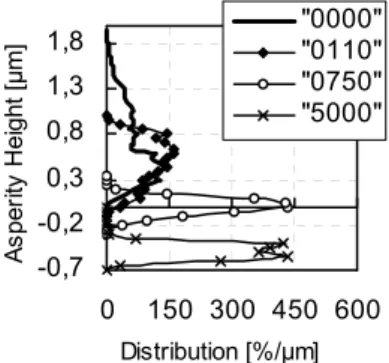
Figure 6 shows distribution of peak points of asperities. The peak point of asperities are continuously reduced as the wear process progresses, and the ”even”
distribution, characteristic of the initial phase, is eliminated. It can also be observed that upper peaks disappear and many new peaks are formed at a lower
level. Also taking into consideration the adjustment by height of the curves, it can be established that the asperities of the worn surface generated have been lowered below the mean-plane of the original surface. Therefore the asperities originally defined have completely disappeared, with a new surface formed in their place which can be characterized by different asperities. As the topmost point of asperities does not only go lower but is approaching to the mean-plane, this also indicates that asperities themselves have got lower.
-0,7 -0,2 0,3 0,8 1,3 1,8
0 150 300 450 600
"0000"
"0110"
"0750"
"5000"
Distribution [%/μm]
Asperity Height [μm]
Figure 6. Distribution of peak points of asperities fitted by the lowermost point The distribution curve in Figure 7 describes the direction of the major axis of the paraboloids substituting asperities. In the initial state, the curve reflects anisotropy characterizing ground surfaces. As the wear process is started (as a result of transversal sliding), this orientation discontinues. Although some orientation is shown in the direction of sliding as the process progresses, but this cannot be taken as dominant. The curves rather refer to a non-oriented isotropic surface.
0 30 60 90 120 150 180
0 1 2 3
"0000"
"0110"
"0750"
"5000"
Distribution [%/°]
Angle [°]
Figure 7. Asperity orientation distribution curve
It can also be observed that while considerable discrepancies were experienced in
wear cycles 750 and 5000, respectively, are almost completely identical in the case of orientational distribution curves, therefore the direction of asperities – the new surface – is formed earlier on.
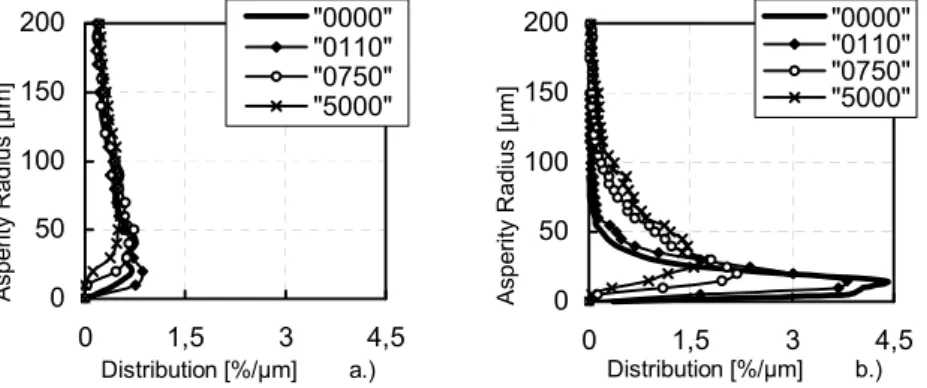
Figure 8 shows the peak curvature radius of the substitute paraboloids to be defined according to major and minor axes. It can be observed that the radius of the peak curvatures pertaining to the major axis does not change considerably as the wear process progresses. On the other hand, the peak curvature radius of the minor axis increases in the course of the wear process. The shape of asperities changes. This is in relation with the fact that the original peaks caused by grinding are replaced by ”smeared” peaks.
0 50 100 150 200
0 1,5 3 4,5
"0000"
"0110"
"0750"
"5000"
Distribution [%/μm] a.)
Asperity Radius [μm]
0 50 100 150 200
0 1,5 3 4,5
"0000"
"0110"
"0750"
"5000"
Distribution [%/μm] b.)
Asperity Radius [μm]
Figure 8. Radius distribution curve of the major (a.) and minor (b.) peak curvatures of the paraboloids substituting asperities
Initial asperities – with well-defined orientation and elongated in the direction of orientation – are replaced by less elongated asperities with larger radii. Larger radius represents better contact conditions. Therefore, in the course of operation, the surface changes in a way that the new surface formed will have more favorable contact conditions.
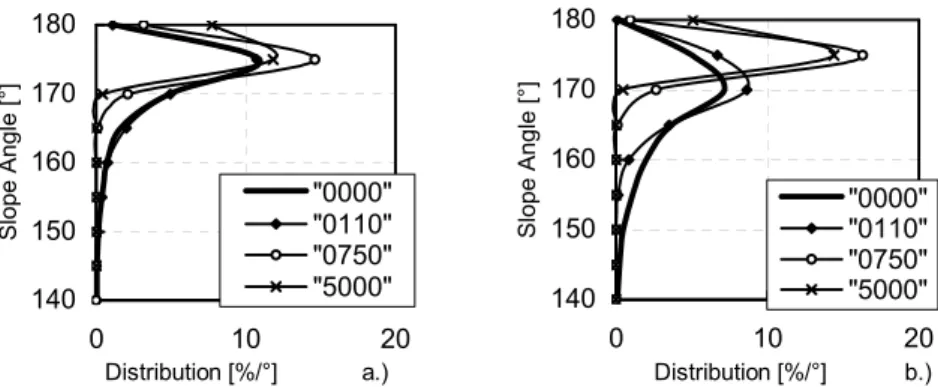
When examining slope angles (Figure 9) using pyramid substitution, two arrays of curves can be produced, which characterize the longitudinal and transversal directions peak by peak. It can be observed that the slope angle is always an obtuse angle. In displaying the microtopography the scale in height direction is usually greater than the one defined in the other two directions, however, it is misleading as regards the slope angle as this latter is considerably distorted. This fact may cause mistakes in the interpretation and explanation of wear processes.
140 150 160 170 180
0 10 20
"0000"
"0110"
"0750"
"5000"
Distribution [%/°] a.)
Slope Angle [°]
140 150 160 170 180
0 10 20
"0000"
"0110"
"0750"
"5000"
Distribution [%/°] b.)
Slope Angle [°]
Figure 9. Slope angles pertaining to the major (a.) and minor (b.) axes
This set of curves is similar to the previous one characterizing the radius of the peak curvatures in that the curves indicate increased obtuseness and stumpiness of peaks here as well.
Conclusions, experiences
As a result of wear tests, the surface microtopography undergoes two fundamental changes. One of them is the increasingly disappearance of the original pattern, simultaneously with the formation of a new surface texture.
Formation of the new pattern is considerably influenced by the direction of sliding, “deposits” developing on the surface, and wear particles between the surfaces.
The technique using distribution curves developed for characterizing asperities is suitable for studying the wear behavior of surfaces in the course of dry friction as well as for tracing surface changes.
In the wear experiments presented, an originally anisotropic surface was converted into an isotropic surface. By adjusting distribution curves, it was made possible to establish that initially existing asperities disappeared almost completely and were replaced by a new pattern.
In the course of the wear process, the surface changed in a way that contact and load bearing characteristics improved, with their slope radius increasing, their peak angle becoming more obtuse; therefore the surface change developed in the direction of reducing the effects generating such surface change.
Acknowledgements
The present study was supported by OTKA T 043151 research program.
References
[1] Palásti K. B., Czifra Á., Kovács K.: Microtopography of machined surfaces, tribological aspects of surface and operation, DMC 2002, Kassa 2002.
50-57
[2] D.J Whitehouse: Handbook of surface metrology, Inside of Phisics Publ., Bristol (1994), 988
[3] Hirst W., Hollander A. E.: Surface finish and damage in sliding, Proc. R.
Soc. A 337 379-94 (1974)
[4] H. H. Gatzen, M. Beck: Wear of single silicon as a function of surface roughness, Wear 254 (2003), 907-910.
[5] S. Akkurt: On the effect of surface roughness on wear of acetal-metal gear pairs, Wear 184 (1995), 107-109.
[6] Y. A.-H. Mashal: The role of fracture mechanics parameters in glass/ceramic wear, Engineering Fracture Mechanics, Vol.52. No.1. (1995), 43-50.
[7] Kovács K. - Palásti Kovács B., Műszaki felületek mikro-topográfiájának jellemzése háromdimenziós paraméterekkel. I. A háromdimenziós topográfiai paraméterek áttekintése, Gépgyártástechnológia, 1999/8. 19-24.
[8] K. J. Stout, P. J. Sullivan, W. P. Dong, E. Mainsah, N. Luo, T. Mathia, H.
Zahouani: The development of methods for the characterisation of roughness in three dimension, University of Birmingham Edgbaston, Birmingham (1993), 358 [9] K. Yanagi, S. Hara, T. Endoh: Summit identification of anisotropic surface texture and directionally assessment based on asperity tip geometry, International Journal of Machine Tools & Manufacture 41 (2001), 1863-1871.
[10] Z. Néder, K. Váradi, K. Friedrich: Characterisation of real polymer composite-steel surfaces by asperity-analysis and –substitution, ASME/STLE International Tribology Conference, Cancum, Mexico oct. 27-30, 2002