UNIVERSITY OF WEST HUNGARY
FACULTY OF AGRICULTURAL AND FOOD SCIENCES Mosonmagyaróvár
INSTITUTE OF BIOSYSTEMS ENGINEERING Applied PhD School for “Precision Crop Production Methods”
Chairman of the PhD School: Dr. Neményi Miklós director of institute, university professor, Doctor of Hungarian Academy of Sciences
Sub-program: Technical backgrounds of site-specific precision plant production
Sub-program leader: Dr. Neményi Miklós university professor
Advisor of the dissertation:
Dr. Kacz Károly university professor
DOCTORAL (PhD) THESIS
THE PRECISION AGRICULTURE AIDED BY REMOTELY SENSED DATA
Gyulai István
Mosonmagyaróvár 2009.
1. Introduction
The method of Remote Sensing predominates in various areas: from the medical sciences to meteorology through mechanical engineering applications. In a narrow sense, the author considers the aerial photographs and satellite images as remotely sensed data, which the content of the map can be updated with from time to time.
The main objectives of the dissertation:
1. Selection of a uniform geometrical system where map, GNSS positioning, satellite image, aerial photo and agricultural technics could be managed.
2. Testing the accuracy of satellite positioning (ACT and DGPS max.
receivers) on the field.
3. Demonstrability of in-field variability with space images.
Classification and segregation.
4. Analyzing the connection between artifical fertilizer programme and satellite images, optional interconversion between them.
5. Utilization of aerial photos.
2. Materials and method
GNSS (Global Navigation Satellite System) measures
The author carries out accuracy tests of ACT and CSI Wireless DGPS Max satellite positioning systems.
Figure 1: The two instruments (left), On the field (right)
The investigation of positioning modules was carried out on the experimental field of the University of West Hungary in Mosonmagyaróvár.
Figure 2: The site of GNSS measures
The points are marked with stones and pegs in the middle and at the corner of the field, as well as farther on. The distance between the nearest points is 350 metres, and between the farthest points it is 1900 metres.
The ACT instrument was set to receive the EGNOS satellite signals.
Display: latitude ϕ, longitude λ, the number of satellites, HDOP. The DGPS max intsrument is suitable for the reception of GPS satellite signals and OmniSTAR differential correction signals. Accuracy: ϕ latitude and λ longitude display 5 characters after decimal point, in degree (°). It means about 1.1 metre accuracy.
Examination period: 30 August 2004 – 3 September, and 3 December.
Satellite images
The author investigates other ways in the utilization of space images made through NÖVMON crop monitoring. Are they appropriate to gain information about in-field variability? Can it help precision agriculture?
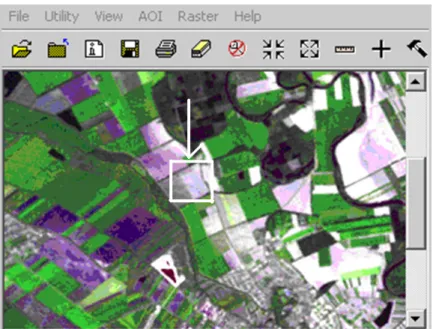
Figure 3: The experimental field and its surroundings. Copyright ESA 2001, published by EURIMAGE, FÖMI archives data, Copyright FÖMI (Institute of Geodesy, Cartography and Remote Sensing) 2001
The area of the field is 15.3 hectares (ha). Pioneer experiments about site-specific nutrient replenishment are in process at the Institute of Biosystems Engineering under the control of Professor Miklos Nemenyi and Karoly Kacz. The thesis is assisted by the dissertation of Peter Akos Mesterhazi. The dissertation concludes the experiments carried out in 2001, 2002, 2003. In November 2001 a soil sampling was taken on the experimental field, and by reason of later nutrient replenishment 63 management units were established.
Table 1: Management units and fertilizer portions (N, K2O, P2O5
[kg/ha]), extract
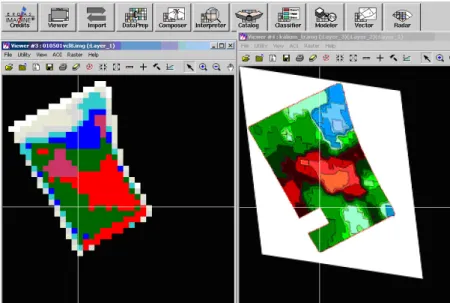
The heterogeneity of the field does not appear on space images, however, if pixel rates are classified into groups, separate spots are visible which can have connection with field heterogeneity and the distribution of fertilizer portions. Classification was prepared by ERDAS image processing programme. According to the experience gained through classification, categories 4-6-8 are preferable for a field, different pixel groups could be highlighted.
Figure 4: Correlation search visually between satellite image (on the left) and fertilizer plan (on the right)
Interconversion
Is there a connection between separate spots on space images and fertilizer programme spots? How much do nutrient replenishment data and space image data complement each other? It can be interpreted that the two tables are each a surface and what distance there is between these surfaces and how they join. The calculation is described with the following formula: g(x) ≅ A f(x) + B
Search for A and B value where in xi pixel points the g(xi) ≅ A f(xi) + B appromixation is the best! The task is to solve with least square method, that is the variation of deviation to be minimum.
Error:= error (A,B)=
∑
(gi −(Afi +B))2 Equations for the minimum extreme value:0 ) )
( ) ((
2 2 + − =
∂ =
∂
∑
fi A∑
fi B∑
figiA error
0 ) )
((
2 + − =
∂ =
∂
∑
fi A nB∑
giB error
Calculation of A and B
∑ ∑
∑ ∑
∑
−
= 2− 2
) ( ) (
) )(
( ) (
i i
i i
i i
f f
n
g f
g f
A n f A
g n
B n1 i 1( i)
∑
∑
−=
The author carried out tests not only in fertilizer programmes but also certain soil data.
Evaluation of orthophotos
It is expected with the completion and maintenance of Land Parcel Identification System, LPIS-HU that orthophotos will be taken with 3- year update period. These can be used – consider in-field variability examination – for what it was originally intended: identifying land parcels and separating bearing surface. On one hand it could be used for interpretation purposes with analytic methods, on the other hand for planning, obtaining geometrical data, with 0.5 metre accuracy, in EOV (Uniform Land Projection – Hungary) system.
3. Results
GNSS measures
Table 2: ACT results
point numb er
Numb.
Of meas.
φ average of latitudes φ
RMS error
λ average of
longitudes
λ RMS error 1 6 47,906953 ±0,000010 17,248208 ±0,000008 2 4 47,902295 ±0,000006 17,252255 ±0,000203 3 6 47,903835 ±0,000026 17,256448 ±0,000077 4 6 47,908958 ±0,000013 17,253512 ±0,000008 5 6 47,892225 ±0,000011 17,258892 ±0,000079
aver. ±0,000013 ±0,000075
metre ±1,43 m ±5,60 m
In general direction the deviation: ± 5.8 metres.
The average should be treated with reservation because a serious error (beyond measure accuracy) occurs in it, and it must be ignored when
processing. Errors occurred during the experiment are interesting therefore remained.
Table 3: DGPS max measurements
point
number Numb.
Of meas.
Φ average of latitudes φ
RMS error λ average of longitudes
λ
RMS error 1 6 47,906943 0,000008 17,248207 0,000008 2 4 47,902298 0,000017 17,252358 0,000009 3 6 47,903803 0,000020 17,256500 0,000009 4 6 47,908952 0,000008 17,253520 0,000010 5 6 47,892213 0,000008 17,258935 0,000024
Aver. 0,000012 0,000012
metre ±1,3 m ±0,9 m
In general direction the average deviation: ± 1.6 metres.
During measurements the DGPS max was in a position capable of receiving differential signals.
The author calculated the average of geographical coordinates in EOV system and compared them to the EOV coordinates of points.
Table 4: Deviation of EOV coordinates Point ACT land survey
system
DGPS MAX land survey system
1 1,9 0,96
2 7,9 2,1
3 5,7 0,6
4 2,8 1,5
5 4,7 0,8
Average 4,65 1,21
It can be stated that the accuracy of static positioning on the field with 1.1 meter accuracy receivers declined, moreover measurement occurred as well which could not be evaluated.
Satellite images
The author gathered satellite images and management units into a single system. Pixel size: 50x50 metres. The management units were collected in tables, and the pixel values of satellite image bands were exported, tabuleted. The tables were converted into Excel programme.
Figure 5: Original and comparable management units
Figure 6: Satellite image and fourth band prepared for export. The value of black background pixels: 0.
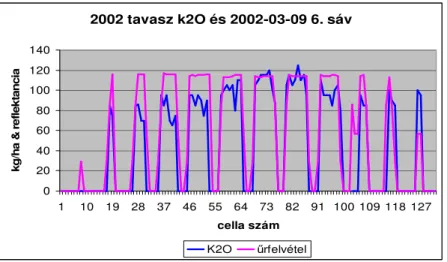
2002 tavasz k2O és 2002-03-09 6. sáv
0 20 40 60 80 100 120 140
1 10 19 28 37 46 55 64 73 82 91 100 109 118 127 cella szám
kg/ha & reflektancia
K2O őrfelvétel
Figure 7: Potassium fertilizer and satellite image dated 09.03.2002. No.
6. band synchronism. Correlation: 0.8945.
Correlations between satellite image bands and suggested portion for 2002 spring K2O fertilizer:
Band 1 0,8956 Band 2 0,8998 Band 3 0,9027 Band 4 0,8974 Band 5 0,9028 Band 6 0,8945 Band 7 0,9082
Correlation average: 0,9001, standard deviation: 0,0048 < 1 %
The correlations around 0.9 show that the data structure is right, data are kept together, zero pixel values and non-zero pixel values are arranged.
These raise more investigation: is there a connection between fertilizer programme and satellite images? Probably one data can be calculated from the other?
Mathematical testing, interconversion: error= ∑(gi-(A*fi +B))2 Result:
09.03.2009 satellite image band 6 versus K2O A=1,0069 joining near one, B= 7,9102
Error= 82375 → average deviation= 25 N is calculated:
09.03.2009 satellite image band 6 and Nitrogen portion A=0,8298 joining near one,
B= -1,6579 distance between them Error= 96826 → average deviation= 27
The error significantly exceeds table values (between 20-120), the average deviation is 44-48 %, thus the interconversion is not possible, relation could not be defined between satellite image and fertilizer portions.
Synchronism testing
Is the site-specific interference reflected on satellite images?
2002.03.09. dátumú őrfelvétel + K + N
0 20 40 60 80 100 120 140 160
1 12 23 34 45 56 67 78 89 100 111 122
cellák
pixel érték & kg/ha
Káli Nitro 1 sáv 2 sáv 3 sáv 4 sáv 5 sáv 6 sáv 7 sáv
Figure 8: Position before first management, synchronism of 09.03.2002.
datum sat. image bands versus Potassium, Nitrogen
2002.10.17. d. őrfelvétel + Kálium, Foszfor
0 20 40 60 80 100 120
1 12 23 34 45 56 67 78 89 100 111 122 cellák
pixel érték &kg/ha 1 sáv
2 sáv 3 sáv 4 sáv 5 sáv 6 sáv 7 sáv Káli Foszf
Figure 9: Comparing position after 2002 spring management, 17.10.2002. datum sat image to 2002 autumn management vs Potassium
and Phosphorus portions
It can be defined from Figure 8 that
- N portion is nearest to band 6 (thermal infra)
- the highest reflection comes from band 6, the weakest from band 2, the others are in the middle
- reflection on most parts of the field is balanced
- Potassium curve does not join band 6 so much as Nitrogen
In Figure 9 reflection curves are balanced but differ from fertilizer portions.
Management is not clear significantly from synchronism testing.
Investigation of soil test
From the 17 types of soil sampling (which was the basic data of fertilizer programme) the Arany-fixity and Potassium content were examined.
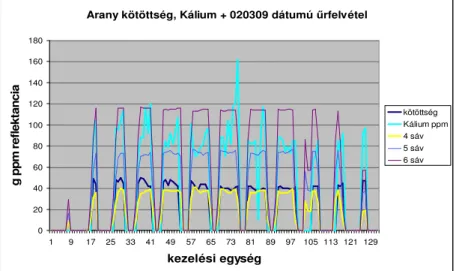
Arany kötöttség, Kálium + 020309 dátumú őrfelvétel
0 20 40 60 80 100 120 140 160 180
1 9 17 25 33 41 49 57 65 73 81 89 97 105 113 121 129
kezelési egység
g ppm reflektancia
kötöttség Kálium ppm 4 sáv 5 sáv 6 sáv
Figure 10: Satellite image dated 09.03.2002 bands 4, 5, 6, synchronism of Arany-fixity and K2O5 ppm
Band 4 and Arany-fixity are close enough, however, not so close as seen from Nitrogen portion and band 6 of the same satellite image, which had interconversion test as well. According to previous experience, neither in this case can interconversion be expected.
Classification
After spontaneous classification the author interpeted satellite images made on 4 variouss dates, searching for the answer whether soil changing
tendency could be detected. Time scale and number of class scale analysis were completed by the author.
Sequence of dates:
1. 1 May 2001: uncovered field after corn (maize) seeding
2. 9 March 2002: uncovered field after corn harvest and taking soil sampling
3. 17 October 2002: uncovered field after spring fertilizer programme, before autumn programme, after corn harvest
4. 12 November 2002: after spring and autumn programme
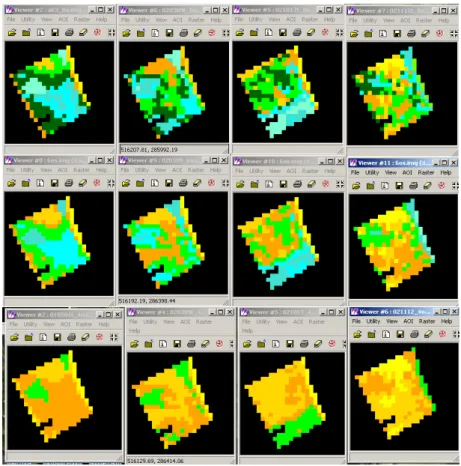
Figure 11: Classified satellite image, category 8, 6, 4 top-down On the edge of the field different pixel value sites are found but in time the field becomes more homogeneous.
The 8 category arrangement (above) shows that the first is inhomogeneous in biggest spots, then it gradually becomes mosaic. The
southeastern band of the field is remarkable, it indicates separate homogeneity on every image.
The second and third line shows the 6 and 4 category arrangement. The bigger sharp spots before the fertilizer programme (first two pictures) are apparent, the two after the programme become mosaic, rearranged.
To sum up: with interpretation progressing from multi-category (8) to fewer category (6-4) the sharp big inhomogeneity spot is determined for date 1. The table becoming more homogeneous in time is not excluded.
Aerial photos
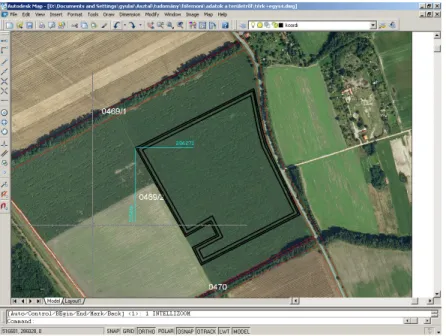
The image made in 2000 helped in field setting. Satellite image was cut so that the biggest area would remain, and the disturbing edge pixels should not be involved in the cutting. However, they were contained in some parts, as it can be seen from classification. On the 30-metre resolution satellite image the bushes and roads do not appear, while on the aerial photo these are detached. After the author separated them with a cutting frame, obtaining the coordinates of the frame and on this basis designed the field cutting with a software.
Figure 12: Cutting frame design
4. New scientific results (theses)
1. The fertilizer portion (kg/ha) for the agricultural field and the space image pixel value could be formed into a single system. Therefore their connection is to be examined with mathematical and interpretation method.
2. The uniform data structure according to 1. is right: it shows correlation near 0.9.
3. Connection 1. examined with the least square method is not an interconversion. Connection investigated with synchronism has no numerical information content.
4. Classification at 4-8 class level method on interpretation level is suitable for the time scale analysis of field inhomogeneity changing.
5. Conclusion
The dissertation deals with an area of the research work at Mosonmagyaróvár Faculty of the University of West Hungary which is in process for some years.
Supported by soil data taken in November 2001, MTA TAKI (Research Institute for Soil Science and Agricultural Chemistry of the Hungarian Academy of Sciences, RISSAC) completed a fertilizer programme which was fulfilled in spring-autumn 2002 and 2003. The author took part in the realization of the programme with Peter Akos Mesterhazi and professors controlling the work.
The objectives and their realization are summarized in the following:
1. Selection of a uniform geometrical system where map, GNSS positioning, space image, aerial photo and agricultural technics could be managed.
The map of the Land Register Office, the satellite images received from FÖMI and the aerophotos purchased from FÖMI were given in EOV system. The author inserted management units and counted GNSS measurements into EOV, in this way the unionisation succeeded.
2. Testing the accuracy of satellite positioning (ACT and DGPS max.
receivers) on the field
ACT and RDS max DGPS measurements taken on the field indicated that 1.6 meter accuracy could be achieved with 1.1 meter point display
instruments, but measurements occurred as well which could not be evaluated.
3. Demonstrability of in-field variability with space images.
Classification and segregation.
First it is practical to cut the field from its surroundings. On 15 hectares field level the cutting and 4-6-8 classification had visible results, it could be interpreted with the map visualisation of site-specific fertilizer programme.
4. Analyzing the connection between artifical fertilizer programme and space images, optional interconversion between them.
The author managed the fertilizer programme, soil data and space images in chart form. Interconversion of fertilizer portion and space images was examined with least square method. Coclusion: the interconversion could not be used with practical accuracy. The experience was the same with soil data taken in November 2001.
5. Utilization of aerial photos
The orthophoto was found suitable for numerical accuracy and interpretation and can be used for analysis. It also proved perfectly suitable for 0.5 meter accuracy definition of coordinates, editing, e.g.
table cutting design.
6. Publications in connection with the dissertation
Lectures, conference issues
Neményi M. - Mesterházi P. Á. - Gyulai I. (2001): A kemikáliák helyspecifikus kijuttatásának mőszaki feltételrendszere az
agrárgazdaságban, Gyır, Széchenyi István Fıiskola, Tudományos Napok Gyulai I. - Neményi M. - Kacz K. - Mestererházi P.Á. (2002): GIS alkalmazások, XXIX. Óvári Tudományos Napok, elıadás és CD kiadv.
Gyulai I. (1997): GIS studies for environmental engineers, elıadás PROCEED program keretében, Gyır-Deventer, kézirat
Gyulai I. (2000): Környezetelemzés távérzékeléssel, elıadás, kiadvány, a Magyar Tudomány Napja, Környezettudományi tanácskozás, Gyır, Széchenyi István Fıiskola
Gyulai I. (2008): Távérzékelés: a fenntartható erıforrás eszköze, VI.
Környezet tudományi Tanácskozás, Széchenyi István Egyetem, Gyır, 2008. nov. 7.
Gyulai I. - Zajovics Gy. (2002): Szennyezıforrások felderítése, nyilvántartása, Környezettudományi Tanácskozás, Széchenyi István Egyetem, Gyır
Gyulai I. (2008): Precíziós kitőzések, MTESZ elıadás, Gyır, 2008.
október 28., kézirat
Gyulai I. (1981): A geodézia új irányai, digitális térkép, MTESZ elıadás, Gyır, kézirat
Periodical
Gyulai István - Horváth Richárd - Dr. Oláh Ferenc (2005): Elektronikus térkép, információ a városi közlekedésben, Városi Közlekedés folyóirat, 2005/1
Lectured notes
Gyulai I. - Bulla M. (2002): Távérzékelés, egyetemi jegyzet, SZIF- Universitas Kft.
Bulla M. - Domokos E. - Gyulai I. - Harkányiné Székely Zs. - Konrád R.
- Kovács B. - Kovács E. - Lénárt L. - Madarász T. - Mucsi L. - Németh N. - Szabó I. - Szőcs P. - Tóth A. - Winkler G. (2007): Környezeti informatika, HEFOP elektronikus jegyzet, Veszprém
Bulla M. - Gyulai I. - Ónodi G. - Payer J. - Radnainé Gy. Zs - Pestiné Rácz Éva - Rédey Á. - Zseni Anikó (2007): Környezetállapot-értékelés, monitorozás, Magyarország környezeti állapota, HEFOP elektronikus jegyzet, Veszprém
Alexay Z. - Bulla M. - Buruzs A. - Gyulai I. - Nagy G. - Koren E. - Papp Z. - Szalay D. - Szalay Z. - Tóth P. - Zseni A. - Pestiné Rácz Éva (2006): Környezetvédelem, elektronikus jegyzet, Humánerıforrás- fejlesztési Operatív Program, (HEFOP), Veszprém