The purpose of this paper is to provide a non-technical interpretation of the "Great Divergence" and. The roots of China's impressive long-term performance lie in the remarkable continuity of the Chinese civilization – the oldest in the world – which managed to preserve its uniqueness and traditions without major interruptions. Among the many puzzles in economic history, the most important and intriguing is the "Great Divergence," the gap between Western and developing countries that began to appear in the sixteenth century and widened until at least the mid-twentieth century.
The purpose of this paper is to provide a non-technical interpretation of the "Great Divergence" and. Turchin (2005) presents a model of the rise and fall of empires based on expansion (and overexpansion) of the elite population. In an important article (Acemoglu, Johnson, and Robinson, 2001) entitled "Colonial Origins of Comparative Development," the authors used an astute indicator as an instrument for the institutional variable—the death rate among settlers in the colonies of large European States in the Nineteenth Century.
An opposing view is advocated by Rodrik, Subramanian, and Trebbi (2002) in an article with the self-explanatory title "Institutions Rule." The authors examine the impact of three basic factors on growth - geography (closeness to the equator and regional dummies), trade openness (the share of trade in GDP) and institutions. Which accounts for the varying quality of institutions in this non-colonized part of the world. Another interpretation of the emergence of institutions in colonized and non-colonized countries is the continuity perspective.
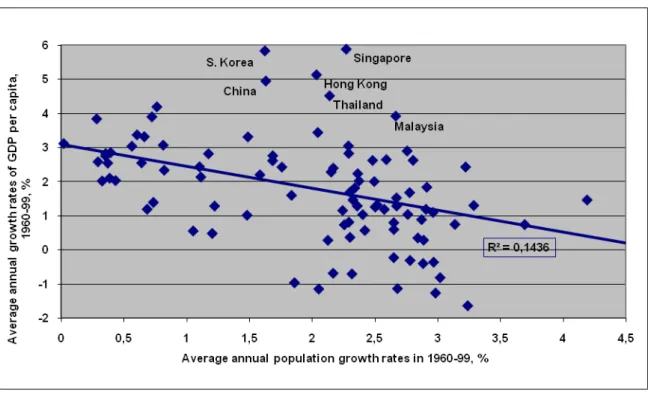
Success in technical progress led to population growth (as in China before the Opium Wars), not per capita income growth.
Equilibrium in the Solow model with fixed growth rates of the population
Malthusian trap in the Solow model (with changing population growth rates)
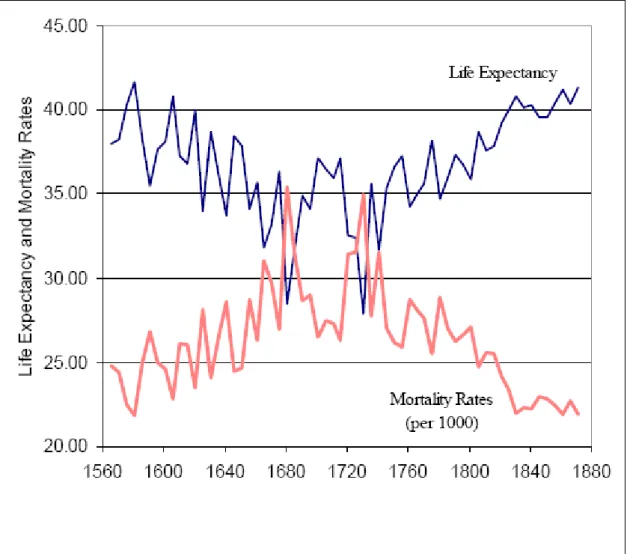
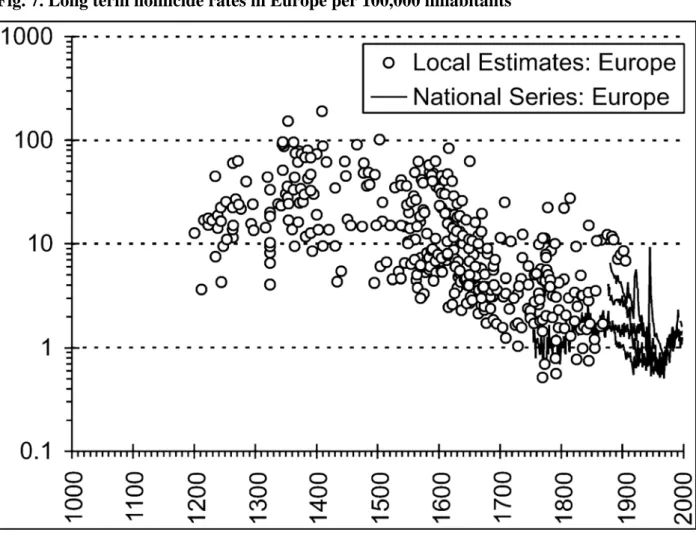
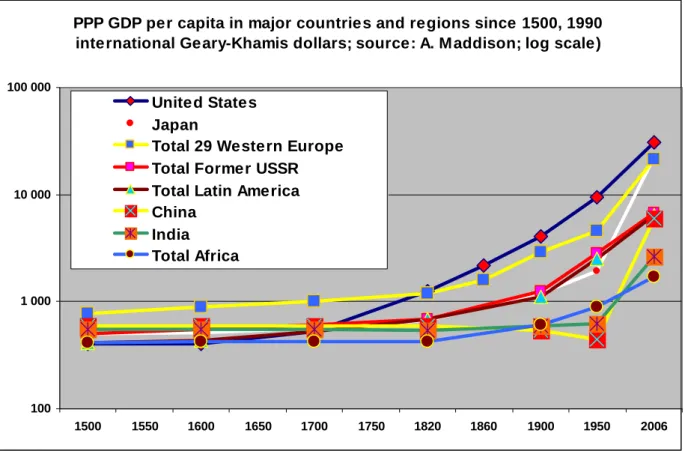
There was also an inverse relationship—the dynamics of GDP per capita affecting population growth rates—in the Malthusian growth regime, before the demographic transition that occurred with the Industrial Revolution. 8 GDP per capita in the UK increased in constant 1990 Geary-Khamis international dollars from $714 to $1,500. Even in the seventeenth century, the homicide rate in Western Europe generally exceeded 10 per 100,000 inhabitants—higher than in many developing countries with a similar level of GDP per capita today.
Moreover, it was imposed on some of the developing countries in the nineteenth to twentieth centuries, during the era of colonialism. In the more developed LA countries, growth rates in the twentieth century failed to narrow the gap with the West (Argentina, a developed country between the two world wars, even dropped out of the club after World War II). Formally, China was an uncolonized country, although after losing the Opium Wars in the mid-nineteenth century, it remained a semi-colony of the West for almost a century.
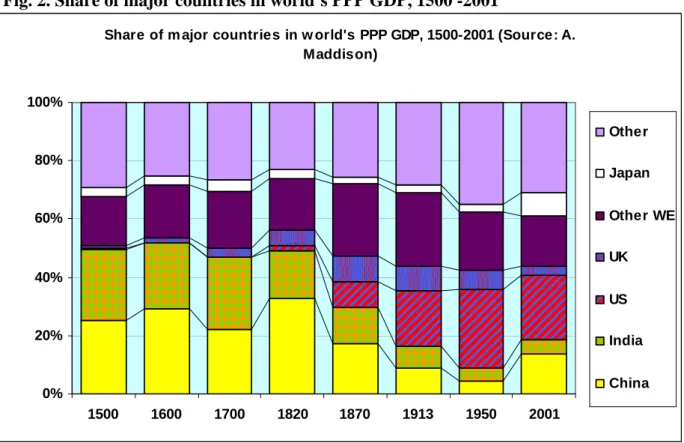
China's share of the total world population rose from a long-term average of 22-26 percent to 37 percent in the eighteenth century (Figure 11)—a truly remarkable achievement by the standards of the pre-industrial world. At the beginning of the nineteenth century, although productivity was already half that of the West, China still accounted for more than a third of the population and about a third of GDP and industrial output. The problem, however, was that the rules of the game in the global economy had changed: the rate of productivity growth in the West had increased and the Malthusian growth regime had ended.
China experienced a humiliating defeat in the Opium Wars (1840-42 and 1856-60) and had to accept globalization on Western terms. Chinese GDP per population declined from about half the American level in the early nineteenth century to a paltry 5 percent in 1950 (Fig. 13); the ratio of Chinese GDP to that of Western Europe fell from 2:1 to 1:5 during the same period (Fig. 14). The highest growth rates of labor productivity in the Soviet Union were not observed in the 1930s (3 percent annually), but in the 1950s (6 percent).
After the massive investment in the USSR of the 1930s (the "Great Push"), peak productivity was achieved after a period equal to the life of the capital stock (about twenty years) before a need arose for massive investment in replacing retired stock. This is one of the reasons to believe that the transition to a market economy in the Soviet Union would have been more successful if it had started in the 1960s. The conditions for the Chinese success of the last thirty years were mostly created in the preceding period 1949-76.
During the same period, during "by far the greatest experiment in mass education in the history of the world" (UNESCO-sponsored 1984 report), literacy in China rose from 28 percent in 1949 to 65 percent in the late 1970s ( 41 percent in India). 17 To a lesser extent, this applies to India: market reforms in the 1990s produced good results because they were based on earlier results from the import substitution period (Nayyar, 2006). Most scholars would probably agree that the great leap forward that caused the greatest damage could have been avoided in the sense that it did not follow logically from the inherent features of the Chinese socialist model.
This was still below Russia's numbers (fifty-three in 2007 and eighty-seven in 2008), but if the trend continues, China may be emulating Russia in the "state privatization" pattern.