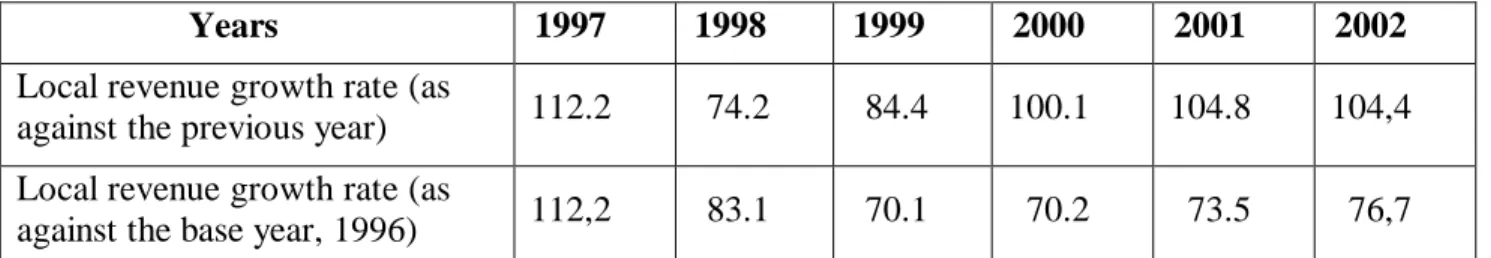
Embraced by the state (either intentionally or unintentionally), local self-government lost its appeal in the eyes of the general public, and the question now is: has the appeal of local self-government disappeared for good, or is there still any chance of its revival. The second blow – perhaps, more important for practice than the first – is the continuous reduction of the share of local budgets in the total budget of the country. Of course, such a reduction can be justified (at least partially) by the reduction of the notorious mandates, i.e.
In short, there is a certain optimal volume of local powers, the reduction of which seems like an attempt at the very essence of the institution of local self-government.
DECENTRALIZATION OF THE BUDGET SYSTEM AND FISCAL AUTONOMY OF
- PHASING IN OF REFORMS
- FISCAL DECENTRALIZATION AND AUTONOMY CONCEPT
- GENERAL PRINCIPLES OF DELINEATION OF SPENDING RESPONSIBILITIES
- ECONOMIC AND TECHNICAL FACTORS OF ASSIGNING TAXES TO THE LOCAL
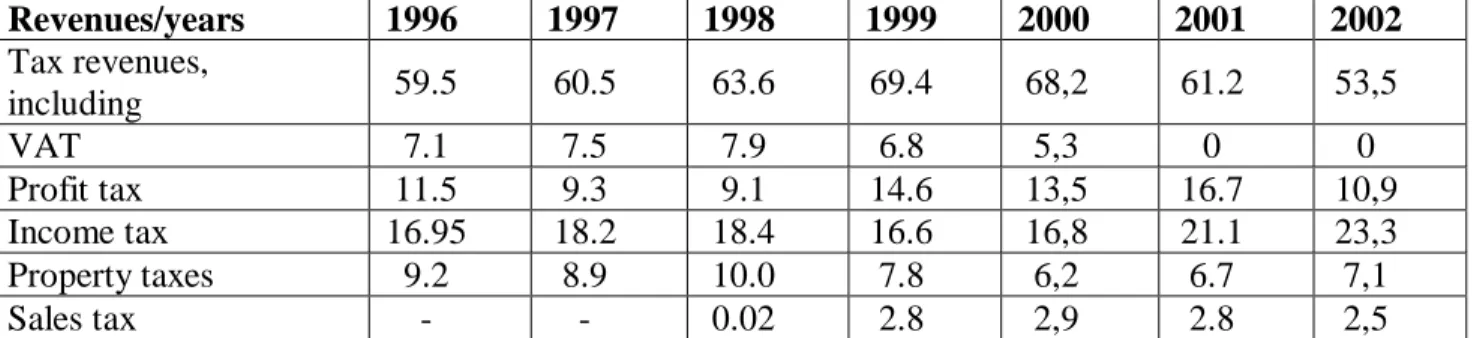
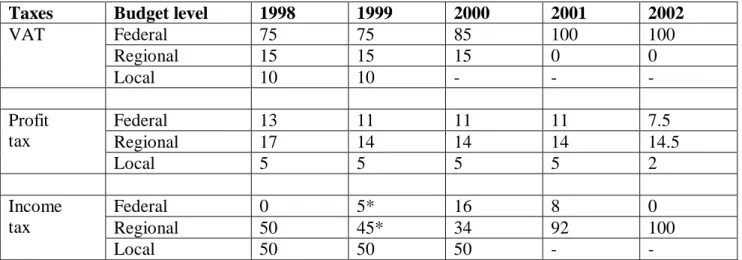
From 1992 to 1999, VAT was one of the most important sources of revenue for local budgets (in 1999 VAT accounted for 10 percent of total local government tax revenues). In Russia, income tax is paid by employers on behalf of employees (taxpayers). The economic and administrative preparatory work leading up to the introduction of real estate tax in Russia began in 1997 with the adoption of the Federal Law on Carrying out a Pilot Project on Real Estate Taxation in the Cities of Veliky Novgorod and Tver.
The federal law of 1997 served as the basis for the adoption in 1999 of the Oblast law on the implementation of a pilot project on the taxation of real estate in the city of Veliky Novgorod.
MUNICIPAL REVENUE BUDGETS
- MUNICIPAL REVENUES REFORM
- RUSSIAN SYSTEM OF BUDGETARY REVENUE SHARING
- STRUCTURE OF MUNICIPAL REVENUES
- STRUCTURE OF REVENUES OF SELECTED RUSSIAN CITIES
- VERTICAL BALANCE OF FISCAL RELATIONS: THE REGIONAL LEVEL
This list is much shorter than that of the 1991 law on the basic principles of the tax system in the Russian Federation. The article of the Tax Law, which establishes an abbreviated list of local taxes and levies (all five in total), will only enter into force after the repeal of this law. This is a very good illustration of the “implementation” of the principle of fiscal autonomy as proclaimed in the Budget Code.
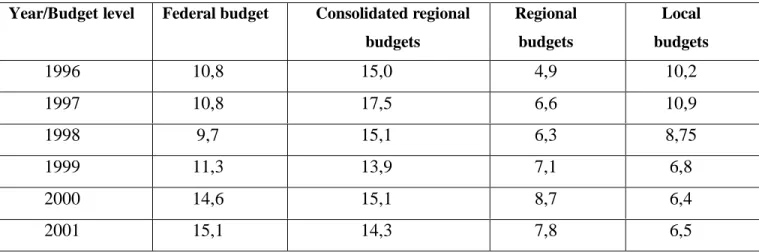
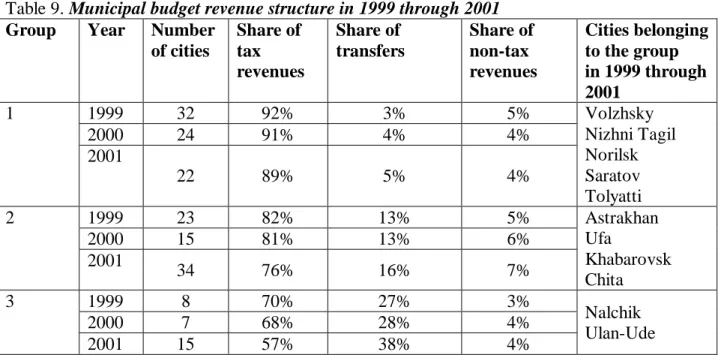
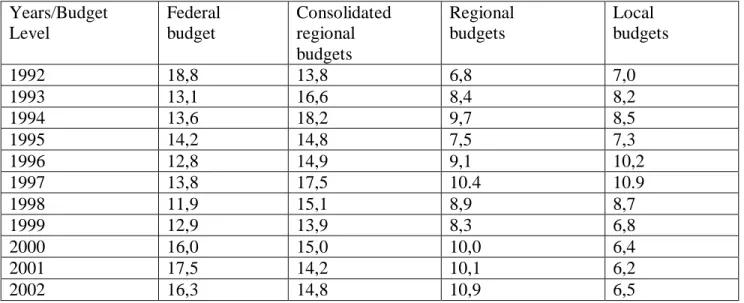
Along with the improved federal budget-to-GDP ratio, the federal/regional consolidated budget ratio also improved. In 2000, federal budget revenues exceeded revenues from a consolidated regional budget for the first time since 1992. One of the indicators of the municipal revenue structure is the ratio between their tax revenues and transfers.
For example, in 2001 income tax revenues were distributed as follows: revenues equal to 1 percent of the tax rate were transferred to the federal budget, and the rest (12 percent of the tax rate) to regional budgets. We can agree that the abolition of this tax was a necessary step in improving the tax system in general. In general, the geographical distribution of the cities included in the sample is quite even, covering 60 subjects of the Russian Federation.
An analysis of the budget data of the cities included in the sample shows that the share of transfers from the federal budget grew in 80% of the municipalities from 1999 to 2001, with the most visible growth recorded in 2001. The ten-year review of the federal tax code made the revenue structure of local budgets particularly unsustainable.
SPENDING RESPONSIBILITIES AND EXPENDITURE BUDGETS OF
- LEGISLATIVE REGULATION OF SPENDING RESPONSIBILITIES OF RUSSIAN
- FEDERAL MANDATES
- STRUCTURE OF MUNICIPAL EXPENDITURES
- Analysis of Local Budget Spending on the Housing and Utility Sector (based on the
- Capital Investment from Local Budgets (an analysis based on the data from cities
- REALLOCATION OF SOCIAL EXPENDITURE RESPONSIBILITIES BETWEEN
- MUNICIPAL ACCOUNTS PAYABLE
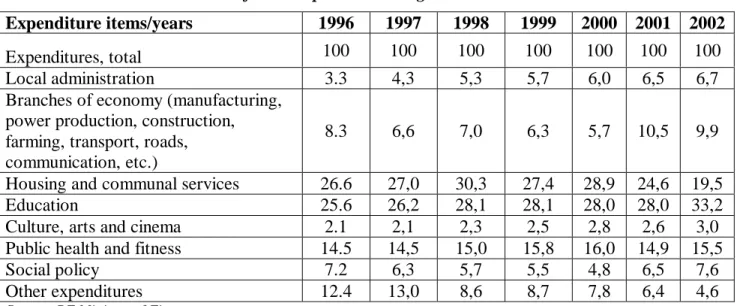
Resources for financing federal mandates are usually allocated to the budgets of subjects and municipalities of the Russian Federation based on the sector criterion (subsidies for housing and communal services, free public transport, etc.). The share of capital investment in the total expenditure of the cities under review remained stable at about 11% from 1999 to 2001 (See Table 15). At the same time, budget power equalization methods are used in a number of subjects of the Russian Federation (Republic of Chuvashia, Tomsk Region, Stavropol Territory, Khanty-Mansi Autonomous District and others).
The last six years have witnessed a comparative growth in the regions' subsidies to the education sector. Source: Reports of the Ministry of Finance of the Russian Federation on the implementation of budgets of the subjects of the Russian Federation and local budgets as of 1 January 2002. In these regions, almost all costs for the housing and utilities sector are covered by municipal authorities.
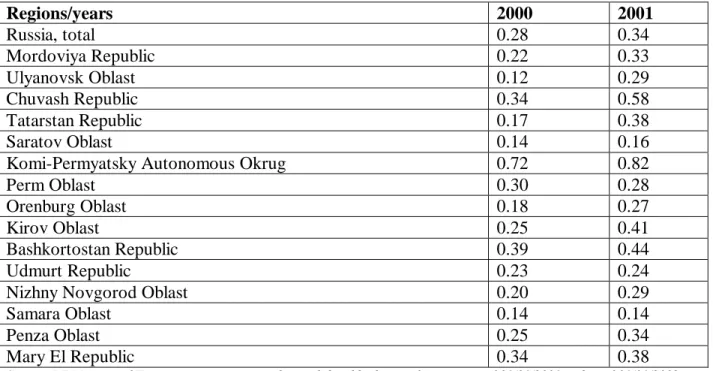
In Ulyanovsk Region, Komi-Permyatsky Autonomous District (in 2001) and the Republic of Chuvashia, a significant part of housing and utility sector costs are covered by regional budgets. As in the cases described above, we can try to explain the differences in the share of spending between the regional and local budgets by the strength of the regional budget. The relationship between the budget power of the regions of the Volga Federal District and the share of regional budgets in the financing of some expenditure items in 2000-2001.
The data in the table show that the share of regional budgets in expenditures for the housing and communal complex increases with the increase in the power of the budgets of the subjects of the Russian Federation. The analysis also showed a link between the type of spending policy and the strength of the city budget. This statement is shown on the example of the regions of the Volga Federal District (see Table 24).
Bills payable on communal services do not reflect the full extent of the problem of arrears in the sector.
MUNICIPAL BORROWINGS AND BUDGET DEFICIT
REFORMS IN THE 90S
BUDGET CODE RESTRICTIONS DEBT FINANCE PRACTICES
Implicitly, this means that municipalities (and RF subjects) can only issue debt obligations to finance their capital expenditure. In accordance with the budget law, municipal finance departments must keep a register of municipal debts, including: the amount of the debt and municipal guarantees; date of issue; forms of security, and amount repaid. The code also obliges municipalities to have a register of debt obligations for municipal unitary companies.
These provisions of the Budget Code are usually violated by local governments (partly because many municipalities only use short-term loans from regional budgets). According to this law, debt obligations (including municipal bonds) cannot be registered if the issuer "violates the provisions of the budget law of the Russian Federation". These restrictions imposed on the issuance of municipal debt obligations have several drawbacks, as described below.
Note that this limitation does not apply to guarantees issued by Federation Subjects or municipalities to secure third-party debt obligations. Furthermore, guarantees cannot be treated as a source of financing the budget deficit, because it is generally assumed that this type of debt obligations is used to cover the costs of the final borrower rather than the cost of a regional/municipal administration. Performance evaluation and measurement criteria to assess the effectiveness of the use of budget resources, including debt obligations, are absent at all levels of the Russian budget system.
This ratio is used by rating agencies, municipalities and national governments to assess municipal credit risks, develop debt strategies and control municipal debt obligations. Another quantitative indicator used for weighting the debt burden is the ratio between the total municipal debt and the total value of private property, which is indicative of the size of the municipal property tax base.
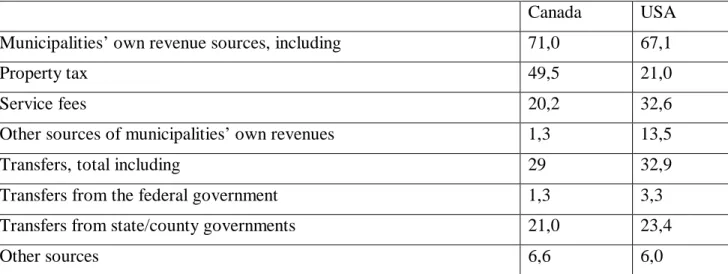
In international practice, there are a number of indicators used to assess municipal credit quality (see, for example, Standard & Poor's, 2002). It is an indicator for assessing the municipality's ability to service its debt from its own resources. In the US, for example, a debt-to-total income ratio above 0.15 percent is usually considered a worrying indicator.
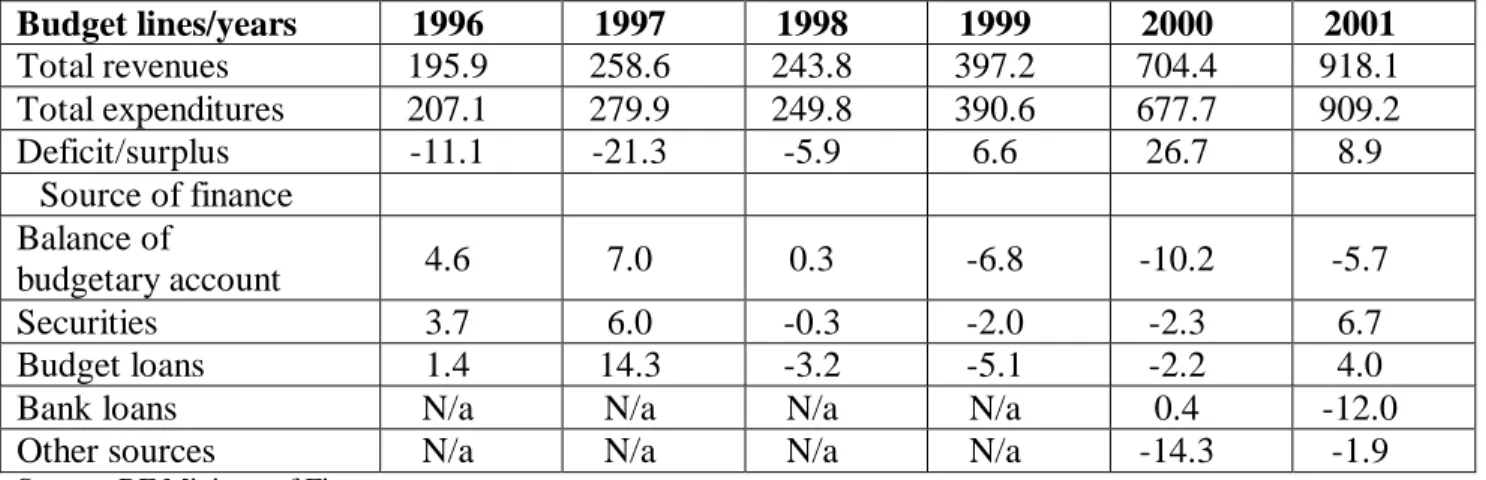
For comparison purposes, let's review the funding sources that regional governments use to cover their budget deficit. From table 26, it is evident that counties have a more developed debt financing system than municipalities. However, in 2001 the Russian regions (except two of them) again, as before the financial crisis, closed the year with a deficit that was covered by the budget and bank loans.
First, the system of debt financing is more developed at the regional rather than the local level, although municipalities' and regions' needs for loans, at least for now, are similar. Petersburg dominates the regional loan market, especially on the regional securities market where the presence of other regions is negligible. SCENARIO CALCULATIONS FOR THE BUDGETARY IMPLICATIONS OF THE EFFECT OF THE DRAFT LAW “ON THE GENERAL PRINCIPLES OF THE.
SCENARIO CALCULATIONS FOR THE BUDGETARY IMPLICATIONS OF THE
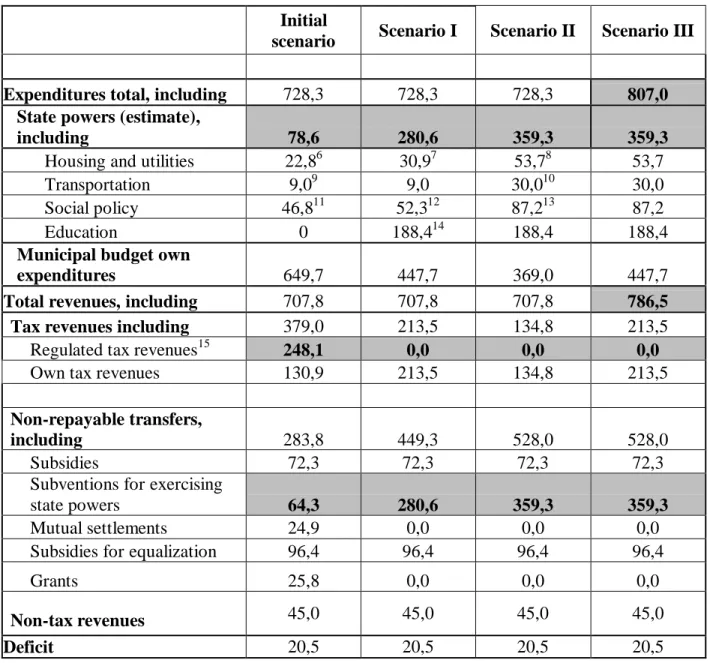
At the same time, the scope of state powers will not be reduced, nor will the scope of local budgets be increased. Today, the share of municipal budget expenditures for the exercise of state powers is 11%, and the municipal budget's own expenditures for solving local issues is 89% (see table 29). In accordance with its provisions, the scope of state powers will change based on the initial scenario.
Expenditure on the provision of housing allowances will be included in the expenditure on the implementation of state powers related to the housing and utilities sector. As a result of these changes, expenditure on the exercise of state power will increase to 281 billion rubles. As a result, local budgets' own tax and non-tax revenues will increase to 36.5% of total revenues, while they currently stand at 25%.
As a result, the share of expenses for the exercise of state powers will be increased by up to 49% by reducing the expenses for the exercise of municipal own powers by 18%. Under this scenario, the share of municipal budget own expenses will correspond to 55%, while the share of expenses for the execution of state powers will correspond to 45%. At the same time, the share of spending powers granted by state authorities to local self-government will increase to 39-49% of total municipal budget expenditure compared to the current level of 11%.
Also, non-returnable transfers will increase, except for subsidies for the exercise of state powers (taking into account the elimination of regulated taxes). The implementation of the provisions of the draft law on the financing of state powers assigned to the local level through subsidies will strengthen the financial position of local budgets.