Experimental study of Gamow-Teller transitions via the high-energy-resolution
18O(
3He , t )
18F reaction: Identification of the low-energy “super” -Gamow-Teller state
H. Fujita ,1,*Y. Fujita,1,2Y. Utsuno,3K. Yoshida,4T. Adachi,1A. Algora,5,6M. Csatlós,6J. M. Deaven,7,8,9 E. Estevez-Aguado,5C. J. Guess,7,8,9,†J. Gulyás,6K. Hatanaka,1K. Hirota,1R. Hutton,7,8,9,‡D. Ishikawa,1 A. Krasznahorkay,6H. Matsubara,1,§F. Molina,5,H. Okamura,1,¶H. J. Ong,1G. Perdikakis,7,8,9B. Rubio,5C. Scholl,10,#
Y. Shimbara,11,**G. Süsoy,1,12T. Suzuki,1A. Tamii,1J. H. Thies,13R. G. T. Zegers,7,8,9and J. Zenihiro1,††
1Research Center for Nuclear Physics, Osaka University, Ibaraki, Osaka 567-0047, Japan
2Department of Physics, Osaka University, Toyonaka, Osaka 560-0043, Japan
3Advanced Science Research Center, Japan Atomic Energy Agency, Tokai, Ibaraki 319-1195, Japan
4Department of Physics, Kyoto University, Kyoto, 606-8502, Japan
5Instituto de Física Corpuscular, CSIC-Universidad de Valencia, E-46071 Valencia, Spain
6Institute of Nuclear Research (ATOMKI), H-4001 Debrecen, Post Office Box 51, Hungary
7National Superconducting Cyclotron Laboratory, Michigan State University, East Lansing, Michigan 48824-1321, USA
8Joint Institute for Nuclear Astrophysics, Michigan State University, East Lansing, Michigan 48824, USA
9Department of Physics and Astronomy, Michigan State University, East Lansing, Michigan 48824, USA
10Institut für Kernphysik, Universität zu Köln, 50937 Köln, Germany
11Graduate School of Science and Technology, Niigata University, Niigata 950-2181, Japan
12Department of Physics, Istanbul University, Istanbul 34134, Turkey
13Institut für Kernphysik, Westfälische Wilhelms-Universität, D-48149 Münster, Germany
(Received 26 July 2019; published 26 September 2019)
Using the high-resolution 18O(3He,t)18F reaction at 0◦ and at 140 MeV/nucleon, Gamow-Teller (GT) transitions were studied. A high energy resolution of 31 keV was achieved by applying dispersion matching techniques. The main part of the observed GT transition strength is concentrated in the transition to the 18F ground state (g.s.). The absolute values of the reduced GT transition strengths, B(GT), were derived up to Ex=12 MeV assuming proportionality between theB(GT) values and the reaction cross sections at 0◦. The B(GT) value obtained from theβdecay of18F (g.s.)→ 18O (g.s.) was used to determine the proportionality constant. A totalB(GT) of 4.06(5) was found and 76(1)% of the strength is concentrated to the ground state of18F. The obtainedB(GT) values were compared with those from the18O(p,n)18F reaction and the mirror symmetric β+ decay of18Ne → 18F. The candidates for 1+ states with isospin T =1 were identified by comparison with the18O(p,p) data. The results of shell-model and quasiparticle-random-phase approximation calculations suggest constructive contributions of various configurations to the18F ground state, suggesting that this state is the low-energy super GT state.
DOI:10.1103/PhysRevC.100.034618
*hfujita@rcnp.osaka-u.ac.jp
†Present address: Department of Physics and Applied Physics, University of Massachusetts Lowell, Lowell, Massachusetts 01854, USA.
‡Present address: Institute for Defense Analyses, Alexandria VA USA, 22311.
§Present address: Tokyo Women’s Medical University, Shinjuku, Tokyo, 162-8666, Japan.
Present address: Comisión Chilena de Energía Nuclear, Post Office Box 188-D, Santiago, Chile.
¶Deceased.
#Present address: Institute for Work Design of North Rhine- Westphalia, Radiation Protection Services, 40225 Düsseldorf, Germany.
I. INTRODUCTION
Gamow-Teller (GT) transitions with Jπ =1+ are me- diated by the simple σ τ operator and therefore are charac- terized by no orbital angular-momentum transfer (L=0) and spin-isospin flip nature (S =1 andT =1). Gamow- Teller transitions from a nucleus with Z and N to states in a neighboring nucleus with Z∓1 and N±1 are called GT± transitions by analogy from the β± decay. Thus GT± transitions have the nature of Tz= ±1, where Tz is the third component of isospin T and defined by (N−Z)/2.
**Present address: CYRIC, Tohoku University, Aramaki, Aoba, Sendai, 980-8578, Japan.
††Present address: RIKEN Nishina Center, Wako, Saitama 351- 0198, Japan.
The reduced GT transition strength B(GT) is an important physical quantity for our understanding of the nuclear struc- ture [1–3] as well as for the calculation of astrophysical processes [4,5].
AbsoluteB(GT) values can be determined directly fromβ- decay studies. However, these studies are limited by the decay Qvalues. On the other hand, charge exchange (CE) reactions, such as (p,n) or (3He,t), performed at 0◦and at intermediate incoming energies (Ein>100 MeV/nucleon), can be used to map the GT strengths over a wider range of excitation energies. For this purpose, one relies on the approximate proportionality between the reaction cross sections at 0◦and theB(GT) values [3,6,7].
The pioneering (p,n) reactions performed at 120–
200 MeV revealed bumplike resonance structures of GT strength named Gamow-Teller resonance (GTR) in the high- excitation-energy (Ex) region of 10–15 MeV. They have a width of a few MeV and carry the main part of the observed GT strength. Systematic study of GTRs have been reported for nuclei heavier thanA∼50 [2,8,9].
In the 1990s, the (3He,t) reaction at intermediate energy became available for the study of GT transitions. One-order- of-magnitude improvement in energy resolution has been achieved [3] in combining a magnetic spectrometer with dispersion matching techniques [10,11]. Due to the better resolution, the GTRs were resolved into many discrete excited states (GT states) in the (3He,t) reaction on f- and p f-shell target nuclei 54Fe,58Ni, and 64Ni [12–14]. In addition, in a recent systematic study on thef-shellN =Z+2 target nuclei
42Ca,46Ti,50Cr, and54Fe, it was found that the distributions of GT strengths are strongly mass dependent [15,16]. In the
54Fe(3He,t)54Co reaction, the GT strength is mainly concen- trated in the GTR region (Ex=8–13 MeV). Moving on to the lighter nuclei50Cr and46Ti, less GT strength remained in the GTR region. Finally, in the42Ca(3He,t)42Sc reaction, the GT strength was mostly concentrated in the 1+1 state, which was named thelow-energy super-GT(LeSGT) state [15,16].
Note that the42Ca nucleus has the40Ca+2nstructure, where the40Ca behaves as an LS-closed inert core for GT transition.
The strong concentration of the GT strength is attributed to the contribution of the isoscalar-type attractive interaction that is active among the particle-particle-type configurations on the
40Ca inert core [16–18].
Since18O nucleus also has the16O+2nstructure, a similar concentration of the GT strength to the 1+1 state is expected in the18O → 18F transition. Using the18O(p,n)18F CE reaction atEp=135 MeV [19], at 118 MeV [20] and at 494 MeV [21], a strong concentration of the GT transition to the18F ground state (g.s.) is reported. However, due to the energy resolution of 300–500 keV in the (p,n) reactions, details of the weak GT excitations could not be studied.
In this paper, we will present a study of GT transitions from
18O nucleus via the high-resolution18O(3He,t)18F measure- ment performed at the Research Center for Nuclear Physics (RCNP), Osaka. Due to the high energy resolution realized by the use of the Grand Raiden magnetic spectrometer and application of the dispersion matching techniques [10,11], not only the strongly excited ground state but also weakly excited GT states could be studied up to 12 MeV.
II. PROPERTIES OF SPIN-ISOSPIN EXCITATIONS A. Reduced transition strengths
The reduced GT transition strengthB(GT) is defined by B(GT)=1
2 1 2Ji+1
CGT2
2Tf +1|M(στ)|2, (1) whereCGTandM(στ) are the isospin Clebsch-Gordan (CG) coefficient and the doubly reduced σ τ transition matrix el- ement, respectively [3]. In CE reactions at 0◦ and at inter- mediate incident energies, the close proportionality between the reaction cross sections and theB(GT) values is given by [3,6,7]
dσGT
d =σˆGTfGT(ω)B(GT), (2) where ˆσGTis the GT unit cross section at energy transferω= 0. The factor fGT(ω) gives the dependence of the GT cross section on the energy transfer and thus momentum transfer, which takes value 1 atω=0.
In the Fermi transition, a similar proportionality dσF
d =σˆFfF(ω)B(F) (3) is expected.
TheR2value is defined as the ratio of GT and Fermi unit cross sections [7,22,23],
R2= σˆGT
σˆF
, (4)
which is a measure representing the ratio of strengths of the τ andσ τ terms of the effective interaction at a specific beam energy.
Proton inelastic scattering (IE) performed at small scat- tering angles, especially at 0◦ and intermediate energies, are also a good tool to study the στ response of nuclei [3,24].
In analogy with theM1 transitions via the electromagnetic interaction, we callJπ =1+transitions caused by the (p,p) reaction asM1σtransitions [3].
Neglecting the contributions from theσ and other minor non-σ τ terms, a proportionality similar to Eq. (2) is expected in the (p,p) reaction [25–27],
dσM1
d ≈σˆM1fM1(ω)B(M1σ). (5) We defineB(M1σ) [3], the reduced transition strength assum- ing pureστ interaction, as
B(M1σ)= 1 2
1 2Ji+1
CM12
2Tf +1|M(σ τ)|2, (6) whereCM1is the isospin CG coefficient for the transitions to M1 states. Assuming isospin symmetry and no contribution of meson exchange current (MEC) [28,29], identicalM(σ τ) values are expected for analogous transitions to GT andM1 states.
B. Isospin symmetry inA=18 system
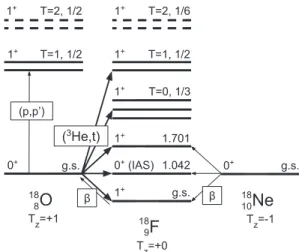
In Fig.1, the18O → 18F GT transitions and the analogous transitions are summarized with the corresponding isospin CG coefficients. The18O nucleus hasTz=(N−Z)/2= +1 and
T=1, 1/2 1+
T=1, 1/2 1+
O
Tz=+1
F
Tz=+0 0+
1+ 0+ (IAS) 1+ 1+
Ne
Tz=-1 0+ g.s.
S) 1.042 1.701
g.s.
g.s.
(p,p’)
(3He,t)
β β
T=0, 1/3 T=2, 1/2
1+ 1+ T=2, 1/6
O
T = 18
8
F
T =+
18 9
N
T 18 10
FIG. 1. Isospin structure of analogous GT and Fermi transitions among theA=18 isobars18O,18F, and18Ne withTz= +1, 0,−1, respectively. TheJπ values, isospinT, and the squared values of the isospin Clebsch-Gordan coefficients are given for the representative states.
initial isospinT0=1. By the GT− transitions from the18O nucleus, therefore, GT states withT =0, 1, and 2 in18F (Tz = 0) nucleus are nominally expected, as shown in Fig.1. On the other hand, in the IE scattering such as (p,p),M1 states with T =1 and 2 in18O are expected. BecauseTz = +1 in18O, a final isospin ofT =0 is forbidden.
In the naive shell-model (SM) picture, the ground state of
18O is described by the LS-closed16O inert core havingT = 0 plus two valence neutrons occupying thed5/2 orbit. This picture suggests that the final GT states in18F have a proton (π) and a neutron (ν) with configurations of (πd5/2, νd5/2) and (πd3/2, νd5/2) and the total isospin is determined by these two valence nucleons. SinceT =2 cannot be formed by two nucleons, the GT states withT =2 cannot be excited in18F without breaking the16O inert core. For the same reason, the M1 states with T =2 are not allowed in18O nucleus. The T =2 states, therefore, are shown with dashed lines in Fig.1.
Assuming isospin symmetry, the identical values are ex- pected for the matrix elementsM(στ) in Eqs. (1) and (6) for the analogous GT andM1σ transitions. Since the isospin CG coefficientsCGTandCM1for the GT andM1σtransitions to the T =1 states are the same (see Fig.1), it is expected that the correspondingB(GT) andB(M1σ) values are also identical.
It should be noted that existence of large components of high-momentum neutrons in the16O ground state due to the tensor interaction was suggested via the16O(p,d)15O reaction recently [30]. This result suggests that the inert 16O core is not closed and therefore the GT and M1 states with T =2 can exist. However, even if they exist, the isobaric analog state (IAS) of18N ground state havingT =2 is expected at Ex∼16 MeV in18O, which corresponds to 17 MeV in18F.
This energy region is, however, out of observable region of the present data.
III. EXPERIMENT
The 18O(3He,t)18F experiment was performed at the RCNP. The lateral and angular dispersion matching
techniques [10] were applied in order to realize high energy resolution and good scattering-angle resolution in the horizontal direction, respectively. A 140-MeV/nucleon
3He2+ beam of∼5 enA from the RCNP ring cyclotron [31]
was transported onto the target by using the WS course beamline [32]. A diagnostic method of dispersion matching and focusing conditions, the faint beam method [11], was applied in order to realize matching conditions.
The enriched 18O gas was filled in a gas cell target system [33] with aramid foil windows. For the background subtraction, the measurement with an aramid foil target was performed. Scattered tritons were momentum analyzed by the Grand Raiden magnetic spectrometer [34] located at 0◦. The
3He2+ beam was stopped in a Faraday cup placed inside the first dipole magnet of Grand Raiden.
The tritons were detected by the two multiwire drift cham- bers (MWDCs) [35] placed along the focal plane with an angle of 45◦ relative to the central ray of the spectrometer.
Each MWDC consists of two anode wire planes, with one set of sense wires stretched vertically (X) and another set of wires tilted at an angle of 48.2◦ (U) with respect to the vertical direction. By combining the X and U position information, vertical position (Y) in the focal plane was also obtained. Incident angles of the particles were obtained by the X and Y information from the two MWDCs. Two plastic scintillators downstream of the MWDCs were used for the particle identification and the generation of timing signals.
In order to achieve good scattering-angle resolution in the vertical direction, the over-focus mode [36] of Grand Raiden was applied. In combination with the angular dispersion matching technique [10], precise measurements of the scat- tering angles in both horizontal and vertical directions were realized. The precise 0◦scattering angle was determined from the incident angle of singly charged3He+particles in the focal plane that are produced by atomic-electron capture processes in the target. Defocusing effects in the detector plane due to the kinematic recoil and aberration of the magnetic field were corrected by software.
IV. DATA ANALYSIS A. Peak fitting andExcalibration
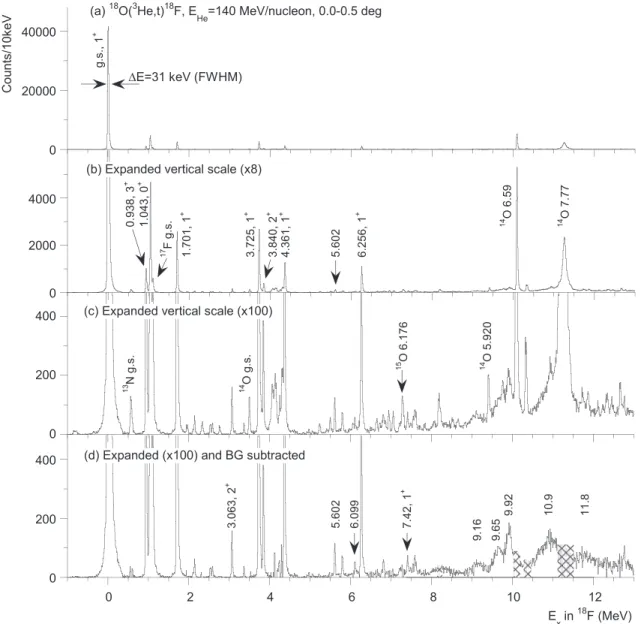
The 18O(3He,t)18F spectra with different vertical scales are given in Fig. 2, where the events within the scattering angles of 0.0◦–0.5◦ are selected. As a result of the software corrections, an energy resolution of 31 keV (E/E =7.4× 10⁻⁵) was achieved. The overview is given in Fig.2(a), while the vertical scales are expanded by a factor of 8 and 100 in Figs. 2(b) and2(c), respectively. Before the peak fitting analysis, the background (BG) events originated from the aramid foil windows of the gas cell and nitrogen in the contaminated air were subtracted. The spectrum after the BG subtraction is shown in Fig.2(d).
Positions and counts of the peaks were obtained from the peak fitting analysis [37] using the peak shape of the strongest and isolated18F ground state as a reference. The shapes of the states having decay widthswere reproduced by combining the reference peak shape and the width represented by a
FIG. 2. Excitation energy spectra of 18O(3He,t)18F measurements for scattering angles 0.0◦–0.5◦ (a) with full vertical scale, (b) with expanded scale (×8), (c) with more expanded scale (×100) before the BG subtraction, and (d) with the same scele as (c) but after the BG subtraction. An energy resolution of 31 keV is achieved. For details, see text.
Lorentzian function. Above the proton separation energy Sp
of 5.6 MeV, a continuum caused by the quasifree scattering (QFS) [38] is expected. Amount of the QFS was estimated as a smoothly increasing function of excitation energy by connecting valleys of the spectra above the proton separation energy (see Fig.4).
The relationship between the peak positions and the out- going triton momenta were determined by the known states in12,13N and16,18F observed in the data using a polyethylene terephthalate (C10H8O4) film as a target. From the obtained relationship, the excitation energies of states in 18F were re- constructed. Due to the large difference between theQvalues for18O(3He,t)18F and12C(3He,t)12N reactions (−1.67 MeV and−17.36 MeV, respectively), excitation energies of states in18F can be determined by interpolation to 18 MeV.
In Table I, theExvalues obtained in the present analysis are compared with the evaluated values [39]. The recon-
structed excitation energies in18F are in agreement with the evaluated values within 1 keV accuracies up to 5.6 MeV.
Above this energy, the differences between the evaluated and reconstructed values are typically 5 keV. It should be noted that the uncertainties of the evaluated values are less than 0.3 keV belowEx=5.6 MeV, whereas above this excitation energy their uncertainties are about 1–3 keV.
B. L=0 identification
It is known that the angular distributions for the GT transi- tions, having the orbital angular-momentum transferL=0 nature, show maximum cross section at 0◦and a characteristic rapid decrease at larger scattering angles. On the other hand, such angular distribution is not expected for theL1 tran- sitions. In order to identify GT states, the angular distributions of the observed states were examined.
TABLE I. EvaluatedExandJπ values of states up to 6.3 MeV and theExandRr4derived in the present analysis. For definition of theRr4ratio, see text.
Evaluated valuesa Present analysis
Ex(MeV) Jπ Ex(MeV) Rr4
0.000 1+ 0.000 1.0b
0.93720(6) 3+ 0.938 1.3
1.04155(8) IAS, 0+ 1.043 1.2
1.70081(18) 1+ 1.701 1.1
3.06184(18) 2+ 3.063 1.9
3.72419(22) 1+ 3.725 1.3
3.83917(22) 2+ 3.840 1.5
4.36015(26) 1+ 4.361 1.0
5.60338(27) 5.60486(28)
1+ 1−
5.602 1.9
5.786(2) 2− 5.791 >10
6.0964(11) 6.108(3)
4− (1+)
6.099 >5
6.262(3) 1+ 6.256 1.1
aFrom Ref. [39].
bRr4ratio of this state is normalized to be 1.
We define the “ratio of ratio” of counts, Rr, as follows.
First, the counts of states in the spectra for the scattering angles of 0.0◦–0.5◦, 0.5◦–0.8◦, 0.8◦–1.2◦, 1.2◦–1.6◦, and 1.6◦–2.0◦, which will be denoted with a subscript j=0–4,
were normalized by the counts in the 0.0◦–0.5◦ (i.e., j=0) spectrum. These ratios for each state were further normalized by the corresponding ratios of the18F ground state, which is the strongest GT state. Therefore, theRrjratios are defined by
Rrj = Nj
N0
Njg.s.
N0g.s., (7) whereNj is the count for each state in the jth spectrum and Njg.s. is that for the ground state. All the states, therefore, take the ratioRr0=1 by definition. For the states having the L=0 nature,Rr1−4∼1 are expected due to the similarity of angular distributions. On the other hand, for the states with L1 nature, Rr1−4 values would be larger than unity because rapidly decreasing angular distribution is not expected. It should be noted that expectedRrvalue changes slightly as a function ofExmainly due to the kinematic effect.
By the distorted-wave Born approximation (DWBA) reaction calculation for the GT transition, difference of theRrvalues atEx=0 and 15 MeV is estimated to be less than 5%.
The obtainedRr4 ratios for the states below 6.5 MeV are summarized in TableI. In this region, theJπ values of most of the observed states are known and the 1+ and 0+ states showRr4∼1 as expected from theirL=0 nature. On the other hand, the 2+ states at 3.062 and 3.839 MeV and the 2− state at 5.786 MeV show larger Rr4 values as expected from their L1 nature. It should be noted, however, that the 3+ state at 0.937 MeV showsRr4 value similar to those
Cross section (arb. units)
FIG. 3. Obtained angular distributions for the low lying states (top) and the correspondingRrvalues (bottom). In the left-top panel, the angular distribution of the18F ground state, which is used as the standard for the derivation ofRrratios, is also shown. For details, see text.
0 100 200
Co un ts/1 0ke V
9.167.597.42 9.92 11.86.81 9.65 10.9
(a) 0.0-0.5 deg
0 200
400 (b) 0.8-1.2 deg
0 150 300
7 8 9 10 11 12
6.66 7.22 8.06 8.22 8.34
E
x(MeV)
(c) 1.6-2.0 deg
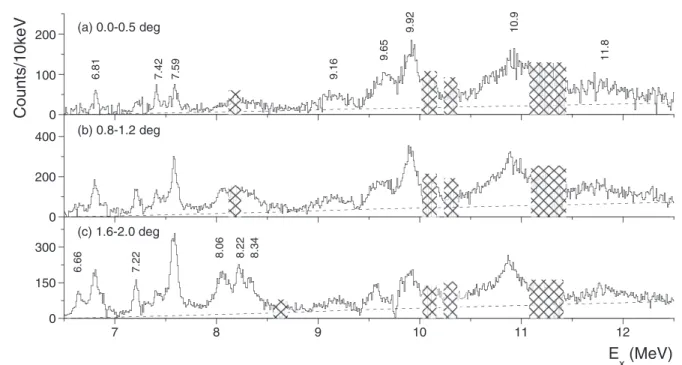
FIG. 4. The 18O(3He,t)18F spectra in the energy region ofEx=6.5–12.5 MeV for scattering angles (a) 0.0◦–0.5◦, (b) 0.8◦–1.2◦, and (c) 1.6◦–2.0◦. Vertical axes are normalized by the corresponding solid angles. Events from contaminating nuclei are subtracted in all the spectra. The regions where the spectra are distorted by the background subtraction are hatched. The dashed lines show the QFS continuum assumed in the peak decomposition analysis. For details, see text.
of the 1+ states, which was discussed in detail in Ref. [16].
As examples, angular distributions and the obtained Rr0−4
values for the low-lying states are shown in Fig.3. The angular distribution of the 18F ground state, which was used as the normalization standard of theRrjvalues, is also shown.
For the weakly excited peak at 5.60 MeV,Rr4=1.9 was obtained. Since this peak can be a doublet of the 1+ and 1− states at 5.603 and 5.605 MeV, respectively, the largeRr4can be attributed to the contribution from the 1− state. The peak at 6.10 MeV, havingRr4>5, can also be a mixture of the 1+ and 4−states at 6.108 and 6.096 MeV. In both cases, even if the obtained counts in the 0.0◦–0.5◦spectrum are purely from the 1+states, the estimatedB(GT) values for these peaks are less than our detection limit ofB(GT)=0.01.
In Figs. 4(a), 4(b), and 4(c), the 18O(3He,t) spectra from 6.5 to 12.5 MeV are shown for the scattering angles 0.0◦–0.5◦,0.8◦–1.2◦, and 1.6◦–2.0◦, where the events from the contaminating nuclei are subtracted. The deteriorated parts in the spectra due to the subtraction are hatched. The estimated QFS continuum is shown by dashed lines. Since the counts in Fig. 4 are normalized by the corresponding solid angles, relative peak heights of the states roughly represent the angular distributions.
In Table II, Rr4 ratios, excitation energies, and widths of peaks () are summarized for the states above 6.5 MeV.
Candidates for the corresponding states evaluated in Ref. [39]
are also shown. Ambiguities of the width was estimated from the results of the peak fitting analysis using the spectra for different scattering angles. For most of the states, more-or- less good agreements of widths were found.
A peak observed at 7.42 MeV becomes weaker at larger scattering angles, as can be seen in Figs.4(a)–4(c). Although
this state shows relatively largeRr4 value of 2.3, we tenta- tively giveL=0 assignment for this state since theRr1−3
TABLE II. EvaluatedExandJπ values, and natural decay width for the states above 6.5 MeV and theEx,,Rr4, andLvalues derived in the present analysis. For the definition of ratioRr4, see text.
Evaluated valuesa Present analysis
Ex Ex
(MeV) Jπ (keV) (MeV) (keV) Rr4 L
6.6437(8) 6.647(4)
2− 1−
0.60(7) 91(4)
6.66 30–50 >10 1 6.803(2)
6.809(5)
1+,2,3+ 2−
<2 88(2)
6.81 80–90 >5 1 7.201(2)
7.247(2)
(4+) (1+)
6.5 46.5
7.22 40–50 >5 1 7.406(2) 1+ 14.6(14) 7.42 20–30 2.3 (0)b 7.555(2)
7.584(2)
(1−) 30
9(2)
7.59 70–80 >5 1
8.064(6) 4 60 8.06 140–160 >10 1
8.209(2) 8.238(2)
2− 4+
52 20
8.22 50–70 >10 1 8.34 150–220 >5 1 9.16 200–300 1.5 (0) 9.65 170–230 0.75 (0) 9.92 140–160 1.5 (0) 10.9 400–600 1.5 (0) 11.8 400–600 1.4 (0)
aFrom Ref. [39].
bSee text.
TABLE III. TheB(GT) values obtained from the present18O(3He,t)18F reaction, the18Neβ+ decay [39,47], the18O(p,n) reactions [19–21], and theB(M1σ) values from the18O(p,p) reaction data [26]. TheB(GT) values from the (p,n) reactions [19–21] are renormalized using the present standard value from the18Fβ-decay data [39]. For theB(GT) values from Ref. [19], additional ambiguities of 5% were added due to the relative ambiguity of the 0◦cross sections. The units of the transition strengths from the (p,p) data [26] are converted to those of theB(M1σ) values for the direct comparison. For details, see text.
Present data 18Neβdecay (p,n)a (p,n)b (p,n)c (p,p)
Ex B(GT,F) T B(GT,F) Ex B(GT) T Ex B(GT) B(GT) Exin18O B(M1σ)
g.s. 3.092(16) 0 3.123(24) g.s. 3.092(16) 0 g.s. 3.092(16) 3.092(16)
1.043 (IAS) 2 1 2.11(6)
1.701 0.170(2) 0 0.131(5) 1.70 0.187(13) 0 1.70 0.21(2)
3.725 0.173(2) 0 3.72 0.177(13) 0 3.72 0.19(2)
4.361 0.090(2) 0 4.35 0.084(6) 0 4.35 0.09(1)
5.602 <0.01 0
6.099 <0.01 0
6.256 0.069(1) 0 6.26 0.059(4) 0 6.11+6.26 0.08(1)
7.42 <0.01 0
9.16 0.03(1) 0
9.65 9.92
0.05(1) 0.07(2)
0
1 9.9 0.056(4) (1) 9.9 0.14(2) 8.82 0.07(1)
10.9 11.8
0.19(3) 0.07(2)
1 1
10.9 11.9
0.084(6) 0.061(4)
(1) (1)
11.1 12.0
0.18(3)
0.12(2) 10.10 0.31(4)
12.4–15.0
Total 4.06(5) 3.80(3) 4.10(5) 4.2(5)
aAtEp=135 MeV [19].
bAtEp=118 MeV [20].
cAtEp=494 MeV [21].
values of this state are within 1.0–1.5. It should be noted that there is a corresponding 1+ state at 7.406 MeV [39].
Except for this state, all of the observed states between 6.5 and 8.5 MeV become stronger at larger scattering angles (see Fig.4), suggesting theirL1 nature.
Above 9 MeV, most of the states showRr1−3 of 0.9–1.3;
however,Rr4values are 1.4–1.5 except for the 9.65-MeV state withRr4=0.75. As shown in Figs.2(c)–2(d)and Fig.4, this region suffers from the large BG events and the QFS con- tinuum, which may introduce large ambiguities to theRr1−4
values. Therefore, we give tentativeL=0 assignments for these states as summarized in TableII.
C. Estimation of the fGT(ω) term
The energy transferωdependence of the fGT(ω) value in Eq. (2) was estimated from the reaction cross sections calcu- lated by a series of DWBA codes, WSAW, FOLD, and DWHI [40]. Optical potential parameters for the18O+3He channel were estimated by interpolating the values derived for16O and
28Si [41–44]. For the outgoing18F+triton channel, the well depths were multiplied by a factor of 0.85 without changing the geometrical parameters following the arguments given in Ref. [45]. In these calculations, pureστ-type interaction was assumed.
The fGT(ω) estimation was performed as follows. First, averaged values of the cross sections at 0◦assumingπd5/2→ νd5/2 and πd5/2→νd3/2 transitions were calculated as a function of energy transferω. The fGT(ω) values were then estimated by normalizing the averaged cross sections to 1
at ω=0. The estimated fGT(ω) value gradually decreases with increasing excitation energy and the amount of decrease fromEx=0 to 10 MeV was about 10%. Contributions of the L=2 component in the DWBA calculations at 0◦was less than 0.1% in both configurations. For the Fermi transition, the
fF(ω) term was estimated in a similar way.
D. Derivation of theB(GT) values and theR2ratio In order to derive the absoluteB(GT) values using Eq. (2), a standardB(GT) value is needed. It was determined from the
18Fβ+decay, which connects the18F g.s. (1+) and the18O g.s.
(0+) in opposite direction to the18O(3He,t)18F reaction (see Fig.1). From the half-life and theQvalue given in Ref. [39], theB(GT) value of 1.031(5) was obtained. Taking the factor of three for the reversed transition into account, aB(GT) value of 3.092(16) was obtained for the 18O g.s.→ 18F g.s. GT transition.
The derivedB(GT) values using this standardB(GT) value are summarized in Table III. We estimate that reasonably preciseB(GT) values are deduced for the transitions with de- rived values larger than 0.01. Except for the18F ground state, no strong GT transition was found. The total GT strength is 4.06(5) and 76(1)% of that concentrated in the transition to the ground state. Assuming no GT+ transition, it is 68% of the Ikeda GT sum rule value of 3(N−Z)=6.
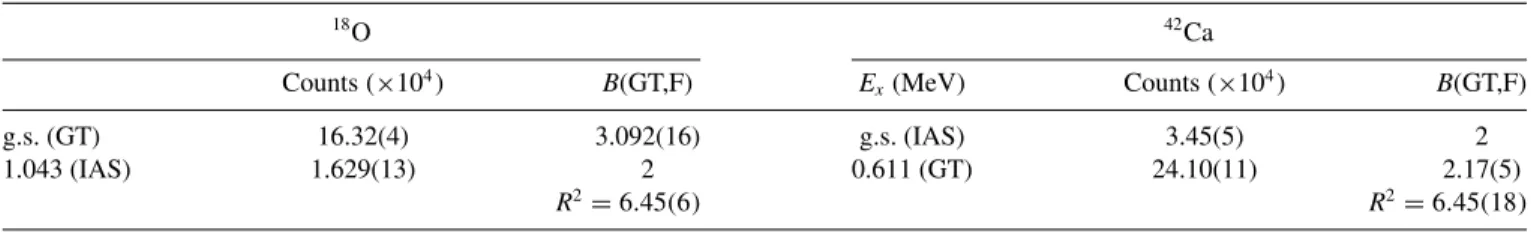
The ratio of the GT and Fermi unit cross sections, i.e., the R2 value [7,22,23], was deduced from the present data. From the observed strengths of the 18F ground state and the IAS at 1.043 MeV in the 0.0◦–0.5◦ spectrum,
TABLE IV. DeducedR2values for18O(3He,t)18F and42Ca(3He,t)42Sc measurements and the related parameters.
18O 42Ca
Counts (×104) B(GT,F) Ex(MeV) Counts (×104) B(GT,F)
g.s. (GT) 16.32(4) 3.092(16) g.s. (IAS) 3.45(5) 2
1.043 (IAS) 1.629(13) 2 0.611 (GT) 24.10(11) 2.17(5)
R2=6.45(6) R2=6.45(18)
R2=6.45(6) was obtained. For comparison, the R2 value from the42Ca(3He,t)42Sc data [16] was also deduced from the 1+1 state at 0.611 MeV and the IAS (ground state). As a result, the identicalR2value with larger ambiguity of 6.45(18) was obtained. It should be noted that, from the GT and Fermi unit cross sections given in Ref. [46] as the functions of A, the R2 value of 4.94 and 6.99 are suggested forA=18 and 42, respectively. Numerical parameters are summarized in TableIV.
V. DISCUSSION
A. Comparison with the available data
In Table III, the present B(GT) values derived from the present 18O(3He,t)18F data up to Ex=12 MeV are shown.
The B(GT) values from the 18Ne β decay [39,47], the
18O(p,n) reactions [19–21], and the B(M1σ) values from the 18O(p,p) scattering data [26] are also shown. In Fig.5, theseB(GT) andB(M1σ) values are shown together. TheEx
value of the18O(p,p) result is shifted by 1.1 MeV so that the analog states are expected to be aligned.
Between the B(GT) values from the present study and those from the mirror symmetric 18Ne → 18Fβ decay (see Fig.1), isospin symmetry was examined. TheB(GT) andB(F) values from the18Neβdecay were deduced by combining the recently published half-life [47] with the branching ratios and the decayQvalue given in Ref. [39]. For the transition to the
18F ground state, the18Ne β decay gives a B(GT) value of 3.123(24), which is consistent with the present standard value of 3.092(16) within the uncertainties. For the Fermi transition, B(F) of 2.11(6) is also reasonably consistent with the expected value ofN−Z =2, suggesting consistency of the data. On the other hand, theB(GT) value of 0.131(5) for the 1+2 state at 1.701 MeV is smaller than the present value of 0.170(2).
The B(GT) values from the 18O(p,n) data at Ep=135 MeV [19], 118 MeV [20], and 494 MeV [21] in Table III are renormalized by using the present standard value of 3.092(16). Ambiguities of theB(GT) values at 135 MeV were estimated from the relative uncertainties of the cross sections of 5% as given in Ref. [19]. For the 1+2 state at 1.701 MeV, the present value of 0.170(2) is 10–20% smaller than those from the (p,n) data at 135 MeV and at 118 MeV. For the states at 3.725, 4.361, and 6.256 MeV, consistentB(GT) values within the uncertainties are found.
Above 9 MeV,Exvalues for the GT states are reasonably consistent with the (p,n) measurements [19,20] as shown in TableIII. Assuming the peaks at 9.65 MeV and 9.92 MeV are observed as one peak at 9.9 MeV in the (p,n) measurements,
the B(GT) values from the present data and the Ep=118 MeV data [20] agree with each other. TheB(GT) value for the 11.1 MeV state from theEp=118 MeV data is also consistent with the present data for the 10.9 MeV state.
FIG. 5. The B(GT) strength distributions from (a) the present (3He,t) data, (b) the (p,n) data at 135 MeV [19], (c) the (p,n) data at 118 MeV [20], (d) the18Neβdecay [39,47], and (e) theB(M1σ) values from the (p,p) data at 201 MeV [26]. The ground-state strengths are divided by a factor of 5. The horizontal axis of (e) is shifted by 1.1 MeV, so that the analog states are expected to be aligned.
As the totalB(GT) strengths, 3.80(3), 4.10(5), and 4.2(5) were obtained from the (p,n) data atEp=135 MeV [19], 118 MeV [20], and 494 MeV [21], respectively. These values are consistent reasonably with the present value of 4.06(5).
As discussed above, it is expected that analogous 1+ states with isospin T =1 are observed commonly in the present 18O(3He,t) and18O(p,p) data. From Eqs. (1) and (6) and isospin CG coefficients for the T =1 states (see Fig.1),B(GT) and B(M1σ) are expected to be identical for analogous GT and M1 states. The B(M1σ) values shown in Table III were converted from theB(σ) values from the
18O(p,p) data [26] at 201 MeV, following the descriptions given in Refs. [3,28], neglecting contributions of non-σ τ-type transitions.
For the state at 9.92 MeV, B(GT) value of 0.07(2) was obtained from the present data. Since the IAS in 18F is at 1.043 MeV, the analog state is expected at around 8.9 MeV in18O. At the corresponding energy of 8.82 MeV, 1+ state with a consistent B(M1σ) value of 0.07(1) was found from the 18O(p,p) data [26]. This fact suggests that these states are in analogous relationship and thus have isospinT =1.
From the present data, the GT states were found at 10.9 and 11.8 MeV. As discussed above, the corresponding 1+ states are also reported from the (p,n) data [19,20]. On the other hand, from the (p,p) data [26], a broad bump structure is reported at Ex=10.10 MeV with the B(M1σ) value of 0.31(4). Since this value agrees with sum of the strengths for the states at 10.9 and 11.8 MeV, 0.26(8), within the ambiguities, we assign isospinT =1 for both of the 10.9 and 11.8 MeV states. TheB(GT) andB(M1σ) values discussed here are summarized in TableIIIand Fig.5.
In the (p,p) data [26], another bump structure was ob- served between 12.4 and 15 MeV. Since no corresponding strength is reported from the (p,n) data, this structure can be the giant dipole resonance, which is excited via the electro- magnetic interaction.
B. Low-energy super Gamow-Teller state
As is given in TableIII, theB(GT) value of 3.092(16) is obtained for the transition to the 18F g.s. (1+1). This value corresponds to 76(1)% of the total strength up to 12 MeV.
A similar concentration of the GT strength to the 1+1 state is reported in the42Ca(3He,t)42Sc reaction [15,16]. A large B(GT) value of 2.17(5), which corresponds to about 80% of the observed strength, was concentrated in the transition to the 1+1 state. Note that theA=18 and A=42 systems are expected to have the same structure in the sense that they consist of LS-closed core and two valence nucleons.
In the SM calculation using the GXPF1J interaction for the GT transition from the 42Ca 0+ ground state to the
42Sc 1+1 state, it was shown that several f- and p-shell con- figurations make an in-phase contributions [15,16]. Similarly, quasiparticle-random-phase approximation (QRPA) calcula- tions also show that this state has a collective nature, which originates from the isoscalar attractive interaction among the particle-particle type configurations of the valence nucleons [15–17]. As a result, a large part of the available single- particle transition strengths are concentrated to the 1+1 GT
state in 42Sc. Because of the collective nature of this state, the 1+1 state at 0.611 MeV in 42Sc is the LeSGT state [15,16,18,48].
Let us discuss the properties of the18F g.s. (1+1) from an empirical view point. In Ref. [20], the GT strengths observed in the 17O(p,n)17F reaction are presented. Starting from the 17O ground state with Jπ =5/2+, two GT transitions to the 17F ground state (5/21+) and the state at 5.00 MeV (3/2+1) with B(GT)=1.062 and 0.57 are reported. They would correspond to theνd5/2 → πd5/2andνd5/2 → πd3/2
transitions on top of the inert 16O core, respectively. Here we notice that twice the sum of theB(GT) values observed in the 17O(p,n)17F reaction agrees well with the present B(GT) value for the 18F ground state, i.e., 3.092(16). This fact suggests that the contributions of theνd5/2 → πd5/2and νd5/2 → πd3/2transitions make in-phase contributions in the transition to the18F ground state and therefore this state has the nature of the LeSGT state.
This picture also suggests the existence of the state, in which theνd5/2 → πd5/2 andνd5/2 → πd3/2contributions cancel each other. Such a state can be called an “anti-LeSGT”
state [48]. In the SM calculation for the42Ca → 42Sc case [16], strong cancellation between the νf7/2 → πf7/2 and νf7/2 → πf5/2 components was found in the transition to the 1+2 state, suggesting that this state has the nature of the anti-LeSGT state. We expect the anti-LeSGT state to exist also in 18F, with a similar destructive contribution between theνd5/2 → πd5/2andνd5/2 → πd3/2components.
C. Shell-model calculations
The SM calculation for the GT transition of the42Ca →
42Sc case showed that f- and p-shell configurations make an constructive contribution to the 1+1, LeSGT state [15,16]. In order to study whether similar contributions exist also in the A=18 system or not, SM calculations were performed for the
18O → 18F case.
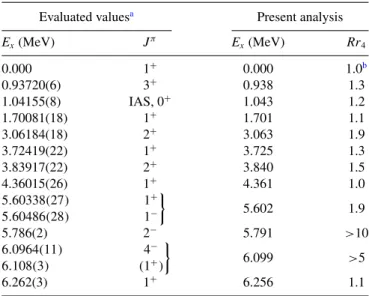
In Fig. 6, the B(GT) strength distributions are shown from (a) the present 18O(3He,t) data, those from the SM calculations using the interactions (b) the USDA [49] and (c) the USDB [49], and (d) the modified-PSDWBT [50]. The GT quenching factor is not included.
To 8 MeV, the observed fragmentation of the GT strength distribution [Fig.6(a)] was well reproduced by the modified- PSDWBT calculation [Fig. 6(d)]. This would be because the modified-PSDWBT interaction can describe multiparticle multihole states within the p-sd model space [50]. Above 8 MeV, higher level density was suggested by the calculation;
however, the level density in this region cannot be derived from the present data because of the decay widths of the observed states (see Fig.4).
Concentration of the GT strength to the 1+1 state was reproduced in all of the SM calculations. Our experiment shows that 74(1)% of the total strength is concentrated in the
18F g.s. (1+1). On the other hand, in the SM calculations using the USDA, USDB, and modified-PSDWBT interactions, 86%, 87%, and 78% of the total strength, respectively, are concen- trated in the 1+1 state.
FIG. 6. The B(GT) strength distributions from (a) the present data and the shell-model calculations using the (b) USDA [49], (c) USDB [49], and (d) modified PSDWBT [50] interactions. The ground-state strengths are divided by a factor of 5.
In order to understand the transitions to the low-lying states, we examined the SM calculations in the simple sd model space using the USDA and USDB interactions. In Fig. 7, the GT matrix elements for different components from the calculations are illustrated for the 1+1,1+2, and 1+3 states. Square of the summed value of the GT matrix elements corresponds to the B(GT). As expected from a naive SM picture, the components starting from thed5/2orbit make large contributions and those from the d3/2 are small. Relatively large contributions are found from the 2s1/2orbit.
As can be seen in Fig. 7, in the transition to the 1+1 state, the constructive contributions from the νd5/2 → πd5/2, νd5/2 → πd3/2, and ν2s1/2 → π2s1/2 components are realized. These results strongly support that this state has characteristics quite similar to the 1+1 state in42Sc [15,16].
In the transition to the 1+3 state, both the USDA and USDB calculations show strong cancellation between the νd5/2 →
FIG. 7. The Gamow-Teller matrix elements for the three low- lying 1+states obtained by the USDA (open circle) and USDB (filled circle) interactions. The corresponding B(GT) values are shown together. For details, see text.
πd5/2andνd5/2 → πd3/2 components, which makesB(GT) values small (see Fig.7). Note that the absolute values of the GT matrix elements are similar to those in the 1+1 state. These results suggest that the 1+3 state have the characteristics of an anti-LeSGT state. The 1+3 state appears at 6.6 and 7.4 MeV in the USDA and USDB results, respectively. In the present data, a few weakly excited GT states were found in this region;
however, empirical identification of the anti-LeSGT state is not clear.
As we see in Fig. 7, strong cancellation between the νd5/2 → πd5/2 andν2s1/2 → π2s1/2 components is found for the 1+2 state in both of the USDA and the USDB results.
This characteristic cancellation may suggest that the 1+2 state also has anti-LeSGT nature, like the 1+3 state.
As shown in Figs.6(b)–6(d), all the SM calculations show characteristic concentration of T =1 GT strength around Ex∼12 MeV. However, as described above and shown in Fig.6(a), we suggest that theT =1 GT strength is fragmented in theEx=10–12 MeV region.
D. QRPA calculation
For the42Ca → 42Sc case, the strong concentration of the GT strength to the 1+1 state was explained by the competi- tion of isoscalar (IS) and isovector (IV) pairing interactions [15–17]. Following theA=42 case, let us discuss here the GT strength distribution in the 18O → 18F case from the similar point of view. For this purpose, a self-consistent
FIG. 8. Strength distributions of the18O→ 18F GT transitions obtained by the HFB+QRPA calculations employing the Skyrme SGII and the surface-type pairing interaction. The IS pairing interac- tion is included in the QRPA calculations with a factorf, a ratio of the strength for the IS pairing interaction to that for the IV pairing interaction. The arrow indicates the IAS obtained atEx=5.14 MeV.
Hartree-Fock-Bogoliubov (HFB) plus QRPA calculation [51]
using the Skyrme interaction SGII [52] was performed.
First, HFB and QRPA standard calculations including the IV, T =1, pairing interaction were performed. Here the surface-type density-dependent contact interaction with a strength V0= −490 MeV fm3 was employed. Then we introduced the IS interaction between proton particle and neutron particle (πp-νp), i.e., theT =0 pairing interaction in the QRPA part of the calculation. Its strength is expressed by the factor f defined by the ratio of the strengths of the IS pairing interaction to that of the IV pairing interaction (for details, see Ref. [17]).
The obtained GT strength distribution varying the factor f is shown in Fig. 8, where the excitation energy Ex is given with respect to the ground state of the 18O nucleus.
A width of 0.5 MeV was introduced to smear the strength distributions. We see that the GT strength is mainly divided into the lower-energy (LE) and higher-energy (HE) peaks. The origin of these states can be qualitatively explained by the involvement of the two-quasiparticle (2qp) configurations of πd5/2⊗νd5/2 and πd3/2⊗νd5/2, which are formed by the νd5/2→πd5/2 and νd5/2→πd3/2 transitions, respectively.
To make discussion comparable with the other part, compo- nents of the transitions will be described in the latter form.
As shown in Fig.8, whenf =0, i.e., without the IS pairing interaction, the main part of the GT strength is in the HE peak
situated at 13.5 MeV. The LE peak at 6.8 MeV with smaller GT strength is mainly excited by aνd5/2→πd5/2 transition.
With the increase in f, the peaks move to lower energy. At the same time, the GT strength of the HE peak becomes weaker and the LE peak acquires more strength (see Fig.8).
Eventually, in the case off =1.3, the LE peak appears 1 MeV below the IAS, being consistent with theExvalues of the 1+1 (ground state) and the IAS (1.043 MeV).
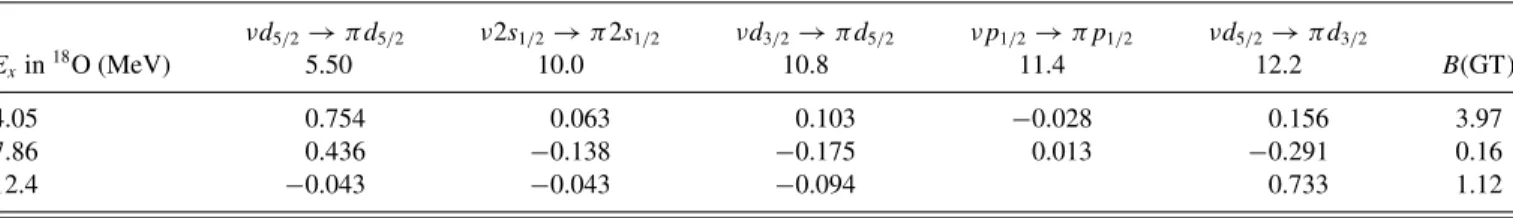
In TableV, the obtainedB(GT) values and the reduced GT matrix elements for different components with f =1.3 are summarized. The main contribution to the transition to the LE peak is theνd5/2→πd5/2 component. Furthermore, the νd5/2→πd3/2 and νd3/2 →πd5/2 components make con- structive contributions to the excitation of the LE peak. It should be noted that this result is reasonably consistent with the SM calculation. Thus, because of the strong collectivity suggested from both of the SM and QRPA calculations, we conclude that the 1+1 state in18F is LeSGT state. The present QRPA calculation suggests that this collectivity is generated by the ISπp-νp residual interaction.
With f =1.3, we see a tiny peak at 7.9 MeV (see Fig.8).
As shown in Table V, the QRPA calculation also suggests that this state is generated by the destructive contribution mainly between the νd5/2→πd5/2 and the νd5/2→πd3/2
components, suggesting the existence of the anti-LeSGT state.
The HE peak is predominantly constructed by the remain- ing νd5/2→πd3/2 component that was not absorbed in the LE peak. Since this state locates∼7 MeV higher than the IAS, the correspondingExvalue in18F is about 8 MeV. This state may correspond to the excited states around 9−12 MeV [see Fig.6(a)].
VI. SUMMARY AND CONCLUSION
We have performed high-resolution 18O(3He,t)18F mea- surements at 140 MeV/nucleon and at an angle around 0◦. Due to the high energy resolutions of 31 keV, most of the excited states in 18F are well separated. For the transition to the ground state of 18F (1+1), a strong concentration of the Gamow-Teller transition strength was found. By using the standard B(GT) value of 3.092(16) obtained from theβ decay of 18F,B(GT) values for the observed 1+ states were determined up to 12 MeV.
A total B(GT) of 4.06(5) was found and 76(1)% of the strength is concentrated to the ground state. The obtained B(GT) values were reasonably consistent with the available (p,n), (p,p), andβ-decay data.
TABLE V. ObtainedB(GT) values from the QRPA calculation applying a IS to IV strength ratio f =1.3 for the LE peak atEx= 4.05 MeV, the tiny peak at 7.86 MeV, and the HE peak at 12.4 MeV. The reduced matrix elements for each configuration are shown with the corresponding 2qp energy in MeV. Only those 2qp excitations possessing the RPA amplitude greater than 0.01 are shown. Note that the 2qp energies andExvalues are with respect to the18O ground state. For details of calculation, see text.
νd5/2→πd5/2 ν2s1/2→π2s1/2 νd3/2→πd5/2 νp1/2→πp1/2 νd5/2→πd3/2
Exin18O (MeV) 5.50 10.0 10.8 11.4 12.2 B(GT)
4.05 0.754 0.063 0.103 −0.028 0.156 3.97
7.86 0.436 −0.138 −0.175 0.013 −0.291 0.16
12.4 −0.043 −0.043 −0.094 0.733 1.12
![TABLE III. The B(GT) values obtained from the present 18 O( 3 He, t) 18 F reaction, the 18 Ne β + decay [39,47], the 18 O(p, n) reactions [19–21], and the B(M1 σ ) values from the 18 O(p , p ) reaction data [26]](https://thumb-eu.123doks.com/thumbv2/9dokorg/1077043.72326/7.884.62.824.189.544/table-values-obtained-present-reaction-reactions-values-reaction.webp)
![FIG. 6. The B(GT) strength distributions from (a) the present data and the shell-model calculations using the (b) USDA [49], (c) USDB [49], and (d) modified PSDWBT [50] interactions](https://thumb-eu.123doks.com/thumbv2/9dokorg/1077043.72326/10.884.461.818.100.538/strength-distributions-present-shell-calculations-modified-psdwbt-interactions.webp)