Making a Distinction between Schizophrenia and Bipolar Disorder Based on Temporal Parameters in Spontaneous Speech
G´abor Gosztolya
1, Anita Bagi
2,5, Szilvia Szal´oki
3,5, Istv´an Szendi
3,5, Ildik´o Hoffmann
2,4,51
MTA-SZTE Research Group on Artificial Intelligence, Szeged, Hungary
2
University of Szeged, Department of Hungarian Linguistics, Szeged, Hungary
3
University of Szeged, Department of Psychiatry, Szeged, Hungary
4
Research Institute for Linguistics, Budapest, Hungary
5
Prevention of Mental Illnesses Interdisciplinary Research Group, University of Szeged, Hungary
ggabor @ inf.u-szeged.hu
Abstract
Schizophrenia is a heterogeneous chronic and severe mental disorder. There are several different theories for the develop- ment of schizophrenia from an etiological point of view: neuro- chemical, neuroanatomical, psychological and genetic factors may also be present in the background of the disease. In this study, we examined spontaneous speech productions by patients suffering from schizophrenia (SCH) and bipolar disorder (BD).
We extracted 15 temporal parameters from the speech excerpts and used machine learning techniques for distinguishing the SCH and BD groups, their subgroups (SCH-S and SCH-Z) and subtypes (BD-I and BD-II). Our results indicated, that there is a notable difference between spontaneous speech productions of certain subgroups, while some appears to be indistinguishable for the used classification model. Firstly, SCH and BD groups were found to be different. Secondly, the results of SCH-S sub- group were distinct from BD. Thirdly, the spontaneous speech of the SCH-Z subgroup was found to be very similar to the BD- I, however, it was sharply distinct from BD-II. Our detailed exa- mination highlighted the indistinguishable subgroups and led to us to make our S and Z theory more clarified.
Index Terms: spontaneous speech, temporal parameters, schizophrenia, bipolar disorder, support vector machines
1. Introduction
According to the DSM-5 (Diagnostic and Statistical Manual of Mental Disorders, [1]), the following symptoms might repre- sent schizophrenia (SCH): (1) delusions; (2) hallucinations; (3) incoherent speech; (4) strikingly disintegrated or catatonic be- havior; and (5) negative symptoms, i.e. emotional emptiness, alogia, or lack of willingness. There are several different the- ories for the development of schizophrenia from an etiological point of view: neurochemical, neuroanatomical, psychological and genetic factors may also be present in the background of the disease. Even though numerous studies approached schizophre- nia in various ways, specific genetic, neurobiological or envi- ronmental factors have not been identified.
The spectrum theory holds promise for outlining a possi- ble endophenotype (see [2]). The presumed endophenotype concept is closely related to Crow’s theory, which explains schizophrenia on the evolutionary side: “schizophrenia is the price that homo sapiens pays for language” [3]. Crow assumed that the underlying reason for the “preservation of schizophre- nia” may be the genetic changes that cause lateralization. K´eri and Janka [4] summarize Crow’s approach as “Main aspects of the language are linked to the left temporal areas, which are
thicker in the majority of the population than the right areas.
This asymmetry in schizophrenia is often lacking, and the cor- pus callosum, which connects the two hemispheres, has also been reported to have differences compared to the brains of healthy people.” .
In this study we build on a two-subgroups-theory of SCH, specified and defined as groups S and Z by Szendi et al [5]. The theory assumes two subgroups (or clusters) of SCH, which can be differentiated mainly on executive functions and cognitive abilities, in addition to MRI-results. The subgroups were de- fined based on the results of a semantic fluency task, a visual pattern test, a Wisconsin Card Sorting Test and a backwards Corsi’s cube test. While group S includes patients with frontal dysfunction affecting both hemispheres, group Z has only left frontal dysfunction [5].
As the second main group of our study, bipolar disorder (BD) is also located on the psychosis spectrum. BD subjects generally have two distinct states: depression and mania. Fre- quency is equally around 1% in both sexes; it manifests around the age of 30 [2]. It can be classified into three types: I and II subtypes of bipolar disorder (i.e. BD-I and BD-II) and cy- clothymia. According to the duality of the disorder, depressive and manic main symptom groups could be distinguished [2, 6].
According to ICD-10 [7], one or more manic or mixed episodes are present in BD-I. The presence of a depressive episode is not necessary for a BD-I diagnosis, although the vast majority of patients with BD-I have undergone a depressive episode. The BD-II subtype is a more frequent diagnosis, usu- ally with one or more hypomanic episodes, and one or more se- vere depressive episodes. The existence of a hypomanic episode is enough to set up a BD-II diagnosis – this clause distinguishes it from unipolar depression. There is no serious manic episode in the case of BD II – and this distinguishes it from BD-I.
Both diseases were reported to manifest themselves in the subjects’ speech. Regarding SCH subjects, differences were de- tected in prosody [8], and the negative symptoms of schizophre- nia may also appear as a lack of tone and inflection [9, 10].
Several of these symptoms were analyzed by computational tools [11, 12, 13]. Prosodic abnormalities and potential charac- teristics were also examined [14, 15], and so were the continuity of speech and the quality and ratio of occlusive phenomena and pauses [16]. Other findings indicated that patients with formal thought disorder (which could be a symptom in schizophrenia) made strikingly fewer filled pauses than controls did [17].
There are notable differences in the BD subjects’ speech as well [18]. Articulatory movements of a depressed patient slow down – this is reflected by the speech rate, while in the INTERSPEECH 2020
October 25–29, 2020, Shanghai, China
case of a manic patient we see an acceleration. In addition, pro- longed recall time has also been shown for words with repressed emotional content - presumably because of inhibition [19, 20].
Increasing the duration of vowels is frequent, while speech is quiet and weak, and the prosody is poor for an anxious per- son [20]. The linguistic characteristics of bipolar disorder are also twofold due to the two groups of symptoms: both in terms of quantity and quality of speech; from the speech rate to the differences in theory of mind result [21].
In this study we examine the spontaneous speech of the speaker groups, induced by a memory task. We describe the recorded utterances by automatically extracted temporal param- eters, describing the speech rate and the amount of hesitation.
We were primarily interested in the extent of similarity of the speech of the speaker groups. Since it is far from trivial to express the similarity of agroupof attributes as a whole, we employ machine learning for this purpose. (Since classification techniques are well known for handling redundant and irrele- vant features as well, we consider them suitable for this pur- pose.) Therefore now we will not use machine learning for de- tection or screening purposes, but to measure group similarity.
2. The Data
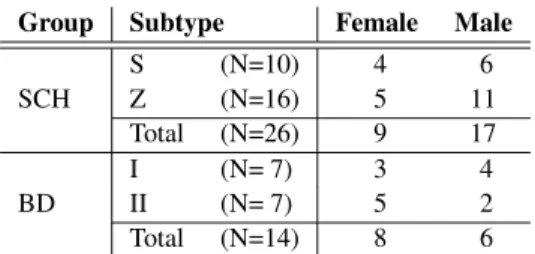
40 subjects with solid diagnoses were randomly selected from the currently available clinical research database. Diagnoses were based on DSM-5 [1], using ICD codes [7]. The group of SCH and group of BD had the following sex distribution:
Table 1:The sex distribution of the participants of our tests
Group Subtype Female Male
S (N=10) 4 6
SCH Z (N=16) 5 11
Total (N=26) 9 17
I (N= 7) 3 4
BD II (N= 7) 5 2
Total (N=14) 8 6
The number of examined speakers is rather low, but we are con- tinuously working on it to involve new subjects in our investi- gations. The utterances were recorded between February 2016 and January 2019 at the Department of Psychiatry, Faculty of Medicine, University of Szeged, Hungary. The study was ap- proved by the Ethics Committee of the University of Szeged, and it was conducted in accordance with the Declaration of Helsinki. All the speakers were native Hungarian speakers. We made the speakers perform spontaneous speech; the instruction was simply “Tell me about your previous day!”. The subjects were then given roughly five minutes to complete the task. We used a Roland R-05 type recorder to record their replies.
3. Temporal Speech Parameters
To investigate the spontaneous speech of schizophrenic and bipolar patients, we calculated specific temporal parameters from their records. We based our investigations on our previous studies [22, 23, 24, 25], where we focused on the early detection of various forms of dementia such as Alzheimer’s Disease and Mild Cognitive Impairment. To represent the verbal fluency of the speaker, we developed a temporal parameter set that mostly focuses on the amount of hesitation in the speech of the subject.
We are continuously developing this attribute set; in the cur-
(1) Articulation rate: the number of phones per sec- ond during speech (excluding hesitations).
(2) Speech tempo: the number of phones per second (including hesitations).
(3) Duration of utterance, given in milliseconds.
(4) Pause occurrence rate: divide the total number of pauses by the number of phonemes in the utterance.
(5) Pause duration rate: divide the total duration of pauses by the length of the utterance.
(6) Pause frequency: divide the number of pause oc- currences by the length of the utterance.
(7) Average pause duration: divide the total duration of pauses by the number of pauses.
Table 2: The seven examined temporal speech parameters, based on the work of Hoffmann et al. [23] and T´oth et al. [24].
rent experiments we used only normalized attributes, i.e. none of them was correlated with the length of the actual utterance (except, of course, the attributeduration of utteranceitself).
Our set of temporal parameters can be seen in Table 2. No- tice that parameters (4)–(7) all describe the amount of hesita- tion in the spontaneous speech of the subject by focusing on the number or duration of pauses in some way. The simplest form of pause issilentpause: the absence of speech for at least 30 ms [26]. However, hesitation may also manifest asfilled pauses, i.e. vocalizations like “er”, “uhm”, “eh” etc. Since both pause types indicate some sort of hesitation in spontaneous speech production, we calculate the temporal parameters (4) to (7) for silent pauses only, for filled pauses only, and for taking all pause occurrences into account regardless of type (15 tem- poral parameters overall).
Following our previous studies (e.g. [22, 24, 27]), we ap- plied Automatic Speech Recognition (ASR) techniques to ex- tract the temporal parameters. We used a speech recognizer that provides only a time-aligned phone sequence as output, treat- ing filled pause as a special ‘phoneme’. Of course, omitting the word level completely can be expected to increase the number of errors at the phoneme level as well. Luckily, though, the speech parameters in Table 2 do not require us toidentifyall the phones; in most cases we need only tocountthem, and just the two types of pauses (i.e. silent and filled) are important.
The acoustic model of this speech recognizer was trained on spontaneous speech taken from the BEA Hungarian Spoken Language Database [28], using roughly seven hours of speech data. We made sure that the occurrences of filled pauses, breath intakes and exhales, laughter, coughs and gasps were present in the phoneme-level transcriptions in a consistent manner. For acoustic modelling we applied a standard Deep Neural Network (DNN) with feed-forward topology. The DNN had 3 hidden layers each with 1000 ReLU neurons, and it had softmax neu- rons in the output layer. As a language model, we employed a simple phoneme bigram (including all the above-mentioned non-verbal audio tags). The output of the ASR system is the phonetic segmentation and labeling of the input signal (includ- ing filled pauses); based on this output, the temporal speech pa- rameters of Table 2 can be extracted in a straightforward way.
4. Experimental Setup
This study focuses on the speech production of schizophrenic and bipolar subjects. We were interested in the similarities and differences of the spontaneous speech of the different groups and subgroups. Our assumption was that similarly speaking groups will be less distinguishable by machine learning; and to this end, we performed several pair-wise (i.e. binary) classi- fications. Next, we will describe the technical details of these classification experiments.
4.1. The Classification Process
We basically followed standard biomedical practices, simi- larly to our earlier studies that focused on detecting MCI (i.e. [22, 24]) and distinguishing schizophrenic subjects and healthy controls [27]. Using the above-listed temporal parame- ters, we trained a Support-Vector Machine (SVM, [29]), using the LibSVM [30] library. We used the nu-SVM method with a linear kernel; the value ofCwas tested in the range10{−5,...,1}. From a machine learning perspective, we had an extremely small dataset, but the number of diagnosed patients is very lim- ited, especially if we also consider the further split of our gen- eral diagnoses (i.e. the S and Z clusters of the schizophrenic subjects, and the I and II subtypes of bipolar disorder). Having so few examples, we applied the common solution of speaker- wise cross validation (CV): we always withheld the data of one speaker from classifier training, and evaluated the result- ing SVM model only for this withheld speaker. To perfectly balance the class distribution during training for all the possible subject group pairs, we also employed upsampling (i.e. repeat- ing training examples of rarer classes) during SVM training.
4.2. Evaluation Metrics
Although relying on simple classification accuracy is still com- mon in biomedical studies (see e.g. [31, 32]), the frequency of the different speaker types is imbalanced in the population (e.g.
only 1-1.5% of the population are affected by schizophrenia).
Such an imbalanced class distribution requires other evaluation metrics as well. However, since we performed many pair-wise binary classifications, we had no clear positive class, which rules out otherwise straightforward information retrieval met- rics like precision, recall and F-measure. Therefore, besides classification accuracy, we calculated the Unweighted Average Recall metric (UAR [33], it being the mean of the recall values for all the classes) and the Area-Under-the-Curve (AUC) value as well.
4.3. Data Preprocessing
In our experiments we could use only one recording from only 40 speakers, and sometimes we even used only a subset of them (e.g. only 7 subjects had BD-I). To increase the size of our dataset, we decided to utilize shorter utterance parts in our ex- periments. Our hypothesis, justified by our previous experi- ments (see [27]) was that the temporal speech parameters re- main indicative even when they are calculated from relatively short utterances. With this in mind, we split our utterances into 30 second-long segments with a 5-second overlap (regardless of the actual phonetic boundaries), and treated these examples independently. After this step, we ended up with 222 small, equal-sized segments, significantly increasing our SVM train- ing set sizes. Of course, we still used the leave-one-speaker-out cross-validation scheme; that is, one fold always consisted of all the speech segments of one speaker.
5. Results
In our first experiment we were interested in two things: firstly, how much the speech of the two speaker groups (i.e. SCH and BD speakers) differ, and secondly, how well we can differenti- ate between the subgroups/subtypes of each disorder.
Table 3: The accuracy, UAR and AUC scores obtained when separating the schizophrenic (SCH) and bipolar (BD) speaker groups, and for separating the subtypes of the two groups.
Accuracy(%)
Subject Groups Acc. UAR AUC
SCH (all) vs. BD (all) 81.1 82.9 0.870
SCH-S vs. SCH-Z 61.0 61.9 0.634
BD-I vs. BD-II 58.6 58.2 0.488
According to the accuracy, UAR and AUC scores we obtained (see Table 3 above), the speech of the bipolar and schizophrenic subjects differed to a great extent in the speech parameters ex- amined. Both accuracy and UAR appeared to be above 80%, and the 0.870 Area-Under-Curve score is also quite high. How- ever, it was hard to find any difference between the speech of the subjects belonging to different subgroups: the accuracy and UAR scores appeared to be around 60% in both cases, while we actually got an AUC score below 0.5 when we trained our SVM models to separate BD-I and BD-II. This suggests that both disorders appear to be quite homogenous, at least when we examine the spontaneous speech of the subjects using articula- tion tempo, speech rate and our pause-related attributes.
Next, we will examine how well the subgroups can be sep- arated from the other speaker group.
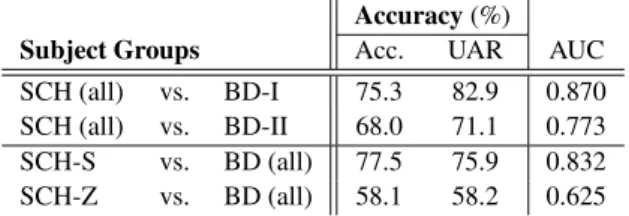
Table 4: The accuracy, UAR and AUC scores obtained when separating the different subgroups from the other group
Accuracy(%)
Subject Groups Acc. UAR AUC
SCH (all) vs. BD-I 75.3 82.9 0.870 SCH (all) vs. BD-II 68.0 71.1 0.773 SCH-S vs. BD (all) 77.5 75.9 0.832 SCH-Z vs. BD (all) 58.1 58.2 0.625 According to the accuracy, UAR and AUC scores (see Table 4 above), there was no significant difference found between the spontaneous speech of the subjects belonging to the two bipo- lar subtypes. That is, the accuracy scores were quite similar (68-75%), and we got high UAR and AUC values for both cases. Nevertheless, when we tried to identify whether the ac- tual speaker belonged to some of the subgroups of schizophre- nia (i.e. S or Z) or he was suffering from a bipolar disorder, we got quite different results. The S cluster of the SCH group proved to be well separable from the BD class (classification accuracy scores of 75-77% and an AUC value of 0.832), but for the Z cluster we got fairly low scores. This, in our opin- ion, indicates that the spontaneous speech of the S and Z cluster members differ, regardless of the accuracy scores around 61%
obtained when we tried to separate them. Since we got lower classification scores for the case of the Z cluster, this SCH sub- group appears to be more similar to the bipolar group than the S cluster.
Next, we will experiment with differentiating among the members of the different clusters.
Table 5: The accuracy, UAR and AUC scores obtained when separating the different subgroups
Accuracy(%)
Subject Groups Acc. UAR AUC
SCH-S vs. BD-I 72.2 72.6 0.754
SCH-S vs. BD-II 70.5 70.1 0.810
SCH-Z vs. BD-I 53.3 50.0 0.462
SCH-Z vs. BD-II 88.6 90.6 1.000
Examining the accuracy, UAR and AUC scores (see Table 5 above) got when one of the tested classes was the S cluster of the SCH category, we had quite similar results: the accuracy and UAR scores were around 70-72% regardless of whether we had the BD-I or the BD-II subtype as the second speaker group;
and there was no big difference in the AUC values either (0.754 and 0.810). These values are also very similar to those when we tried to distinguish between the speech of the SCH S subjects from all bipolar subjects (see the second row of Table 4).
However, when we focused on the Z cluster of the SCH group, we got very different results. Our classifier models could not distinguish the speech of these schizophrenic patients from the speech of subjects belonging to the Bipolar-I subtype at all:
the 50% UAR value is just the one we would get with ran- dom guessing, and the AUC score is actually below 0.5 (0.462).
Despite this, our SVM model was able to precisely identify the difference between the schizophrenic Z and the BD-II sub- groups, which indicates that the spontaneous speech of these two speaker groups differed to a great extent.
Overall, we found that, at first glance, the speech of the schizophrenic and the bipolar subjects differ to a large extent, while the subgroups/subtypes of the two diseases seemed to be very similar (UAR values around 60%). However, comparing the spontaneous speech of subjects of the SCH subgroups with that of BD-I, BD-II or all bipolar speakers, they were found to be quite different. The SCH S group could be distinguished from the two BD subtypes with a rate of 70%, while the mem- bers of the SCH-Z cluster spoke much like the BD-I speakers (UAR score of 50%) and very differently than the BD-II sub- jects (90.6% UAR). This, in our opinion, supports the existence of the S and Z clusters within schizophrenia. (These subgroups were not defined by temporal speech parameters.)
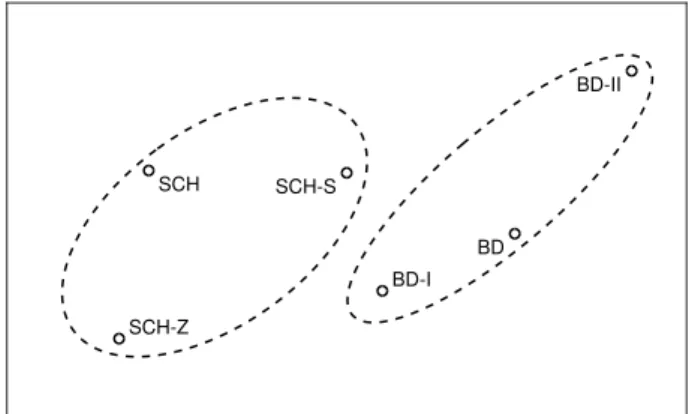
Lastly, we tried to map the different subject groups / sub- groups / subtypes into a two-dimensional space. For this, we defined pair-wise distances based on the UAR scores of the clas- sification experiments, using the following formula:
d(X, Y) =−
1
log (2·max (U AR(X, Y)−0.5,0)). (1) This formula (with the straightforward generalization that∞1 = 0andlog 1 =−0) maps a pair-wise UAR score of 50% (i.e.
0.5) to a distance value of 0, and a high UAR score to a high distance value. The representation of the subgroups and sub- types were determined by minimizing the mean squared error of the expected and the measured Euclidean distances.
Fig. 1 shows the resulting mapping. According to this rep- resentation, schizophrenia is located close to its subgroups, and so is bipolar disorder related to its subtypes (see the dashed ellipses). Furthermore, the SCH-S and SCH-Z subgroups are quite far away from each other, and so are the BD-I and BD-II subtypes. The two farthest groups are the SCH-Z and the BD- II subtypes, which is understandable as for this speaker group
SCH SCH-S
SCH-Z
BD BD-I
BD-II
Figure 1: Two-dimensional mapping of the subject groups, based on the UAR scores obtained in pair-wise classification.
pair we obtained an UAR score of 90.6%. Of course, not all relations could be mapped to just two dimensions; for example, the distance of the two bipolar subtypes should be roughly the same from the SCH-S cluster, while now BD-II is noticeably farther. Using data from more speakers could help make this representation more accurate, which is one of our plans.
6. Conclusions
In this study, we focused on the similarities and dissimilarities of spontaneous speech produced by schizophrenic and bipolar subjects. To this end, we extracted 15 temporal parameters from the spontaneous speech of 40 subjects, and performed binary classification experiments. We assumed that groups/subgroups with similarly-speaking members would result in a low classifi- cation performance, while large speech differences would allow high-precision discrimination between the speaker groups.
Our experimental results indicate that the two patient groups (SCH and BD) speak quite differently, while subjects belonging to the SCH subgroups (S and Z) produced similar speech, and so did the speakers of the two BD subtypes exam- ined (I and II). Of course, ‘similar’ only means that their inves- tigated temporal parameters displayed similar patterns, while their speech can (and do) differ at the semantic or at the prag- matic level. Comparing the SCH subgroups and the BD sub- types, however, the spontaneous speech of SCH-Z subjects was found to be very similar to those of BD-I patients, while it was remarkably different from that of BD-II speakers.
In the near future we plan to validate our experiments on a larger number of subjects and with different speech tasks, and we would also like to examine which temporal parameters con- tribute the largest to the observed differences. Nevertheless, the findings expressed in this study (related to spontaneous speech parameters and the relation of different speaker groups) allow us to make our S and Z theory more clarified.
7. Acknowledgements
This research was supported by the EU-funded Hungarian grant EFOP-3.6.1-16-2016-00008. G. Gosztolya was funded by the Ministry for Innovation and Technology, Hungary (TUDFO/47138-1/2019-ITM and New National Excellence Program ´UNKP-20-5), by the National Research, Development and Innovation Office (NKFIH FK-124413), and by the J´anos Bolyai Scholarship of the Hungarian Academy of Sciences.
8. References
[1] American Psychiatric Association,Diagnostic and statistic man- ual of mental disorders (DSM-5). American Psychiatric Publish- ing, 2013.
[2] L. Tringer, The Textbook of Psychiatry. Budapest, Hungary:
Semmelweis, 2010.
[3] T. J. Crow, “Schizophrenia as the price that homo sapiens pays for language: a resolution of the central paradox in the origin of the species.”Brain Research Reviews, vol. 31, no. 2–3, pp. 118–129, 2000.
[4] S. K´eri and Z. Janka, “The disconnection disorders of schizophre- nia,” inKognit´ıv idegtudom´any. Budapest, Hungary: Osiris, 2003, pp. 724–737.
[5] I. Szendi, M. Racsm´any, C. Cimmer, G. Csifcs´ak, Z. A. Kov´acs, G. Szekeres, G. Galsi, F. T ´oth, A. Nagy, A. E. Garab, K. Boda, G. Cs´ef´an, J. G. Kiss, J. Dombi, C. Pl´eh, and Z. Janka, “Two sub- groups of schizophrenia identified by systematic cognitive neu- ropsychiatric mapping,” European Archives of Psychiatry and Clinical Neuroscience, vol. 260, pp. 257–266, 2010.
[6] A. M. Nussbaum, The Pocket Guide to the DSM-5 Diagnostic Exam. United States: American Psychiatric Publishing, 2013.
[7] World Health Organization, ICD-10: International Statistical Classification of Diseases and Related Health Problems, 2004.
[8] A. Nagels and T. Kircher, “Symptoms and neurobiological mod- els of language in schizophrenia,” inNeurobiology of Language, G. Hickok and S. Small, Eds. Academic Press, 2016, pp. 887–
897.
[9] M. A. Covington, H. Congzhou, C. Brown, L. Nac¸i, J. T. Mc- Clain, B. S. Fjordbak, J. Semple, and J. Brown, “Schizophrenia and the structure of language: The linguist’s view,”Schizophrenia Research, vol. 77, no. 1, pp. 85–98, 2005.
[10] V. Rapcan, S. D’Arcy, S. Yeap, N. Afzal, J. H. Thakore, and R. B.
Reilly, “Acoustic and temporal analysis of speech: A potential biomarker for schizophrenia,”Medical Engineering & Physics, vol. 32, no. 9, pp. 1074–1079, 2010.
[11] M. Rosenstein, C. Diaz-Asper, P. W. Foltz, and B. Elvevag, “A computational language approach to modeling prose recall in schizophrenia,”Cortex, vol. 55, no. Jun, pp. 148–166, 2014.
[12] C. M. Corcoran, F. Carrillo, D. Fern´andez-Slezak, G. Bedi, C. Klim, D. C. Javitt, C. E. Bearden, and G. A. Cecchi, “Pre- diction of psychosis across protocols and risk cohorts using au- tomated language analysis,”World Psychiatry, vol. 17, no. 1, pp.
67–75, 2018.
[13] Z. Pan, C. Gui, J. Zhang, J. Zhu, and D. Cui, “Detecting manic state of bipolar disorder based on Support Vector Machine and Gaussian Mixture Model using spontaneous speech,”Psychiatry Investigation, vol. 15, no. 7, pp. 695–700, 2018.
[14] J. S. Bedwell, A. S. Cohen, B. J. Trachik, A. E. Deptula, and J. C. Mitchell, “Speech prosody abnormalities and specific dimen- sional schizotypy features: Are relationships limited to males?”
The Journal of Nervous and Mental Disease, vol. 202, no. 10, pp.
745–751, 2014.
[15] F. Mart´ınez-S´anchez, J. A. Muela-Mart´ınez, P. Cort´es-Soto, J. J. G. Meil´an, J. A. V. Ferr´andiz, A. E. Caparr´os, and I. M. P.
Valverde, “Can the acoustic analysis of expressive prosody dis- criminate schizophrenia?” The Spanish Journal of Psychology, vol. 18, no. 86, pp. 1–9, 2015.
[16] M. Alpert, A. Kotsaftis, and E. R. Pouget, “At issue: Speech flu- ency and schizophrenic negative signs,”Schizophrenia Bulletin, vol. 23, no. 2, pp. 171–177, 1997.
[17] K. Matsumoto, T. T. J. Kircher, P. R. A. Stokes, M. J. Brammer, P. F. Liddle, and P. K. McGuire, “Frequency and neural correlates of pauses in patients with formal thought disorder,”Frontiers in Psychiatry, vol. 4, no. Oct, pp. 67–75, 2013.
[18] D. Raucher-Ch´en´e, A. M. Achim, A. Kaladjian, and C. Besche- Richard, “Verbal fluency in bipolar disorders: A systematic re- view and meta-analysis,”Journal of Affective Disorders, vol. 207, no. 1, pp. 359–366, 2017.
[19] A. G ˝osi-Greguss, E. I. B´anyai, E. J ´ozsa, G. Suhai-Hod´asz, and K. Varga, “Voice analysis of hypnotists,”Grazer Linguistiche Stu- dien, vol. 62, no. 1, pp. 27–37, 2004.
[20] M. G ´osy, Pszicholingvisztika [Psycholinguistics]. Budapest, Hungary: Osiris, 2005.
[21] M. Simon, E. Varga, A. Hajnal, Z. Schnell, T. T´enyi, and S. Fekete, “Theory of mind deficits in euthymic patients with bipolar I disorder. Theoretical background and guidelines for neu- roimaging research,” Psychiatria Hungarica, vol. 26, no. 3, pp.
178–187, 2011.
[22] L. T ´oth, G. Gosztolya, V. Vincze, I. Hoffmann, G. Szatl´oczki, E. Bir´o, F. Zsura, M. P´ak´aski, and J. K´alm´an, “Automatic detec- tion of mild cognitive impairment from spontaneous speech us- ing ASR,” inProceedings of Interspeech, Dresden, Germany, Sep 2015, pp. 2694–2698.
[23] I. Hoffmann, L. T ´oth, G. Gosztolya, G. Szatl´oczki, V. Vincze, E. K´arp´ati, M. P´ak´aski, and J. K´alm´an, “Besz´edfelismer´es alap´u elj´ar´as az enyhe kognit´ıv zavar automatikus felismer´es´ere spont´an besz´ed alapj´an (in Hungarian),” Altal´anos nyelv´eszeti´ tanulm´anyok, vol. 29, pp. 385–405, 2017.
[24] L. T ´oth, I. Hoffmann, G. Gosztolya, V. Vincze, G. Szatl´oczki, Z. B´anr´eti, M. P´ak´aski, and J. K´alm´an, “A speech recognition- based solution for the automatic detection of mild cognitive im- pairment from spontaneous speech,”Current Alzheimer Research, vol. 15, no. 2, pp. 130–138, 2018.
[25] G. Gosztolya, V. Vincze, L. T ´oth, M. P´ak´aski, J. K´alm´an, and I. Hoffmann, “Identifying Mild Cognitive Impairment and mild Alzheimer’s disease based on spontaneous speech using ASR and linguistic features,”Computer, Speech & Language, vol. 53, no.
Jan, pp. 181–197, 2019.
[26] M. G ´osy, “The paradox of speech planning and production,”Mag- yar Nyelv˝or, vol. 12, no. 1, pp. 3–15, 1998.
[27] G. Gosztolya, A. Bagi, S. Szal´oki, I. Szendi, and I. Hoffmann,
“Identifying schizophrenia based on temporal parameters in spon- taneous speech,” inProceedings of Interspeech, Hyderabad, India, Sep 2018, pp. 3408–3412.
[28] M. G ´osy, “BEA a multifunctional Hungarian spoken language database,”The Phonetician, vol. 105, no. 106, pp. 50–61, 2012.
[29] B. Sch¨olkopf, J. C. Platt, J. Shawe-Taylor, A. J. Smola, and R. C.
Williamson, “Estimating the support of a high-dimensional dis- tribution,” Neural Computation, vol. 13, no. 7, pp. 1443–1471, 2001.
[30] C.-C. Chang and C.-J. Lin, “LIBSVM: A library for support vector machines,”ACM Transactions on Intelligent Systems and Technology, vol. 2, pp. 1–27, 2011.
[31] K. L. de Ipi˜na, J. B. Alonso, J. Sol´e-Casals, N. Barroso, P. Hen- riquez, M. Faundez-Zanuy, C. M. Travieso, M. Ecay-Torres, P. Mart´ınez-Lage, and H. Eguiraun, “On automatic diagnosis of Alzheimer’s disease based on spontaneous speech analysis and emotional temperature,”Cognitive Computation, vol. 7, no. 1, pp.
44–55, 2015.
[32] P. Garrard, V. Rentoumi, B. Gesierich, B. Miller, and M. L.
Gorno-Tempini, “Machine learning approaches to diagnosis and laterality effects in semantic dementia discourse,”Cortex, vol. 55, pp. 122–129, 2014.
[33] B. Schuller, S. Steidl, and A. Batliner, “The INTERSPEECH 2009 emotion challenge,” in Proceedings of Interspeech, Brighton, United Kingdom, Sep 2009, pp. 312–315.