26th International Symposium on Analytical and Environmental Problems
205
DETECTION OF THE EFFICIENCY OF ENZYMATIC AND FERMENTATION PROCESSES BY DIELECTRIC MEASUREMENT
Tamás Kovács1, Cecília Hodúr1, Zoltán Jákói1, Sándor Beszédes1
1 Department of Process Engineering, University of Szeged, H-6725 Szeged, Moszkvai krt. 9, Hungary
e-mail: kovacstomi16@gmail.com
Abstract
In my work I wanted to investigate, whether measuring dielectric parameters is a proper method to detect the changes during enzymatic hydrolysis and fermentation processes. Besides I wanted to investigate, how the different types of microwaves pre-treatments affected the amount of produced RS content. The results shows that measuring the dielectric constant (ε’) is rapid and easy method to detect the changes during enzymatic and fermentation processes. As for the microwave pre-treatment, more reducing sugar were produced with 500 W 1 minute, but the rate of the hydrolysis was higher during 250 W 2 minutes treatment.
Introduction
In the last few decades the importance of using renewable energy sources is increasing. One of the most important source is biomass, because it can be utilized in many ways. One of them are the different types of biofuels, such as bioethanol and biodiesel. Bioethanol can be made of different types of plants, with high carbohydrate contents, for example corn. [1] In my work I used a type of corn cob, which has high cellulose content. The problem with cellulose is that yeasts cannot utilize that. To solve that problem, it has to be degraded in enzymatic hydrolysis.
After that, there are lots of glucose molecules that can be utilized by yeasts, so they can produce ethanol during their fermentation.
Experimental
The material with high cellulose content from corn cob was Cobex EU-GRITS. For the enzymatic degradation I used Cellic Ctec2 enzyme blend. The reducing sugar content of samples were measured by spectrophotometric reducing sugar assay (DNSA method). For the microwave pre-treatments Labotron 500 professional equipment operated at a frequency of 2450 MHz with two power level (250 W and 500W) was used in continuous irradiation operation mode. For dielectric measurement a DAK-3.5 (SPEAG, Switzerland) dielectric probe connected to ZVL3 (Rohde&Schwarz, Germany) type Vector Network Analyzer was used in a frequency range of 200 MHz to 2400 MHz.
Results and discussion
In the first parts of the work, I measured the dielectric parameters (dielectric constant and dielectric loss factor) during the enzymatic hydrolysis of grits (GM16). Since the suspension is an aqueous medium, its dielectric behaviour is similar to how water behaves in electromagnetic field.
26th International Symposium on Analytical and Environmental Problems
206
Figure 1. Correlation between dielectric constant and frequency
As Fig.1 shows the dielectric constant is decreased with increasing frequencies. This happened, because the dipoles are not able to follow up the rapid variation of the applied electromagnetic field. [2] The dielectric loss factor is increased with increasing frequencies. The results showed that the dielectric loss factor measured in consecutive days at a given frequency cannot be told apart. As for the dielectric constants of consecutive days at given frequency can be told apart, especially in the frequency range 200 MHz-800 MHz and 2200 MHz-2400 MHz.
Measuring of dielectric constant to detect changes was also effective during fermentation processes.
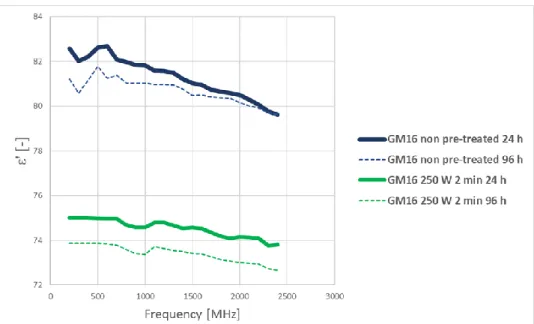
Figure 2. Change of the dielectric constant values of two different types of samples during fermentation process
The result showed that dielectric constant decreased as time progressed (Fig.2). It is because the concentration of ethanol increasing as time progresses, and ethanol’s dielectric constant is less, than water’s. [3] The dielectric constant values measured in the non-pre-treated samples were higher, than in the samples, which was pre-treated with microwave. This happened, because in the pre-treated samples more reducing sugar were produced because of the treatment,
26th International Symposium on Analytical and Environmental Problems
207
and there were more fermentable sugar, so more ethanol have been produced by yeasts. It also can be seen that the dielectric constant is decreasing with increasing frequencies. Since these suspensions are also aqueous mediums, their dielectric behaviour is very similar to water’s dielectric behaviour.
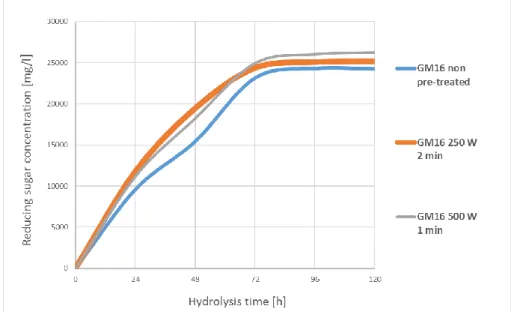
As for the microwave pre-treatment, the results show that more reducing sugar were produced with 500 W 1 minute, but the rate of the hydrolysis was higher during the beginning of 250 W 2 minutes treatment (Fig.3). The reason behind this is simple, the higher power altered the cellulose-hemicellulose system more than the 250 W 2 minutes pre-treatment, so the samples could have been hydrolysed more by the enzyme.
Figure 3. Glucose yields after different types of microwave pre-treatments
Conclusion
My results verified that measuring dielectric parameters (especially dielectric constant) is a proper and easy way to detect the chemical change of the biomass during enzymatic and fermentation processes. The results also verified that more reducing sugar were produced with high power short time microwave pre-treatment, but the rate of the hydrolysis was higher during the beginning of 250 W 2 minutes treatment.
Acknowledgements
The authors are grateful for the financial support provided by the projects EFOP-3.6.2- 16- 2017- 00010 – RING 2017; and National Office for Research, Development and Innovation - NKFIH, K115691.
References
[1] Balat M., Balat H., Öz C. (2008): Progress in bioethanol processing, Progress in Energy and Combustion Science 34 551–573
[2] Onimisi M. Y.; Ikyumbur J. T. (2015): Computation of dielectric constant and loss factor of water and dimethylsulphoxide from 0.1 to 13 GHz, Scientific Review, Vol. 1, No. 4, pp: 79- 85
[3] https://depts.washington.edu/eooptic/linkfiles/dielectric_chart%5B1%5D.pdf