TRANSFER OF EGG WHITE PROTEINS AND ACTIVATION OF PROTEASES DURING THE DEVELOPMENT OF ANAS PLATYRHYNCHOS
DOMESTICA EMBRYO
Seba Jamal Shbailat * and Razan ataallah abuassaf Department of Biology and Biotechnology, The Hashemite University,
P.O. Box 330127, Zarqa 13133, Jordan
(Received: October 12, 2017; accepted: December 8, 2017)
The route of egg white transfer into the yolk and the mechanisms underlying the digestion of egg proteins are unexplored in the fertilized egg of the duck, Anas platyrhynchos domestica. Here, we investigated the route(s) of egg white transfer and we determined the type of activated proteases during duck embryo development. Initially, we tested the electrophoretic patterns of egg proteins throughout development.
Then, we used lysozyme as a reference protein to follow egg white transfer and we measured its activity.
After that, we determined the type of activated proteases by employing different types of protease inhibitors. Several presumptive egg white protein bands appeared in different egg compartments. Also, lysozyme activity was detected chronologically on day 15 in the extraembryonic fluid, on day 17 in the amniotic and intestinal fluids and on day 19 in the yolk. Furthermore, acidic aspartic proteases seemed to be activated at hatch in the intestine and late in development in the yolk. Our results suggest that the main route of egg white transfer into the yolk is through the amniotic cavity and intestinal lumen. Also, the transferred egg white and endogenous yolk proteins are probably digested by the activated acidic pro- teases in the intestine and yolk.
Keywords: Anas platyrhynchos domestica – egg white – egg yolk – lysozyme – proteases
INTRODUCTION
Birds are oviparous and produce large eggs containing all the essential nutrients required for the embryo development in an external environment. The egg white and yolk are the main sources of nutrients in the deposited egg. The egg white is made of nearly 88% water, 11% proteins and the rest (1%) of carbohydrate, ash and trace amounts of lipids [31]. Ovalbumin is the major egg white protein followed by ovotransferrin and ovomucoid. Among the other constituents of the egg white pro- teins are ovomucin, lysozyme, ovoinhibitor, ovomacroglobulin, cystatin and avidin [12]. Lysozyme protects the developing embryo from the microbial invasion [12], because it has a bacteriolytic activity that hydrolyzes the β (1–4) linkage between N-acetylmuramic acid and N-acetylglucosamine of peptidoglycan in the bacterial cell walls [20]. This activity can be used to follow the transfer of lysozyme, as a reference
* Corresponding author; e-mail address: seba.shbailat@hu.edu.jo
egg white protein, in different egg fractions during different developmental stages.
The egg yolk is composed of approximately 50% water, 15–17% proteins, 31–35%
lipids and 1% carbohydrates [31].
The egg white proteins generally reach the yolk before being consumed by the developing embryo [3, 5, 19, 22, 25, 26, 32, 33]. Several routes have been suggested to describe the transfer of egg white in different egg compartments during embryo- genesis. One possible route is the movement of egg white through the albumen sac into the extraembryonic cavity, and then through the amniotic sac into the amniotic cavity. Following that, the egg white passes orally to the intestinal lumen of the embryo which carries it to the egg yolk [3, 5, 22, 27, 32]. Another route is the direct transfer of egg white into the yolk through the yolk sac umbilicus [25, 26].
Alternatively, the egg white can reach the entire body via blood vessels at the extraembryonic cavity [32].
The transferred egg white and endogenous yolk proteins undergo digestion before their absorption by the avian embryo. It appears that both the intestine and egg yolk participate in protein digestion. Inside the intestine, protein digestion can be carried out by the action of intestinal or pancreatic proteases. The activity of both types of enzymes was reported in the intestinal and pancreatic cells of chicken and pigeon. In chicken, the activity of the brush border aminopeptidase [29] as well as the pancre- atic carboxypeptidase and chymotrypsin [14] started to increase after day 18. The maximum activity of aminopeptidase was on the day of hatch [29], while the largest activity of pancreatic enzymes was one day after hatch [14]. In pigeon, the activity of aminopeptidase-N and pancreatic trypsinogen and chymotrypsinogen followed simi- lar pattern [6]. The activity of the three enzymes increased significantly from the day of hatch until post hatch day 3; however, it was slightly changed after that [6].
The activity of different types of proteases was determined in the egg yolk of various avian species. In chicken egg yolk, the activity of the acidic aspartic protease cathepsin D increased gradually at early stages until it reached the maximum value on day 7, and reduced thereafter [30]. In contrast, the activity of neutral proteases and trypsin and chymotrypsin like serine proteases increased significantly after day 14 [25]. This increase was shortly after the major transfer of egg white through the amni- otic cavity and intestinal lumen into the yolk which started on day 14 [5]. In turkey, the activity of acidic aspartic proteases in the egg yolk was high on incubation day 19 and afterwards [21], following the major transfer of egg white which began on day 17 [22]. On the other hand, in quail egg yolk, the activity of the acidic aspartic pro- tease cathepsin D was high in the period between days 6 and 12 before the major transfer of egg white through the embryo into the yolk that occurred after day 12 [32, 33].
Although the transfer of egg white during development is well studied in the chicken Gallus gallus [3, 5, 26], the quail Coturnix japonica [32] and the turkey, Meleagris gallopavo [22] that belong to Galliformes order [34], the transfer is still unexplored in the species that belong to the sister taxon, the Anseriformes order [34].
Therefore, in the present study, we used the duck, Anas platyrhynchos domestica, as a representative species of Anseriformes, and we examined the route of egg white
transfer through the extraembryonic and amniotic cavities into the intestinal lumen, and then to the yolk. Furthermore, the digestion of egg proteins during the develop- ment of duck embryo is, to the best of our knowledge, still unknown. Therefore, we determined the type of activated proteases in the intestinal lumen of the embryo and egg yolk.
MATERIALS AND METHODS Egg incubation and embryo staging
Fertilized duck eggs were collected immediately after laying and were kept in a bird incubator at 38.5 ± 0.5 °C and relative humidity of 65%. The total number of eggs that were incubated was 174 (six eggs per stage including the day of hatch), however, the viable eggs that reached the stages of interest were 105 (four to three eggs per stage).
The eggs were subjected to an automatic see-saw motion every 2 h. The developmen- tal stages of the embryos were measured from day 0 to day 28, the day of hatch. The study was approved by the Institutional Review Board (IRB) at The Hashemite University, and animal care, use, and all experimental protocols were carried out in accordance with the approved guidelines.
Formation, collection and preparation of different egg fractions
The eggs were opened at their blunt ends at each developmental stage. All egg fluids in the fertilized duck egg (Fig. 1) were collected once they appeared until they disap- peared based on the methods published by Shbailat and Safi [22]. The egg white was gathered on day 0 until day 25. After that, the egg white disappeared as it completely moved to other egg compartments. During the period between days 4 to 13, water flowed from egg white into the upper portion of yolk under the embryonic growth to form the thin yolk which was collected at this period. The thin yolk (also known as sub-embryonic fluid) was assumed to be distributed into the growing embryonic and extraembryonic tissues by the blood system [2]. The underlying thick portion of yolk was gathered throughout development and on the day of hatch. The other fluid frac- tions were formed in the egg as development progressed. One fraction is the amni- otic fluid that was suggested to originate from secretions of the amniotic wall or transudates from the blood vessels of area pellucida [18]. It was collected during the period between days 5 and 24 from the amniotic sac. Another fraction is the extraem- bryonic fluid that might result from excretions of the membranes or blood vessels around the extraembryonic cavity. It was gathered on day 14 until day 16 from the cavity around the amniotic sac. The allantoic fluid, which is formed by excretions from embryonic kidney and at later stages contains or is mainly composed of waste solid material [2], appeared between days 8 and 27. It was initially collected from the allantois, and then from the cavity surrounded by the chorio-allantoic membranes. Its
collection was necessary to prevent the contamination of the underlying fluids.
Finally, the embryo was dissected and intestinal fluid was collected from the intestinal lumen on day 14 until day 24.
The intestinal fluid, egg yolk and egg white fractions were further processed for use in biochemical analysis [22, 32]. The intestinal fluid was centrifuged at 14000 rpm for 30 sec and the supernatant was collected. The thin and thick yolk portions were diluted with five volumes of 0.87% sodium chloride (NaCl) solution containing 1 mM ethylenediaminetetraacetic acid-disodium, dihydrate (Na2EDTA∙2H2O). Then, the samples were homogenized and the homogenate was centrifuged at 6000 rpm for 30 min at 4 °C. After that, the supernatant was dialyzed against distilled water for 2 h. The dialyzed solution was then centrifuged twice at 6000 rpm for 30 min at 4 °C and the supernatant was collected each time. The egg white was diluted with five volumes of distilled water. The diluted samples were homogenized, centrifuged at 6000 rpm for 30 min at 4 °C, and then the supernatant was collected.
Denaturing polyacrylamide gel electrophoresis
The different proteins in different egg compartments were separated by sodium dode- cyl sulfate (SDS) polyacrylamide gel electrophoresis based on the protocol in Laemmli [13] with slight modifications using 10% separation gels. In order to deter- mine the optimum pH for the activated proteases, the intestinal fluid and egg yolk samples were further processed. The samples (60 μg each) were diluted (1:1) with 0.1 M citric acid–0.2 M dibasic sodium phosphate buffer at different pH (3–7), and then
Fig. 1. Schematic representation of different compartments in the fertilized duck egg. (1) The egg white is surrounded by (2) albumen sac. (3) The extraembryonic cavity around (4) the amniotic sac which contains (5) the amniotic fluid. (6) The intestinal lumen of the embryo is connected through (7) the vitello-intestinal duct with (8) the yolk sac membrane that surrounds (9) the egg yolk. (10) The chorio- allantoic membrane, which encompasses the cavity that contains (11) the allantoic fluid, is connected with the embryo through (12) the urachus. The egg components are enclosed by (13) the inner and (14) the outer shell membranes which are separated at the blunt end of the egg by (15) the air sac. (16) The egg
shell is deposited around the egg shell membranes
incubated at 37 °C for 24 hr before loading in the gel [21, 32]. To test for the inhibi- tion of protease activity, the intestinal fluid and egg yolk samples (60 μg each) were diluted (1:1) with 0.1 M citric acid–0.2 M dibasic sodium phosphate buffer (pH 3) mixed with a protease inhibitor at a final concentration of 0.4 mg/mL [21, 32]. The mixture was incubated at 37 °C for 24 h before loading in the gel. The inhibitors used were phenylmethylsulfonyl fluoride (PMSF; Bio Basic, Markham, Ontario, Canada), trypsin inhibitor (Sigma-Aldrich, Saint Louis, Missouri, USA), aprotinin (Bioworld, Dublin, Ohio, USA), dithiothreitol (DTT; Bioworld, Dublin, Ohio, USA), N-[N-(L- 3-trans-carboxirane-2-carbonyl)-L-leucyl]-agmatine (E-64; Bioworld, Dublin, Ohio, USA), ethylene glycol tetraacetic acid (EGTA; Bio Basic, Markham, Ontario, Canada), Na2EDTA∙2H2O (Bio Basic, Markham, Ontario, Canada) and pepstatin A (Bioworld, Dublin, Ohio, USA). Chicken egg white ovalbumin and lysozyme were used as standard proteins in the denaturing gels, and broad-range marker proteins (245-11 kDa; iNtRON Biotechnology, Sungnam, Kyungki-Do, Korea) were used as standard proteins and for the construction of a standard protein curve to estimate the molecular weights of different protein bands. The gels were stained in Coomassie Brilliant Blue solution.
Lysozyme activity assay
The lytic activity of lysozyme was measured using Micrococcus lysodeikticus (ATCC. 4698 lyophilized cells; Sigma-Aldrich, Saint Louis, Missouri, USA) as a substrate following the protocol in Shugar [23]. Chicken egg white lysozyme (0.001 mg/mL) and 66 mM potassium phosphate buffer (pH 6.24) were used as positive and negative controls, respectively. One unit of lysozyme activity was defined as 0.001 change in absorbance per min. The activity was estimated from the maximum linear line of absorbance that is plotted as a function of time, using a minimum of four absorbance points.
Statistical analysis
Data were analyzed using IBM SPSS statistics version 21 (SPSS INC., Chicago, Illinois, USA). Levene’s test of homogeneity of variances was used to determine whether or not the variances around the means of lysozyme activity in certain egg fraction during different developmental stages are statistically different from each other. One-way analysis of variance (ANOVA) was used to assess if there were any significant differences among the means of lysozyme activity. One-way ANOVA was followed by least significant difference (LSD) test of post-hoc multiple comparisons to determine the means that differ significantly from each other during the measure- ment of the enzymatic activity. The F value in the ANOVA test was calculated accord- ing to the following formula: F(dfbetween, dfwithin) = MSb/MSw, where dfbetween: the degree of freedom between groups, dfwithin: the degree of freedom within groups,
MSb: mean square between groups, MSw: mean square within groups. The level of significance was set at P ≤ 0.05.
RESULTS
Electrophoretic patterns of different egg fractions during different developmental stages
Different electrophoretic protein bands could be observed in the egg white samples from day 0 until day 25 (Fig. 2A). The intensity of these bands increased after day 4.
The two bands marked with white and black arrowheads, and have approximate weight of 43.75 kDa and 15 kDa, respectively, were assumed to be ovalbumin and lysozyme bands, respectively (Fig. 2A). In the other egg fractions, the first appear- ance of electrophoretic protein bands did not necessarily match the first appearance and collection of these fluids (see Material and methods under “Formation, collection and preparation of different egg fractions”).
In the extraembryonic fluid, the protein bands first appeared on day 15 and their intensity increased on day 16, the last day of fluid appearance (Fig. 2B). In the amni- otic fluid, the protein bands appeared on day 17 and continued thereafter (Fig. 2C).
The intensity of bands decreased on day 23, and it was obviously reduced on day 24 as tiny amount of the fluid remained. After incubation day 24, the amniotic fluid was completely taken up by the embryo. In both extraembryonic and amniotic fluids, the protein bands including those of presumptive ovalbumin and lysozyme were reminis- cent of those in the egg white (Fig. 2A–C), suggesting the transfer of egg white pro- teins to these fluids.
The electrophoretic protein bands in the intestinal fluid started to appear on day 17 and remained until day 27 (Fig. 2D). On day 28 (the day of hatching), all the bands disappeared except the one of presumptive lysozyme. In the thin yolk, faint protein bands were detected throughout the fluid appearance (Fig. 2E). In the thick yolk, several protein bands beside ovalbumin and lysozyme appeared at all stages (Fig. 2F).
The intensity of bands was almost the same from day 0 until day 17; however, it started to increase on day 18 and continued until day 27. One band with approximate weight of 73.8 kDa disappeared after day 18 (Fig. 2F, black star). On the day of hatch, the intensity of all bands was highly reduced except that of the presumptive lysozyme band.
Lysozyme activity in different egg fractions during different developmental stages
The electrophoretic band that had a molecular weight of 15 kDa was suggested to be lysozyme. In order to confirm the transfer of lysozyme from egg white into other egg compartments, lysozyme activity assay was performed. In the egg white, lysozyme
Fig. 2. Electrophoretic patterns of proteins in (A) egg white, (B) extraembryonic fluid, (C) amniotic fluid, (D) intestinal fluid, (E) thin yolk and (F) thick yolk. All samples were 48 times diluted, and 10 µl of each sample was loaded in the gel. Developmental stages (days) are shown on top of each gel. CO and CL stand for chicken ovalbumin and lysozyme, respectively. M represents the marker proteins with molecu- lar weights (kDa) shown to the right. White and black arrowheads represent the presumptive ovalbumin and lysozyme bands, respectively, while black star marks the absence of 73.8 kDa band from the thick
yolk after day 18
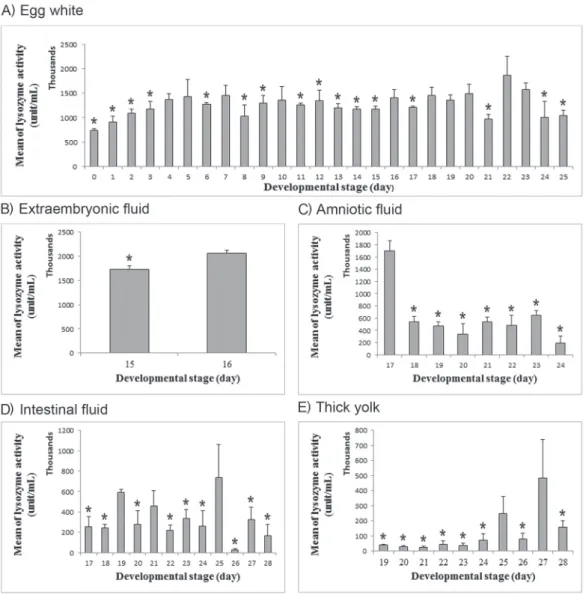
activity started on day 0 and continued throughout development until day 25 (Fig. 3A). The activity gradually increased from day 0 to day 5. Then, the activity fluctuated until day 22 when it reached the maximum value; however, it was reduced
Fig. 3. Mean of lysozyme activity (unit/mL) is plotted as a function of developmental stage (day) in (A) egg white, (B) extraembryonic fluid, (C) amniotic fluid, (D) intestinal fluid and (E) thick yolk. The mean of lysozyme activ- ity is represented as a gray bar and the standard error of mean is represented as a black line. P values of Levene’s test of homogeneity of variances are 0.001 in egg white, 0.693 in extraembryonic fluid, 0.194 in amniotic fluid, 0.028 in intestinal fluid and 0.000 in thick yolk. The F and P values of one-way ANOVA test are: F(25, 82) = 1.658 and P = 0.046, F(1, 4) = 13.465 and P = 0.021, F(7, 16) = 14.618 and P = 0.000, F(11, 35) = 2.119 and P = 0.045 and F(9, 30) = 2.532 and P = 0.027 in egg white, extraembryonic fluid, amniotic fluid, intestinal fluid and thick yolk, respectively. Three to four independent samples were used at each developmental stage, and each sample was read in triplicate. Bars with asterisks mark the means that differ significantly from the mean of maximum enzy-
matic activity
thereafter. The maximum enzymatic activity on day 22 was significantly higher than that on days 0–3, 6, 8, 9, 11–15, 17, 21, 24 and 25.
In the extraembryonic fluid, the enzymatic activity was detected on days 15 and 16 (Fig. 3B). The activity increased significantly on day 16, the last day of fluid appear- ance. In the amniotic fluid, the activity of the enzyme was detected on day 17 until day 24 (Fig. 3C). The maximum activity was on day 17. Following that, the activity was dramatically reduced and reached its minimum value on day 24.
The activity of lysozyme in the intestinal fluid, was initially detected on day 17 and continued until day 28 (Fig. 3D). The activity fluctuated throughout development. It reached the maximum value on day 25, but then it drastically decreased and reached the minimum value on day 26. The maximum activity was significantly higher than that on other incubation days except on days 19 and 21. In the thin yolk, no lysozyme activity was detected throughout the fluid appearance. In the thick yolk, although the intensity of electrophoretic bands increased on day 18 (Fig. 2F), the activity of lysozyme was initially detected on day 19 (Fig. 3E). The activity of lysozyme was low until day 25 when the activity increased; however, it was reduced on day 26 (Fig.
3E). Then, the activity significantly increased and reached the maximum value on day 27, but substantially decreased thereafter. The maximum lysozyme activity was dra- matically higher than that on other stages except on day 25.
Protease activity in the intestinal fluid and egg yolk
Late in development, the reduction in the intensity of electrophoretic bands or their disappearance in the egg yolk or intestinal fluid suggests the presence of protease activity in both egg compartments. To determine the type of activated protease(s) in the intestine, the optimal pH range for protease activity was initially tested for sam- ples loaded in denaturing SDS polyacrylamide gel. The samples were diluted (1:1) with 0.1 M citric acid–0.2 M dibasic sodium phosphate buffer solution at a pH range from 3 to 7. After loading in the gel, one electrophoretic protein band with approxi- mate weight of 73.8 kDa was absent from the samples at pH 3, 3.5 and 4, but appeared at pH 5 and thereafter (Fig. 4A). Also, another protein band with approxi- mate weight of 65.71 kDa was absent from the samples at pH 3 and 3.5, but appeared at pH 4 and afterwards (Fig. 4A). These results showed that the digestion of both bands by probably acidic protease(s) occurred below pH 4.
To further test for the type of activated proteases, the intestinal fluid samples were diluted with a buffer solution at pH 3 that includes one of several different types of protease inhibitors (Fig. 4B). Of all the inhibitors used, pepstatin A, an inhibitor of aspartic proteases, completely prevented the protease activity as marked by the full appearance of the 73.8 kDa and 65.71 kDa bands after its addition (Fig. 4B). In con- trast, the other inhibitors did not abolish the enzymatic activity, as marked by the disappearance of the 73.8 kDa and 65.71 kDa bands despite their addition. These inhibitors include the inhibitor of serine and cysteine proteases, PMSF (Fig. 4B) as well as the inhibitors of serine proteases, trypsin inhibitor and aprotinin (Fig. 4B);
cysteine proteases, DTT and E-64 (Fig. 4B) and metalloproteases, EGTA and Na2EDTA∙2H2O (Fig. 4B).
Similarly, the yolk samples were diluted with a buffer solution at a pH range from 3 to 7. One electrophoretic protein band with approximate weight of 65.71 kDa was absent from the samples at pH 3, 3.5 and 4; however, it was present at pH 5 and thereafter (Fig. 4C). Therefore, the inhibitors applied to the yolk samples were dis- solved in a buffer solution at pH 3 (Fig. 4D). Of all the inhibitors used, pepstatin A completely prevented the protease activity, because the 65.71 kDa band appeared after its addition (Fig. 4D). On the other hand, the inhibitors of serine and cysteine
Fig. 4. Effect of pH and protease inhibitors on the electrophoretic patterns of intestinal and egg yolk proteins. All samples were collected from developmental stage 26. A and C: Samples were diluted (1:1) with a buffer at pH values of 3 (lane 1), 3.5 (lane 2), 4 (lane 3), 5 (lane 4), 6 (lane 5) and 7 (lane 6).
B and D: Samples were diluted with a buffer at pH 3 including no inhibitor (lane 1), PMSF (lane 2), trypsin inhibitor (lane 3), aprotinin (lane 4), DTT (lane 5), E-64 (lane 6), EGTA (lane 7), Na2EDTA∙2H2O (lane 8), pepstatin A (lane 9), or samples were not incubated with a buffer (lane 10). White arrowhead marks the appearance of the 73.8 kDa protein band, while black arrowhead marks the appearance of the
65.71 kDa band. M represents the marker proteins with molecular weights (kDa) shown to the right
proteases (Fig. 4D) and metalloproteases (Fig. 4D) did not abolish the enzymatic activity, as marked by the disappearance of the 65.71 kDa band, in spite of their addi- tion.
DISCUSSION
In the present study, it has been shown the appearance of presumptive egg white protein bands in different egg compartments during different developmental stages.
We assume that the two bands with approximate weights of 43.75 kDa and 15 kDa were ovalbumin and lysozyme, respectively. This assumption depended on a previous work which showed the presence of ovalbumin and lysozyme bands with similar molecular weights in the duck egg white [15]. Moreover, the two bands have similar molecular weights to those of chicken ovalbumin (42.699 kDa) [16] and lysozyme (14. 313 kDa) [4] counterparts. We used lysozyme as a reference protein and detected its activity in different egg fractions. The first appearance of electrophoretic protein bands such as ovalbumin and the detection of lysozyme activity in different egg com- partments were chronological as they were evident on day 15 in the extraembryonic fluid and on day 17 in the amniotic and intestinal fluids. Although, the intensity of electrophoretic bands in the thick yolk started to increase on day 18, the activity of lysozyme appeared at first on day 19. This difference can be due to the presence of very low concentration of the enzyme on day 18 that was not detected by the lysozyme activity assay. Taken together, our findings suggest that the major route of egg white transfer in the fertilized duck egg is the albumen sac – extraembryonic cavity – amniotic cavity – intestinal lumen – egg yolk (Fig. 1). Our results are consist- ent with previous results which showed that the egg white transfer followed a similar route in the fertilized eggs of chicken [3, 5, 26], quail [32] and turkey [22].
We also detected the appearance of several protein bands including the presump- tive ovalbumin in the thick yolk early in development, even before the growth of the embryo as shown on day 0. These bands may represent the presence of endogenous yolk proteins and/or the transfer of small amount of egg white into the yolk.
Therefore, another possible route is the direct transfer of egg white proteins in a small scale into the duck egg yolk. Our results are similar to those previously reported in chicken [25, 26] and turkey [22] and suggested the direct flow of egg white proteins into the yolk.
We found that the activity of lysozyme fluctuated after day 5 but remained gener- ally high and reached the maximum value on day 22. During the period between days 4 and 13, the thin yolk was formed by water flow from egg white into the yolk [1].
As a consequence, the egg white volume decreased and the proteins probably became more concentrated including lysozyme that showed simultaneous increase in its activ- ity. The egg white proteins including lysozyme apparently transferred into the amni- otic fluid between days 17 and 24. The activity of the enzyme was high on day 17, but then it was dramatically reduced and reached the minimum value on day 24. The reduction in lysozyme activity can be due to the reduction in enzyme concentration, presence of an inhibitor or absence of a cofactor.
In the intestinal fluid and thick yolk, the enzyme reached its maximum activity late in development on day 25 and day 27, respectively. Then, the activity was obviously reduced on the day of hatch. The reduction in lysozyme activity at hatch was concur- rent to the drastic reduction in the intensity of several electrophoretic protein bands in the thick yolk and their disappearance in the intestine. These changes were prob- ably due to the degradation of the bands by the activated proteases. Although the intensity of lysozyme band was evident in both fluids at the day of hatch, lysozyme could have also been degraded, and the apparent band might reflect the co-migration of other degradation products with the small size lysozyme band.
The thin yolk did not show any lysozyme activity. The appearance of faint protein bands in the thin yolk might be due to the solubility of small amount of egg white proteins in the water that transferred into the yolk [22]. Another possibility is the slight contamination of the thin yolk by the underlying thick yolk [3]. In both cases, if lysozyme had transferred at a low concentration into the yolk, the activity of the enzyme could not have been detected.
As mentioned above, the intensity of protein bands was highly reduced in the egg yolk at the day of hatch. Furthermore, one electrophoretic band with approximate weight of 73.8 kDa disappeared after incubation day 18. It is likely that proteases were activated late in development which probably caused the digestion of trans- ferred egg white and endogenous yolk proteins. In order to determine the type of activated proteases, we employed different types of protease inhibitors. We found that the proteases were completely inhibited by addition of the wide range aspartic pro- tease inhibitor pepstatin A, and thus they might belong to the acidic aspartic type.
Our results are similar to those obtained in turkey which showed the presence of high aspartic protease activity during the last stages of development in the egg yolk [21]. In contrast, neutral and serine proteases were activated late in development in the chicken egg yolk [27]. Although the same type of proteases were found to be activated in duck (present work) and quail [32, 33], the time of their activation dif- fered. In duck, the activation of acidic aspartic proteases appeared to occur after the major transfer of egg white into the yolk, while in quail, the activation of cathepsin D aspartic protease was early in incubation before the major egg white transfer.
It is reported in other avian species that the yolk undergoes back flow into the intestine toward hatching [7, 8, 17]. Therefore, it is reasonable to assume that the degradation of yolk proteins might be completed in the intestine. Indeed, we showed that several protein bands that were highly reduced in the yolk were completely dis- appeared after their backflow into the intestine at the day of hatch. We also found that the activated protease(s) belonged to acidic aspartic type similar to our findings in the egg yolk. It is possible that the activated proteases are transferred from the egg yolk along with other proteins into the intestine. Another possibility is the secretion of the acidic aspartic protease pepsinogen from the proventriculus [28], and its activation in the intestine after the backflow of yolk. However, it is unlikely that the pancreatic trypsinogen and chymotrypsinogen and the brush border aminopeptidase are secreted and/or activated at hatch in the duck, because the former enzymes are serine pro- teases [9], while the latter is a metalloprotease [10], and all require alkaline condi-
tions to function [24]. Our results are inconsistent with those that showed the activa- tion of the pancreatic proteases and aminopeptidase late in development and at hatch in chicken [14, 29] and at the day of hatch in pigeon [6].
In conclusion, our results showed that the major route of egg white transfer is through the amniotic cavity and intestinal lumen into the yolk in the fertilized duck egg. These findings in the duck, which belongs to the Anseriformes order [34], are similar to those of different avian species that belong to the Galliformes order. Both sister taxa are most basal in Neognathae [34]. Therefore, it will be interesting to investigate more species that belong to other derived and basal orders. This will assist in exploring whether the major transfer of egg white through the embryo evolved in the common ancestor of Neognathae, or whether it evolved independently in certain orders. Furthermore, we found that acidic aspartic proteases were activated in the intestinal lumen and egg yolk late in development, probably to digest the egg proteins before their consumption by the new hatchling. Future studies are needed to examine the mechanisms underlying the transport of proteins and their digestion products into the yolk sac and intestinal cells during the development of duck embryo and at hatch.
This will largely help elucidate the role of egg proteins in the duck nutrition during embryogenesis.
ACKNOWLEDGMENTS
We thank the two anonymous reviewers for comments on the manuscript. This work was funded by the Deanship of Scientific Research, The Hashemite University, Zarqa, Jordan.
REFERENCES
1. Ar, A. (1991) Egg water movements during incubation. In: Tullett, S. G. (ed.) Avian Incubation.
Butterworth-Heinemann, London, pp. 157–173.
2. Baggott, G. K. (2009) Development of extra-embryonic membranes and fluid compartments. Avian Biol. Res. 2, 21–26.
3. Baintner, K., Fehér, G. (1974) Fate of egg white trypsin inhibitor and start of proteolysis in develop- ing chick embryo and newly hatched chick. Dev. Biol. 36, 272–278.
4. Callewaert, L., Michiels, C. W. (2010) Lysozymes in the animal kingdom. J. Biosci. 35, 127–160.
5. Carinci, P., Manzoli-Guidotti, L. (1968) Albumen absorption during chick embryogenesis.
J. Embryol. Exp. Morphol. 20, 107–118.
6. Dong, X. Y., Wang, Y. M., Dai, L., Azzam, M. M., Wang, C., Zou, X. T. (2012) Posthatch develop- ment of intestinal morphology and digestive enzyme activities in domestic pigeons (Columba livia).
Poult. Sci. 91, 1886–1892.
7. Dong, X. Y., Wang, Y. M., Yuan, C., Zou, X. T. (2012) The ontogeny of nutrient transporter and diges- tive enzyme gene expression in domestic pigeon (Columba livia) intestine and yolk sac membrane during pre- and posthatch development. Poult. Sci. 91, 1974–1982.
8. Esteban, S., Rayo, J., Moreno, M., Sastre, M., Rial, R., Tur, J. (1991) A role played by the vitelline diverticulum in the yolk sac resorption in young post hatched chickens. J. Comp. Physiol. B 160, 645–648.
9. Hedstrom, L. (2002) Serine protease mechanism and specificity. Chem. Rev. 102, 4501–4524.
10. Hooper, N. M. (1994) Families of zinc metalloproteases. FEBS Lett. 354, 1–6.
11. Hu, S., Qiu, N., Liu, Y., Zhao, H., Gao, D., Song, R., Ma, M. (2016) Identification and comparative proteomic study of quail and duck egg white protein using 2-dimensional gel electrophoresis and
matrix-assisted laser desorption/ionization time-of-flight tandem mass spectrometry analysis. Poult.
Sci. 95, 1137–1144.
12. Kovacs-Nolan, J., Phillips, M., Mine, Y. (2005) Advances in the value of eggs and egg components for human health. J. Agric. Food Chem. 53, 8421–8431.
13. Laemmli, U. K. (1970) Cleavage of structural proteins during the assembly of the head of bacterio- phage T4. Nature 227, 680–685.
14. Marchaim, U., Kulka, R. G. (1967) The non-parallel increase of amylase, chymotrypsinogen and procarboxypeptidase in the developing chick pancreas. Biochim. Biophys. Acta 146, 553–559.
15. Miguel, M., Manso, M. A., Lopez-Fandino, R., Ramos, M. (2005) Comparative study of egg white proteins from different species by chromatographic and electrophoretic methods. Eur. Food Res.
Technol. 221, 542–546.
16. Nisbet, A. D., Saundry, R. H., Moir, A. J., Fothergill, L. A., Fothergill, J. E. (1981) The complete amino-acid sequence of hen ovalbumin. Eur. J. Biochem. 115, 335–345.
17. Noy, Y., Uni, Z., Sklan, D. (1996) Routes of yolk utilisation in the newly-hatched chick. Br. Poult.
Sci. 37, 987–995.
18. Romanoff, A. L. (1960) The Avian Embryo Structural and Functional Development. Macmillan, New York.
19. Saito, Z., Martin, W. G. (1966) Ovalbumin and other water soluble proteins in avian yolk during embryogenesis. Can. J. Biochem. 44, 293–301.
20. Salton, M. J. R. (1957) The properties of lysozyme and its action on microorganisms. Bacteriol. Rev.
21, 82–98.
21. Shbailat, S. J., Qanadilo, S., Al-Soubani, F. A. (2016) Protease activity in the egg yolk during the development of Meleagris gallopavo (Galliformes: Phasianidae) embryos. Ital. J. Zool. 83, 291–297.
22. Shbailat, S. J., Safi, H. M. (2015) Transfer of egg white proteins with reference to lysozyme during the development of Meleagris gallopavo (Galliformes: Phasianidae) embryos. Ital. J. Zool. 82, 349–
23. Shugar, D. (1952) The measurement of lysozyme activity and the ultraviolet inactivation of lysozyme. 357.
Biochim. Biophys. Acta 8, 302–309.
24. Sorkhabi-Abdolmaleki, S., Zibaee, A., Hoda, H., Hosseini, R., Fazeli-Dinan, M. (2013) Proteolytic compartmentalization and activity in the midgut of Andrallus spinidens Fabricius (Hemiptera:
Pentatomidae). J. Entomol. Acarol. Res. 45(e8), 33–41.
25. Sugimoto, Y., Hanada, S., Koga, K., Skaguchi, B. (1984) Egg-yolktrypsin inhibitor identical to albu- men ovomucoid. Biochim. Biophys. Acta 788, 117–123.
26. Sugimoto, Y., Saito, A., Kusakabe, T., Hori, K., Koga, K. (1989) Flow of egg white ovalbumin into the yolk sac during embryogenesis. Biochim. Biophys. Acta 992, 400–403.
27. Svihus, B. (2014) Function of the digestive system. J. App. Poult. Res. 23, 306–314.
28. Uni, Z., Tako, E., Gal-Garber, O., Sklan, D. (2003) Morphological, molecular, and functional chang- es in the chicken small intestine of the late-term embryo. Poult. Sci. 82, 1747–1754.
29. Wouters, J., Goethals, M., Stockx, J. (1985) Acid proteases from the yolk and the yolk-sac of the hen’s egg. Purification, properties and identification as cathepsin D. Int. J. Biochem. 17, 405–413.
30. Wu, J. (2014) Eggs and egg products processing. In: Clark, S., Jung, S., Lamsal, B. (eds) Food Processing: Principles and Applications. John Wiley & Sons, Ltd., New York, pp. 437–455.
31. Yoshizaki, N., Ito, Y., Hori, H., Saito, H., Iwasawa, A. (2002) Absorption, transportation and digestion of egg white in quail embryos. Dev. Growth Differ. 44, 11–22.
32. Yoshizaki, N., Soga, M., Ito, Y., Mao, K. M., Sultana, F., Yonezawa, S. (2004) Two-step consumption of yolk granules during the development of quail embryos. Dev. Growth Differ. 46, 229–238.
33. Zelenitsky, D. K., Therrien, F., Ridgely, R. C., McGee, A. R., Witmer, L. M. (2011) Evolution of olfaction in non-avian theropod dinosaurs and birds. Proc. Biol. Sci. 278, 3625–3634.