Kinetic parameters of soil organic matter decomposition in soils under forest in Hungary
Dóra Zacháry, Tibor Filep, Gergely Jakab, György Varga, Marianna Ringer, Zoltán Szalai
PII: S2352-0094(18)30099-3
DOI: doi:10.1016/j.geodrs.2018.e00187
Article Number: e00187
Reference: GEODRS 187
To appear in: Geoderma Regional
Received date: 29 April 2018
Revised date: 7 August 2018
Accepted date: 10 August 2018
Please cite this article as: Dóra Zacháry, Tibor Filep, Gergely Jakab, György Varga, Marianna Ringer, Zoltán Szalai , Kinetic parameters of soil organic matter decomposition in soils under forest in Hungary. Geodrs (2018), doi:10.1016/j.geodrs.2018.e00187
This is a PDF file of an unedited manuscript that has been accepted for publication. As a service to our customers we are providing this early version of the manuscript. The manuscript will undergo copyediting, typesetting, and review of the resulting proof before it is published in its final form. Please note that during the production process errors may be discovered which could affect the content, and all legal disclaimers that apply to the journal pertain.
ACCEPTED MANUSCRIPT
Kinetic parameters of soil organic matter decomposition in soils under forest in Hungary
Dóra Zachárya,b*, Tibor Filepa, Gergely Jakaba, György Vargaa, Marianna Ringera,c, Zoltán Szalaia,c
aGeographical Institute, Research Centre for Astronomy and Earth Sciences, Hungarian Academy of Sciences, Budaörsi út 45., H-1112 Budapest, Hungary
bInstitute for Nuclear Research, Hungarian Academy of Sciences, Bem tér 18/c, H- 4026, Debrecen, Hungary
cDepartment of Environmental and Landscape Geography, Eötvös Loránd University, Pázmány Péter sétány 1/c, H-1117 Budapest, Hungary
*Corresponding author at: Geographical Institute, Research Centre for Astronomy and Earth Sciences, Hungarian Academy of Sciences, Budaörsi út 45., H-1112 Budapest, Hungary.
E-mail addresses:zachary.dora@csfk.mta.hu (D. Zacháry), filep.tibor@csfk.mta.hu (T. Filep), jakab.gergely@csfk.mta.hu (G. Jakab), gyorgy.varga@csfk.mta.hu (G.
Varga), ringer.marianna@csfk.mta.hu (M. Ringer), szalai.zoltan@csfk.mta.hu (Z.
Szalai)
ACCEPTED MANUSCRIPT
Abstract
To obtain better knowledge on how soil organic matter (SOM) decomposition is regulated by different soil properties, 13 soil samples amended with maize residues were incubated for 163 days. Carbon mineralization kinetics was modelled by fitting five different kinetic models, from which the first-order two pools model was selected for further analysis. The results showed that residue addition increased the rate of C mineralization, particularly in sand samples, where four times as much C was released as CO2 in amended samples as in control samples. Residue addition also affected the kinetic parameters of the two C pools modelled. The mean residence time (MRT) averaged 31.9 days for the fast C pool and 65.1 days for the slow C pool phase in the amended soils, whereas in the control soils MRT1 and MRT2 averaged 52.3 and 94.2 days, respectively. The kinetics of C decomposition was found to be influenced to the greatest extent by soil organic carbon (SOC) content and soil texture. The texture primarily affected the size of the fast carbon pool (C1): in both the amended and control samples C1 was increased by the clay content (r = 0.574 and r = 0.554, respectively) and decreased by the sand content (r = 0.771 and r = 0.583, respectively). Our results confirm the fact that texture has a significant role in soil organic matter mineralization, however other parameters also play a crucial role in the decomposition due to the complexity of the processes.
Keywords
Soil organic carbon; carbon mineralization; carbon turnover; model fitting; soil texture
1. Introduction
ACCEPTED MANUSCRIPT
The significant role of SOM in the global carbon cycle is well known. The global soil carbon pool (2500 Gt) is 3.3 times the size of the atmospheric pool and 4.5 times the size of the biotic pool (Lal, 2004). Promoting the amount of SOM sequestered in terrestrial ecosystems is important as it may help slow the rise in atmospheric CO2 in coming decades (Janzen, 2006). Therefore, a better understanding of the properties and dynamics of SOM and the identification of the factors that regulate soil
respiration in natural and managed ecosystems is critical in predicting ecosystem responses to global change (Ahn et al., 2009).
Soil organic matter consists of a variety of materials, ranging in age from a few hours for root exudates through weeks and months for plant residues to thousands of years for resistant organic compounds (Kuzyakov, 2006; Schmidt et al., 2011;
Trumbore, 2000). Models that aim to describe the cycles of these compounds cannot characterize every carbon pool with different turnovers, but differentiate one, two or three pools of SOM. The mathematical description of nutrient release patterns and the fitting of kinetic equations to mineralization curves make it possible to characterize SOM pools and calculate the fraction of potentially mineralizable C and its
mineralization rate (Bernal et al., 1998; Saviozzi et al., 1993).
There are many potential approaches for modelling the C and N decomposition kinetics of soils. The original approximation was the first-order logarithmic form used by Stanford & Smith (1972). According to this exponential model, there is only one pool of potentially mineralizable C, decomposing at a rate proportional to its initial concentration. Since then many other models have been postulated. Some authors modified the simple first-order model and used approaches that take into account several organic pools with different decomposition rates. For example, Murayama (1984) described a first-order model with two compartments (two exponential
ACCEPTED MANUSCRIPT
equations), one for SOM with fast turnover and the other for SOM which decomposes more slowly. Others (Jones, 1984; Beauchamp et al., 1986) used an additional
parameter in the simple first-order model to differentiate the fast initial flush caused by easily decomposable substrates at the beginning of the incubation period. Although first-order approaches are more common, other models with zero-order (Addiscott, 1983; Tabatabai and Al-Khafaji, 1980) and mixed-order (first-order plus zero-order) equations (Bonde and Rosswall, 1987; Seyfried and Rao, 1988) have also been used to study SOM decomposition kinetics.
SOM decomposition depends on many biotic and abiotic factors and may be altered by climate change (IPCC, 2013). Among the abiotic factors, climatic
conditions, soil moisture, chemical recalcitrance and the physical accessibility of C compounds are significant (Manzoni et al., 2012). Soil texture is also an important parameter influencing SOM decomposition through factors such as particle surface area and porosity, which affect water-holding capacity, cation exchange capacity and many other factors (Procter et al., 2015). Soils with higher silt and clay content generally sequester more C than sandier soils, because decomposition is slower in the finer textured soils where lower O2 inhibits aerobic microbial processes and the chemical and physical stabilization of SOM by soil minerals is more effective (Barré et al., 2014; Hassink, 1997; Wattel-Koekkoek et al., 2003). Since the specific surface area of the fine particle-size fractions is several orders of magnitude higher than that of the sand fraction, and since minerals belonging to these groups have reactive surfaces, not just clay minerals but also Fe-oxides play an important role in SOM binding (Eusterhues et al., 2005; Gu et al., 1994; Kaiser and Guggenberger, 2003). In incubation experiments the major influencing factors are soil pH and redox
conditions, clay content, the size and quality of soil C pools and microbial activity
ACCEPTED MANUSCRIPT
(Ahn et al., 2009; Delaune et al., 1981; Riffaldi, 1996). In addition to soil parameters, the organic materials added to soils also have a great influence on the amount and rate of organic matter decay (Kassam et al., 2017; Singh and Gupta, 1977).
Soil incubation is a direct approach to quantifying the mineralizable soil C (Ahn et al., 2009), so many experiments have used this method to model SOM
decomposition by fitting kinetic equations to mineralization curves. However, most incubation experiments test one or two soil samples, so it is not clear how soil type, texture and other soil parameters influence SOM decomposition kinetics. Therefore, it was aimed to provide more complete insights into (1) the description of the dynamics and kinetics of C mineralization in 13 different soil samples with widely differing properties; (2) the effectiveness of some commonly used decay models for describing C mineralization; and (3) the quantification of the relationship between soil properties and mineralization parameters derived from the best model.
2. Materials and methods
2.1 Soil samples
Thirteen topsoil samples were collected from seven sites in Hungary (Fig. 1, Table 1).
The samples were mainly forest soils with high clay, silt and organic matter content, but three forest soils developed on sand were also collected (Tables 1 and 2). Soil samples were taken from the upper 020 cm horizon with one exception, where the bedrock was near the surface (sample code BAT in Table 1). Undisturbed soil samples were taken in order to determine the water-holding capacity (WHC). The soils were air-dried, homogenized, passed through a 2-mm sieve and stored at room temperature. Soil texture, total and dissolved organic and nitrogen content, iron
ACCEPTED MANUSCRIPT
content and the cation exchange capacity were measured before the incubation experiment.
The soil texture was determined by the pipette method (Gee and Bauder, 1986).
The total organic carbon (TOC) content was analyzed using an NDIR-
chemiluminescent analyzer (Apollo 9000, Tekmar Dohrmann). The total N content was determined by the Kjeldahl method (Conklin, 2014). The water extractable organic carbon (WEOC) and the total soluble nitrogen (TSN) were measured after extraction with ultrapure water (> 18 MΩ cm) at a 1:10 soil:solution ratio for 2 h and filtration through a 0.45 m membrane nylon filter (Millipore), in a TOC/TN analyzer (TOC-L, Shimadzu). Iron was determined in acid ammonium oxalate extracts
(Schwertmann, 1973) and in dithionite–citrate–bicarbonate extracts (Holmgren, 1967) and measured using an atomic absorption spectrophotometer (210VGP, Buck
Scientific). Cation exchange capacity (CEC) was determined according to the method of Gillman (1979). In this method 2 g of air-dried soil was saturated with 20 ml of 0.1 M BaCl2 solution and equilibrated with 20 ml of 0.2 mM BaCl2 solution. Then reacted with 10 ml of 5 mM MgSO4 to replace Ba with Mg. The electrical conductivity of the resultant reactant suspension was adjusted to that of the 1.5 mM MgSO4 ionic strength reference solution. The loss of Mg from the reactant MgSO4 solution was determined by analysis of the equilibrium solution and is equivalent to that adsorbed and hence to CEC. The Mg concentration was measured by an atomic absorption
spectrophotometer (210VGP, Buck Scientific). The use of unbuffered solutions throughout ensures that pH approaches the natural soil pH.
2.2 Incubation experiment
Two-hundred grams of sieved and air-dried soil was weighed into 1 litre Duran glass bottles. The samples were preincubated at 50% WHC at 20°C for two weeks, because
ACCEPTED MANUSCRIPT
rewetting and sieving affect the availability of SOM for microorganisms and may cause an increase in the rate of respiration (Franzluebbers, 1999).
The preincubated soils were amended with maize residues. Three replicates of amended soil and one control with no residue addition were used for each soil type.
One blank sample without soil or residue was used for the whole incubation
experiment. The maize residues were air dried, cut into pieces and sieved through a 2- mm mesh, after which 1 g was thoroughly mixed with 200 g preincubated soil. The samples were kept in an incubator (KBW 400 E5.1, Binder) at 20°C for 163 days at 70 % WHC, as this moisture content allowed handling and compaction of the soil without the collapse of small soil aggregates (Frøseth and Bleken, 2015). Soil
respiration was trapped in plastic tubes containing 15 ml of 2 M NaOH, placed in the incubation bottles, which were closed air-tight. The NaOH traps were replaced on days 3, 8, 15, 30, 51, 79, 107, 135 and 163. The amount of CO2 evolved was measured by titrating the NaOH with 1M HCl in the presence of BaCl2 (Anderson, 1982).
2.3 Carbon mineralization kinetic models and statistical analysis
Five different models were used in this experiment to describe the C mineralization kinetics in the studied samples (Table 3). The data of cumulative CO2 evolution were fitted using non-linear least-squares models in MATLAB version R2016a Curve Fitting Toolbox 3.5.3 (The MathWorks Inc., Natick, USA). The coefficient of
determination (R2) was used to evaluate the different kinetic models. For selection of the appropriate model, Akaike’s Information Criterion (AIC) was also used (Akaike, 1973) as R2 values only indicate the goodness-of-fit, but do not take the simplicity of the model (number of independent parameters, samples sizes) into account (Burnham and Anderson, 2002). AIC integrates model-selection uncertainty by penalizing the
ACCEPTED MANUSCRIPT
further addition of independent variables to the model and it is widely applied in the field of kinetic modelling of carbon mineralization of soils (Stewart et al., 2007;
Martín et al., 2012).
AIC were calculated for every soils and models from the residual sum of squares (RSS):
𝐴𝐼𝐶 = 𝑛 [ln (𝑅𝑆𝑆𝑛 )] + 2𝑘, (1)
where n is the sample size, k is the number of fitted parameters. For small sample sizes modified version of AIC is recommended (Hurvich and Tsai, 1989):
𝐴𝐼𝐶𝑐 = 𝐴𝐼𝐶 +2𝑘 (𝑘+1)𝑛−𝑘 −1. (2)
The lowest AIC and AICc values indicate the best approximating model:
∆𝑖= 𝐴𝐼𝐶𝑐𝑖− 𝐴𝐼𝐶𝑐𝑚𝑖𝑛, (3)
where 𝐴𝐼𝐶𝑐𝑖 is the 𝐴𝐼𝐶𝑐 of the ith model and 𝐴𝐼𝐶𝑐𝑚𝑖𝑛 is the lowest 𝐴𝐼𝐶𝑐 value of the compared models.
The relationship between CO2 concentration and soil variables (organic C, organic N, pH and soil texture parameters) was analyzed by calculating Pearson’s correlation coefficient. Principal component analysis (PCA) was applied to reveal relationships between the variables resulting in explanatory variables. The PCA was performed for soil properties on the correlation matrix using varimax with the Kaizer normalization rotation method. The PCA and the correlation analysis were performed with IBM SPSS Statistics version 22 (IBM Corp., New York, USA).
3. Results
3.1 Carbon mineralization
The rate of SOM mineralization (the amount of CO2 released per day, data not shown) in the treated and control soils (except for SOP3) was observed to reach a maximum
ACCEPTED MANUSCRIPT
during the first week of incubation and tended to continuously decline as the incubation time progressed. The total amount of CO2 released after 163 days of incubation from soils amended with maize residues (Fig 2.a) ranged from 4.94 to 18.90 g CO2 kg1, whereas the cumulative amount of CO2 in the control samples (Fig.
2b) at the end of the incubation ranged from 1.17 to 16.00 g CO2 kg1.
Residue addition caused a significant increase in total soil CO2 efflux compared to the control soil. In general, twice as much C was released in the 13 amended soil samples as in their control pairs. This rate was the most pronounced in the amended CEG and NYIR1 samples, where four and a half times as much C was mineralized as in the control samples. In samples BAT, JOS2, JOS1 and SOP2 a maximum of one and a half times as much CO2 was released as in the control samples.
3.2 Kinetic parameters of SOM decomposition
A more accurate picture of the process of SOM mineralization and the differentiation of SOM pools and pool sizes was analyzed by fitting the experimental data to the five kinetic models given in Table 3. On the basis of the R2 values, all the kinetic models offered a very good description of SOM mineralization for all the amended and control samples (Table 4). Even the lowest R2 value was 0.90. The first-order two pools model was selected for further analysis based on the following facts: 1) there were no statistical differences between the R2 values of the models for these samples, however the calculated AIC scores indicated the appropriateness (lowest AIC scores) of this model; 2) according to generally accepted theory, SOM can be divided into at least two pools (one with fast turnover and one with slow turnover) (Smith and Falloon, 2000); and 3) the rate of SOM mineralization showed that, in general,
mineralization was faster in the first week than in later phases, suggesting at least two SOM pools with different turnovers.
ACCEPTED MANUSCRIPT
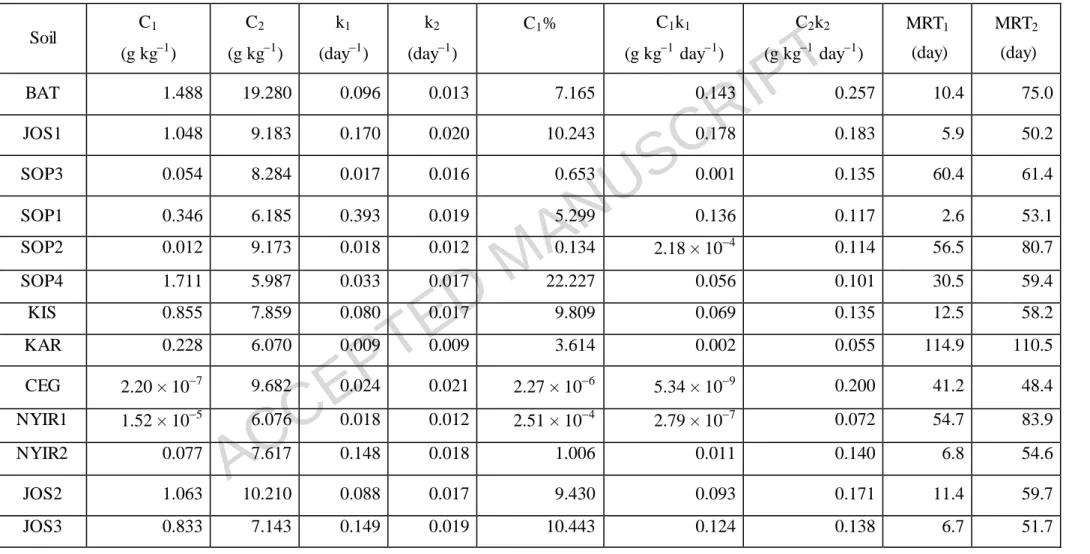
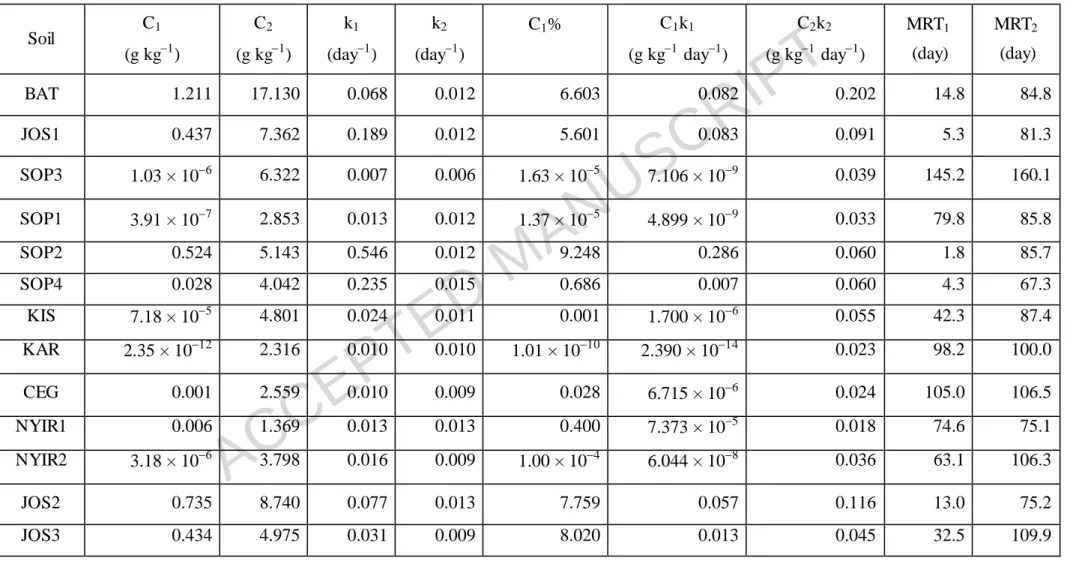
The kinetic parameters calculated using the first-order two pools model are shown in Table 5 for amended samples and in Table 6 for control samples. The quantity of easily mineralizable carbon (C1) varied greatly in the soil samples, ranging between 2.20 × 10⁷ and 1.71 g kg1 with an average of 0.590.61 g kg1 in the amended samples and between 2.35 × 10¹² and 1.21 g kg1 with an average of 0.260.39 g kg1 in the control samples. In contrast, the size of the slowly mineralizable pool (C2) varied over a relatively narrow range (Tables 5 and 6).
Rate constants for the fast C pool (k1) differed between the soils with values of 0.009 to 0.393 day1 for amended soils and 0.007 to 0.546 day1 for control soils. The rate constants for the slow C pool (k2) were smaller (0.009 to 0.021 day1 for amended soils and 0.006 to 0.015 day1 for control soils) than for the fast C pool.
The percentage of labile C (C1%) relative to total mineralizable C (C1 + C2) showed great variability between soils and treatments (Tables 5 and 6). Overall, C1%
was high in both the amended and control samples of JOS1, JOS2 and JOS3.
The mean residence time (MRT), calculated as the reciprocal (k1) of the decomposition rate constant, ranged between 2.5 and 114.9 days with an average of 31.9 days for the fast C pool (MRT1) and between 48.4 and 110.5 days with an average of 65.1 days for the slow C pool phase (MRT2) in the amended soils. Maize addition considerably affected the MRTs of the soils in the fast C pool phase (MRT1), and samples SOP2, SOP4 and KAR proved to be least sensitive to the treatment.
3.3 Relationship between kinetic parameters and soil properties
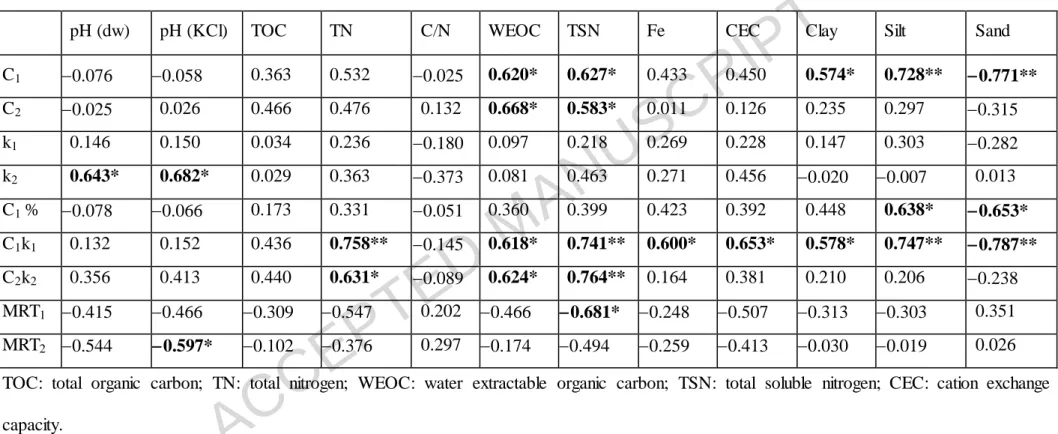
Correlations between C mineralization parameters and soil properties are reported in Table 7 for amended soil and in Table 8 for control soil. Table 8 shows that in the control samples C mineralization parameters were mainly affected by soil parameters
ACCEPTED MANUSCRIPT
connected with the total and soluble C and N content. In the amended samples the soil texture also seemed to be significant for parameters connected to the fast C pool mineralization phase (C1, C1% and C1k1 parameters), as these parameters were significantly positively correlated with the silt content (r=0.728, 0.638 and 0.747, p<0.05, respectively) and negatively correlated with the sand content (r=0.771,
0.653 and 0.787, p<0.05, respectively, Table 7). Water extractable organic carbon
(WEOC) and total soluble nitrogen (TSN) had a significant positive effect on the size of the easily (C1) and slowly (C2) mineralizable pool both in amended and control samples (Tables 7 and 8). The rate constant (k1) and the mean residence time of the fast C pool phase (MRT1) in the amended samples were not significantly correlated with the soil properties (except for the negative effect of TSN on MRT1, Table 7). In the control samples, however, k1 and particularly the MRT1 is affected by many soil properties (TOC, TN, WEOC, TSN and sand content, Table 8). The rate constant (k2) and mean residence time of the slow C pool (MRT2) were not affected by the soil properties.
Based on the results of principal component analysis, three principal components were selected because their total eigenvalues were greater than 1. These three
principal components accounted for 89.1% of the total variability in the dataset. The soil texture characteristics (clay, silt and sand content) and the Fe content constituted the first principal component (PC1), whereas the second principal component (PC2) contained parameters connected to the soil carbon and nitrogen content (TOC, TN, WEOC, TSN and C/N). Soil pH belonged to the third principal component (PC3).
Eigenvectors are plotted in the plane of PC1 and PC2 in Figure 3. Analysis showed that texture and the C and N content (both total and dissolved) of the soil jointly affected the C1 values in the amended and control samples (Fig. 3a, b). Amended soils
ACCEPTED MANUSCRIPT
with low C1 values could be divided into two groups, one is characterized by high clay and low organic matter content, and one containing soils with high sand content (Fig. 3a). This separation could also be seen in the case of the control samples (Fig.
3b). High C1 values were associated with high TOC, WEOC, TN and TSN values and high clay and silt content in both amended and control samples (Fig. 3, b). In the case of C2 values the texture had less influence, while the TOC, WEOC, TN and TSN values were more pronounced in both amended and control samples (data not shown).
Like the C1 values, the k1 values were found to be affected by soil texture parameters and by the soil carbon and nitrogen content in the amended samples (Fig. 3c). In the control samples the k1 values were more affected by TOC, WEOC, TN and TSN than by textural differences. However, high sand content was associated with small k1
values (Fig. 3d). The effect of soil parameters on the k2 values, was less significant, so low and high k2 groups could not be distinguished (data not shown). Two groups of soils could be detected on the basis of MRT1 values. High TOC, WEOC, TN and TSN values and high clay and silt content were associated with low MRT1 values, whereas high MRT1 values were found in sandy soils and in soils with high clay and low organic matter content (data not shown).
4. Discussion
In this study, significant differences were found in the CO2 efflux from different soil samples. Soil types with diverse soil parameters considerably influence the
decomposition of organic matter. Furthermore, the addition of easily degradable organic compounds to the soil resulted in an increase in CO2 efflux, indicating a greater organic matter turnover rates.
The 6-month soil incubation resulted in a gradual decrease in the C mineralization rate, which could be attributed to the depletion of the carbon fraction readily available
ACCEPTED MANUSCRIPT
to soil microorganisms from the beginning of the incubation (Levi-Minzi et al., 1990).
Bernal et al. (1998) and Martín et al. (2012) reported that the maximum C
mineralization rate therefore occurred during the first week of the incubation, as found in the present study.
Generally, SOM is divided into at least two pools. This is supported by incubation experiments. Levi-Minzi et al. (1990), for example, identified two SOM pools after 21-day incubation, one decomposing in about a week, and the other less readily decomposable. In the present experiment these two stages could also be distinguished.
However, the quality and quantity of the organic matter added to the soils may modify decomposition processes (Aslam et al., 2008; El-Mahrouky et al., 2015). Therefore, in experiments with diverse conditions different kinetic models proved to be the best.
For example, Fernández et al. (2007) found that the first-order two pools model described carbon turnover most efficiently, whereas in another study the first stage followed a first-order kinetic model, while the second, slow step was characterized by a zero-order kinetic model (Bernal et al., 1998). Despite the fact that all the kinetic models proved to be good, Sleutel et al. (2005) pointed out that this does not necessarily mean that the modelled values give a good description of the real biological processes. Our results confirm this statement as despite the fact that the model yielded two C pools with good R2 values for the selected first-order two pools model, some soils (NYIR1, KAR, SOP1 and SOP3) have almost the same
decompostion rate constants for the fast and slow mineralizable carbon pools suggesting rather one C pool than two pools with distinct mineralization kinetics.
4.1 Changes in carbon mineralization as affected by crop residues
There were substantial differences in the CO2 efflux of the investigated soils when amended samples were compared to control ones. For example, the CO2 respiration of
ACCEPTED MANUSCRIPT
the amended soils was twice as high as that of control samples on average. It is well known that the incorporation of fresh organic matter such as crop residues may cause a significant increase in soil respiration and soil microbial biomass carbon (Martín et al., 2012; Shahbaz et al., 2017; Thiessen et al., 2013). The higher respiration is attributed to the easily degradable organic C from the crop residues, which leads to enhanced microbial activity using this new substrate (Blagodatskaya et al., 2011).
This stimulation of SOM mineralization and the increased release of the soil-derived carbon as CO2 after adding fresh organic matter to soil is known as priming effect (Bingeman et al. 1953). Up to now, negative and positive priming have been distinguished differentiating an increase (positive priming) or decrease (negative priming) in SOM degradation (Kuzyakov et al., 2000).
The addition of fresh OM caused an increment in the C1 and C2 pools (compare Table 5 with Table 6). However, in some cases, the size of the easily degradable organic pool (C1 pool) of the investigated soils decreased due to the higher energy demand of microbes after maize residues were added. This was true for soils having low organic matter content, such as CEG and NYIR1. The C1k1 values were also lower in these treated soils (compare Table 5 with Table 6), indicating that they had low initial potential rate of C mineralization (Stanford and Smith, 1972).
Enhanced microbial activity also affects the k and MRT values of soils
(Pengthamkeerati et al., 2005; Saviozzi et al., 1993; Turrión et al., 2012). While in the present study the rate of carbon mineralization increased (expressed by k1 and k2), the MRT of carbon in the C1 and C2 pool decreased in samples treated with maize
residues (Table 5) compared to the control (Table 6). The accelerated degradation of the C1 pool after the addition of maize residues was manifested in the MRT1 values (the average MRT1 was 31.9 days and 52.3 days for amended and control soils,
ACCEPTED MANUSCRIPT
respectively). Various authors estimated different k and MRT values from different experiments using the first-order two pools model. Sleutel et al. (2005) mixed various organic amendments with sandy loam soil and reported k1 values of 0.0103 to 5.08 day1 and k2 values of 0.00100 to 0.0296 day1, which are comparable with the amended k values in the present model (Table 5). Although Turrión et al. (2012) reported a narrower range of values (0.15 to 0.36 day1) for the labile pool phase of Cambisols from Northwest Spain than were found in the present study, the
mineralization rate for the slow pool phase (0.009 and 0.020 day1) was close to that found in this study (Tables 5 and 6). It is difficult to compare the MRT and k values from different studies, since C mineralization kinetics is determined by the diverse soil properties of the different soils. This confirms the significance of studies on the effect of different soil properties on C mineralization.
Except for two sand samples, the higher C2k2 and shorter MRT2 values of amended samples compared to control ones underlined the significance of easily degradable compounds that enhance microbial activity in the slow phase, as also found in soils amended with compost (Fernández et al., 2007). Kuzyakov et al. (2000) and von Lützow & Kögel-Knabner (2009) also reported that the input of fresh organic matter stimulates the decomposition of the recalcitrant SOM pool. Overall, fresh organic matter addition caused more pronounced changes in the labile organic matter pool (demonstrated by C1, k1 and MRT1), whereas the kinetic parameters of the stable pool (C2, k2 and MRT2) were more resistant to the treatment, confirming that this pool is more recalcitrant.
4.2 Soil properties controlling carbon turnover
Besides the effect of adding organic matter to the soil, the soil properties themselves may have a significant effect on carbon mineralization. Carbon mineralization,
ACCEPTED MANUSCRIPT
determined as the evolution of CO2 from different carbon fractions, depends greatly on the size and quality of these pools (Ahn et al., 2009; Riffaldi et al., 1996). In the present study, the kinetic parameters of carbon mineralization (C1, C2, k1, k2) in the control samples were affected more by the TOC and TN content of the soil than by the SOM quality, represented by the C/N ratio (Table 8). The significant positive correlation between TOC and TN on the one hand and the carbon pool size and turnover rate on the other was confirmed by other authors (Ahn et al., 2009;
McLauchlan and Hobbie, 2004), who reported the strong influence of the total organic C and N content on microbial processes. Although the C/N ratio is also considered to be an important factor in determining the rate of mineralization, immobilization and nitrification (Bengtsson et al., 2003), in the present experiment there were no
significant correlations between kinetic parameters and the C/N ratio of the soils, probably because the C/N ratio measured in the total soil is a less good indicator for the recalcitrant C pools. In the treated samples neither the quantity nor the quality of soil organic carbon affected the kinetic parameters (Table 7), so presumably the large amount of organic matter added to the soil altered the original state of the soil. This observation is consistent with the findings of Levi-Minzi et al. (1990), who reported that the C/N ratio was not found to be correlated with the decomposition rate. In spite of the fact that adding maize to the soil shifts the native soil conditions, there was a significant correlation between the total nitrogen content of the soil and the Cnkn
product (Table 7), indicating that the initial potential rate of C mineralization (Cnkn) could be a more useful index for quantifying effects influencing the quality of SOM than Cn and kn separately (Stanford & Smith, 1972; Saviozzi et al., 1993).
In the present study the fraction readily available for microbial degradation was represented by the two dissolved organic fractions, WEOC and TSN. The strong
ACCEPTED MANUSCRIPT
correlation between these labile pool parameters and C2 (Tables 7 and 8) is probably due to the fact that the WEOC and TSN concentrations are determined not only by the labile pool, but also by the size of the stable organic matter pool (Tegen and Dörr, 1996).
Texture is considered to be one of the most significant parameters affecting the breakdown of SOM. In general, the C in finer textured soils is less bioavailable due to binding with organic matter and the formation of soil aggregates (Procter et al., 2015;
Six et al., 1999). The effect of maize addition, expressed as the difference between the CO2 efflux from control and amended samples, was more pronounced in the sand samples (e.g. samples CEG and NYIR1), since the microbial oxidation of SOM was more intense in these soils due to the favorable aerobic conditions (Demeter et al., 2013; Pengthamkeerati et al., 2005).
The mathematically estimated pools (especially the C1 pool) were significantly correlated with soil texture; sand content decreased the size of the C1 pools, whereas clay content increased it. However, no strong connection was found between the texture and C decomposition. Other authors, however, reported less C mineralization in clay soils (Frøseth and Bleken, 2015; Hassink, 1995; Saviozzi et al., 2014),
suggesting that clay minerals give protection against SOM degradation. Nevertheless, besides the TOC, TN, WEOC and TSN content, soil texture was found in the PCA evaluation to be a decisive factor separating low and high values of kinetic parameters (Fig. 3). The PCA results revealed that soil parameters have a complex influence the carbon mineralization. Although the individual effects of the parameters could be clearly demonstrated, the real relationships were described by their combined effects.
For instance, MRT1 values could be clearly distinguished on the basis of both TOC
ACCEPTED MANUSCRIPT
content and soil texture, indicating a strong connection between TOC and sand/clay content.
5. Conclusions
It was hypothesized that the carbon mineralization of soils, measured as CO2 efflux, was considerably affected by soil conditions. The 13 soil samples studied, which had diverse soil parameters, responded differently to the 163-day incubation. On the one hand, crop residue addition affected the kinetic parameters of the two modelled C pools, the labile carbon pool generally exhibiting greater changes after amendment.
On the other hand, soil parameters also had different effects on the SOM
decomposition from which the organic matter content and soil texture were found to be key factors controlling the turnover of the mathematically estimated labile carbon pool (C1, k1, MRT1). The kinetic parameters of the stable pool (k2 and MRT2) were independent of the soil parameters, confirming that this pool was more recalcitrant.
Although the persistence of carbon against microbiological degradation is generally associated with high clay content, this was not fully supported by this study,
indicating that in real systems, such as soils, much more complex effects prevail, which means that SOM dynamics cannot be described by one soil parameter. The kinetic parameters of the carbon turnover of the various SOM pools could be important input parameters for environmental models, confirming the importance of research on the effect of soil parameters on the kinetics of SOM decomposition.
Acknowledgements
The authors are grateful to Klaudia Kiss and Péter Sipos for their help in the field.
Thanks are also due to Annamária Nagy, Anna Vancsik and the members of the MTA ATK TAKI laboratory for their help in the laboratory work. The authors are also
ACCEPTED MANUSCRIPT
grateful for the language editing of Barbara Harasztos. This work was supported by the European Union and the State of Hungary, co-financed by the European Regional Development Fund in the project of GINOP-2.3.2-15-2016-00009 ‘ICER’ and by a Bolyai János fellowship from the Hungarian Academy of Sciences to G. Jakab.
References
Addiscott, T.M., 1983. Kinetics and temperature relationships of mineralization and nitrification in Rothamsted soils with differing histories. J. Soil Sci. 34, 343–353.
https://doi.org/10.1111/j.1365-2389.1983.tb01040.x
Ahn, M.Y., Zimmerman, A.R., Comerford, N.B., Sickman, J.O., Grunwald, S., 2009.
Carbon mineralization and labile crganic carbon pools in the sandy soils of a north Florida watershed. Ecosystems 12, 672–685.
https://doi.org/10.1007/s10021-009-9250-8
Akaike, H., 1973. Information theory and an extension of the maximum likelihood principle. in: Petrov, B.N., Csaki, F. (Eds.), 2nd International Symposium on Information Theory. Akademia Kiado, Budapest, pp. 267-281.
Anderson, J.P.E., 1982. Soil respiration, in: Page, A.L. (Ed.), Methods of Soil
Analysis. Part 2. Chemical and Microbiological Properties. American Society of Agronomy, Madison, WI, pp. 831–871.
Aslam, D.N., VanderGheynst, J.S., Rumsey, T.R., 2008. Development of models for predicting carbon mineralization and associated phytotoxicity in compost- amended soil. Bioresour. Technol. 99, 8735–8741.
https://doi.org/10.1016/j.biortech.2008.04.074
Barré, P., Fernandez-Ugalde, O., Virto, I., Velde, B., Chenu, C., 2014. Impact of phyllosilicate mineralogy on organic carbon stabilization in soils: Incomplete
ACCEPTED MANUSCRIPT
knowledge and exciting prospects. Geoderma 235–236, 382–395.
https://doi.org/10.1016/j.geoderma.2014.07.029
Beauchamp, E.G., Reynolds, W.D., Brasche-Villeneuve, D., Kirby, K., 1986.
Nitrogen mineralization kinetics with different soil pretreatments and cropping histories. Soil Sci. Soc. Am. J. 50, 1478–1483.
https://doi.org/10.2136/sssaj1986.03615995005000060020x
Bengtsson, G., Bengtson, P., Månsson, K.F., 2003. Gross nitrogen mineralization-, immobilization-, and nitrification rates as a function of soil C/N ratio and microbial activity. Soil Biol. Biochem. 35, 143–154.
https://doi.org/10.1016/S0038-0717(02)00248-1
Bernal, M.P., Sánchez-Monedero, M.A., Paredes, C., Roig, A., 1998. Carbon mineralization from organic wastes at different composting stages during their incubation with soil. Agric. Ecosyst. Environ. 69, 175–189.
https://doi.org/10.1016/S0167-8809(98)00106-6
Bingemann, C.W., Varner, J.E., Martin, W.P., 1953. The effect of the addition of organic materials on the decomposition of an organic soil. Soil Science Society of America Proceedings 17, 34−38.
Blagodatskaya, E., Yuyukina, T., Blagodatsky, S., Kuzyakov, Y., 2011. Three-source- partitioning of microbial biomass and of CO2 efflux from soil to evaluate
mechanisms of priming effects. Soil Biol. Biochem. 43, 778–786.
https://doi.org/10.1016/j.soilbio.2010.12.011
Bonde, T.A., Rosswall, T., 1987. Seasonal variation of potentially mineralizable nitrogen in four cropping systems. Soil Sci. Soc. Am. J. 51, 1508–1514.
https://doi.org/10.2136/sssaj1987.03615995005100060019x
Burnham, K.P., Anderson, D.R., 2002. Model Selection and Multimodel Inference.
ACCEPTED MANUSCRIPT
Springer-Verlag, New York, 488 p.
Conklin, A.R.J., 2014. Introduction to Soil Chemistry: Analysis and Instrumentation, second edition. ed. John Wiley & Sons, Hoboken, New Jersey.
Delaune, R.D., Reddy, C.N., Patrick, W.H., 1981. Organic matter decomposition in soil as influenced by pH and redox conditions. Soil Biol. Biochem. 13, 533–534.
https://doi.org/10.1016/0038-0717(81)90045-6
Demeter, I., Makádi, M., Aranyos, T., Ferenczy, A., Posta, K., 2013. Microbial and chemical investigations of soils in organic and conventional farming in Nyírség region 11, 311–320.
El-Mahrouky, M., El-Naggar, A.H., Usman, A.R., Al-Wabel, M., 2015. Dynamics of CO2 emission and biochemical properties of a sandy calcareous soil amended with conocarpus waste and biochar. Pedosphere 25, 46–56.
https://doi.org/10.1016/S1002-0160(14)60075-8
Eusterhues, K., Rumpel, C., Kögel-Knabner, I., 2005. Organo-mineral associations in sandy acid forest soils: importance of specific surface area, iron oxides and micropores. Eur. J. Soil Sci. 56, 753–763. https://doi.org/10.1111/j.1365- 2389.2005.00710.x
Fernández, J.M., Plaza, C., Hernández, D., Polo, A., 2007. Carbon mineralization in an arid soil amended with thermally-dried and composted sewage sludges.
Geoderma 137, 497–503. https://doi.org/10.1016/j.geoderma.2006.10.013 Franzluebbers, A.J., 1999. Potential C and N mineralization and microbial biomass
from intact and increasingly disturbed soils of varying texture. Soil Biol.
Biochem. 31, 1083–1090. https://doi.org/10.1016/S0038-0717(99)00022-X Frøseth, R.B., Bleken, M.A., 2015. Effect of low temperature and soil type on the
ACCEPTED MANUSCRIPT
decomposition rate of soil organic carbon and clover leaves, and related priming effect. Soil Biol. Biochem. 80, 156–166.
https://doi.org/10.1016/j.soilbio.2014.10.004
Gee, G.W., Bauder, J.W., 1986. Particle-size analysis, in: Klute, A. (Ed.), Methods of Soil Analysis. American Society of Agronomy, Madison, pp. 383–411.
Gillman, G.P., 1979. A proposed method for the measurement of exchange properties of highly weathered soils. Aust. J. Soil Res. 17, 129–139.
Gu, B., Schmitt, J., Chen, Z., Liang, L., McCarthy, J.F., 1994. Adsorption and desorption of natural organic matter on iron oxide: mechanisms and models.
Environ. Sci. Technol. 28, 38–46. https://doi.org/10.1021/es00050a007 Hassink, J., 1997. The capacity of soils to preserve organic C and N by their
association with clay and silt particles. Plant Soil 191, 77–87.
https://doi.org/10.1023/A:1004213929699
Hassink, J., 1995. Density fractions of soil macroorganic matter and microbial
biomass as predictors of C and N mineralization. Soil Biol. Biochem. 27, 1099–
1108. https://doi.org/10.1016/0038-0717(95)00027-C
Holmgren, G.G.S., 1967. A rapid citrate-dithionite extractable iron procedure. Soil Sci. Soc. Am. J. 31, 210–211.
https://doi.org/10.2136/sssaj1967.03615995003100020020x
Hurvich, C.M., Tsai, C.-L., 1989. Regression and time series model selection in small samples. Biometrika 76, 297−307.
IPCC, 2013. Climate Change 2013: The Physical Science Basis. Contribution of Working Group I to the Fifth Assessment Report of the Intergovernmental Panel on Climate Change. Cambridge University Press, Cambridge, United Kingdom
ACCEPTED MANUSCRIPT
and New York, NY, USA.
Janzen, H.H., 2006. The soil carbon dilemma: Shall we hoard it or use it? Soil Biol.
Biochem. 38, 419–424. https://doi.org/10.1016/j.soilbio.2005.10.008
Jones, C.A., 1984. Estimation of an active fraction of soil nitrogen. Commun. Soil Sci. Plant Anal. 15, 23–32. https://doi.org/10.1080/00103628409367451
Kaiser, K., Guggenberger, G., 2003. Mineral surfaces and soil organic matter. Eur. J.
Soil Sci. 54, 219–236. https://doi.org/10.1046/j.1365-2389.2003.00544.x Kassam, A., Basch, G., Friedrich, T., Gonzalez, E., Trivino, P., Mkomwa, S., 2017.
Mobilizing greater crop and land potentials sustainably. Hungarian Geogr. Bull.
66, 3–11. https://doi.org/10.15201/hungeobull.66.1.1
Kuzyakov, Y., 2006. Sources of CO2 efflux from soil and review of partitioning methods. Soil Biol. Biochem. 38, 425–448.
https://doi.org/10.1016/j.soilbio.2005.08.020
Kuzyakov, Y., Friedel, J.K., Stahr, K., 2000. Review of mechanisms and quantification of priming effects. Soil Biol. Biochem. 32, 1485–1498.
https://doi.org/10.1016/S0038-0717(00)00084-5
Lal, R., 2004. Soil carbon sequestration impacts on global climate change and food security. Science (80-. ). 304, 1623–1627.
https://doi.org/10.1126/science.1097396
Levi-Minzi, R., Riffaldi, R., Saviozzi, A., 1990. Carbon mineralization in soil amended with different organic materials 31, 325–335.
Manzoni, S., Piñeiro, G., Jackson, R.B., Jobbágy, E.G., Kim, J.H., Porporato, A., 2012. Analytical models of soil and litter decomposition: Solutions for mass loss and time-dependent decay rates. Soil Biol. Biochem. 50, 66–76.
ACCEPTED MANUSCRIPT
https://doi.org/10.1016/j.soilbio.2012.02.029
Martín, J. V., Miralles De Imperial, R., Calvo, R., Garcia, M.C., Leon-Cófreces, C., Delgado, M.M., 2012. Carbon mineralisation kinetics of poultry manure in two soils. Soil Res. 50, 222–228. https://doi.org/10.1071/SR11170
McLauchlan, K.K., Hobbie, S.E., 2004. Comparison of labile soil organic matter fractionation techniques. Soil Sci. Soc. Am. J. 68, 1616–1625.
https://doi.org/10.2136/sssaj2004.1616
Molina, J.A.E., Clapp, C.E., Larson, W.E., 1980. Potentially mineralizable nitrogen in soil: The simple exponential model does not apply for the first 12 weeks of incubation. Soil Sci. Soc. Am. J. 44, 442–443.
https://doi.org/10.2136/sssaj1980.03615995004400020054x
Murayama, S., 1984. Decomposition kinetics of straw saccharides and synthesis of microbial saccharides under field conditions. J. Soil Sci. 35, 231–242.
https://doi.org/10.1111/j.1365-2389.1984.tb00279.x
Murwira, H.K., Kirchmann, H., Swift, M.J., 1990. The effect of moisture on the decomposition rate of cattle manure. Plant Soil 122, 197–199.
https://doi.org/10.1007/BF02851975
Pal, D., Broadbent, F.E., 1975. Influence of moisture on rice straw decomposition in soils. Soil Sci. Soc. Am. J. 39, 59–63.
https://doi.org/10.2136/sssaj1975.03615995003900010018x
Pengthamkeerati, P., Motavalli, P.P., Kremer, R.J., Anderson, S.H., 2005. Soil carbon dioxide efflux from a claypan soil affected by surface compaction and
applications of poultry litter. Agric. Ecosyst. Environ. 109, 75–86.
https://doi.org/10.1016/j.agee.2005.02.013
ACCEPTED MANUSCRIPT
Procter, A.C., Gill, R.A., Fay, P.A., Polley, H.W., Jackson, R.B., 2015. Soil carbon responses to past and future CO2 in three Texas prairie soils. Soil Biol. Biochem.
83, 66–75. https://doi.org/10.1016/j.soilbio.2015.01.012
Riffaldi, R., 1996. Carbon mineralization kinetics as influenced by soil properties.
Soils, Biol Fertil 293–298.
Riffaldi, R., Saviozzi, A., Levi-Minzi, R., 1996. Carbon mineralization kinetics as influenced by soil properties. Biol. Fertil. Soils 22, 293–298.
https://doi.org/10.1007/BF00334572
Saviozzi, A., Levi-Minzi, R., Riffaldi, R., 1993. Mineralization parameters from organic materials added to soil as a function of their chemical composition.
Bioresour. Technol. 45, 131–135.
Saviozzi, A., Vanni, G., Cardelli, R., 2014. Carbon mineralization kinetics in soils under urban environment. Appl. Soil Ecol. 73, 64–69.
https://doi.org/10.1016/j.apsoil.2013.08.007
Schmidt, M.W.I., Torn, M.S., Abiven, S., Dittmar, T., Guggenberger, G., Janssens, I.
a., Kleber, M., Kögel-Knabner, I., Lehmann, J., Manning, D. a. C., Nannipieri, P., Rasse, D.P., Weiner, S., Trumbore, S.E., 2011. Persistence of soil organic matter as an ecosystem property. Nature 478, 49–56.
https://doi.org/10.1038/nature10386
Schwertmann, U., 1973. Use of oxalate for Fe extraction from soils. Can. J. Soil Sci.
53, 244–246. https://doi.org/10.4141/cjss73-037
Seyfried, M.S., Rao, P.S.C., 1988. Kinetics of nitrogen mineralization in Costa Rican soils: Model evaluation and pretreatment effects. Plant Soil 106, 159–169.
https://doi.org/10.1007/BF02371210
ACCEPTED MANUSCRIPT
Shahbaz, M., Kuzyakov, Y., Heitkamp, F., 2017. Decrease of soil organic matter stabilization with increasing inputs: Mechanisms and controls. Geoderma 304, 76–82. https://doi.org/10.1016/j.geoderma.2016.05.019
Singh, J.S., Gupta, S.R., 1977. Plant decomposition and soil respiration in terrestrial ecosystems. Bot. Rev. 43, 449–528. https://doi.org/10.1007/BF02860844 Six, J., Elliott, E.T., Paustian, K., 1999. Aggregate and soil organic matter dynamics
under conventional and no-tillage systems. Soil Sci. 63, 1350–1358.
Sleutel, S., De Neve, S., Prat Roibás, M.R., Hofman, G., 2005. The influence of model type and incubation time on the estimation of stable organic carbon in organic materials. Eur. J. Soil Sci. 56, 505–514. https://doi.org/10.1111/j.1365- 2389.2004.00685.x
Smith, P., Falloon, P.D., 2000. Modelling refractory soil organic matter. Biol. Fertil.
Soils 30, 388–398. https://doi.org/10.1007/s003740050019
Stanford, G., Smith, S.J., 1972. Nitrogen mineralization potentials of soils. Soil Sci.
Soc. Am. J. 36, 465–472.
https://doi.org/10.2136/sssaj1972.03615995003600030029x
Stewart, C.E., Paustian, K., Conant, R.T., Plante, A.F., Six, J., 2007. Soil carbon saturation: concept, evidence and evaluation. Biogeochemistry 86, 19-31.
Tabatabai, M.A., Al-Khafaji, A.A., 1980. Comparison of nitrogen and sulfur mineralization in soils. Soil Sci. Soc. Am. J. 44, 1000–1006.
https://doi.org/10.2136/sssaj1980.03615995004400050026x
Tegen, I., Dörr, H., 1996. 14C measurements of soil organic matter, soil CO2 and dissolved organic carbon (1987–1992). Radiocarbon 38, 247–251.
https://doi.org/10.1017/S0033822200017628
ACCEPTED MANUSCRIPT
Thiessen, S., Gleixner, G., Wutzler, T., Reichstein, M., 2013. Both priming and temperature sensitivity of soil organic matter decomposition depend on microbial biomass - An incubation study. Soil Biol. Biochem. 57, 739–748.
https://doi.org/10.1016/j.soilbio.2012.10.029
Trumbore, S.E., 2000. Age of soil organic matter and soil respiration. Ecol. Appl. 10, 399–411.
Turrión, M.B., Lafuente, F., Mulas, R., López, O., Ruipérez, C., Pando, V., 2012.
Effects on soil organic matter mineralization and microbiological properties ofapplying compost to burned and unburned soils. J. Environ. Manage. 95, S245–S249. https://doi.org/10.1016/j.jenvman.2010.10.020
von Lützow, M., Kögel-Knabner, I., 2009. Temperature sensitivity of soil organic matter decomposition-what do we know? Biol. Fertil. Soils 46, 1–15.
https://doi.org/10.1007/s00374-009-0413-8
Wattel-Koekkoek, E.J.W., Buurman, P., Van Der Plicht, J., Wattel, E., Van Breemen, N., 2003. Mean residence time of soil organic matter associated with kaolinite and smectite. Eur. J. Soil Sci. 54, 269–278. https://doi.org/10.1046/j.1365- 2389.2003.00512.x
ACCEPTED MANUSCRIPT
FIGURE CAPTIONS
Figure 1 Location of the sampling sites. Numbers indicate the numbers of the samples. See Tables 1 and 2 for details.
ACCEPTED MANUSCRIPT
Figure 2 Cumulative carbon respiration during the 163-day incubation period for 13 soil samples. (a) Carbon respiration from soils amended with maize residues. Mean values with standard errors (n = 3). Very small errors are not depicted since error bars remained within the symbol. (b) Carbon respiration from control soils.
ACCEPTED MANUSCRIPT
Figure 3 PC1 and PC2 biplots of soil properties of 13 soil samples. (a) C1 of amended samples. (b) C1 of control samples. (c) k1 of amended samples. (d) k1 of control samples. Eigenvectors are doubled for better visualization.
ACCEPTED MANUSCRIPT
TABLES
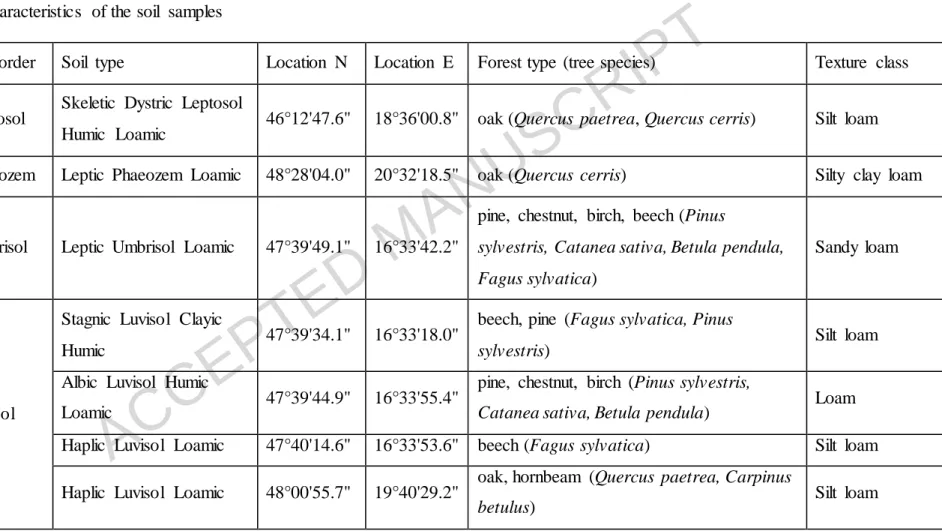
Table 1 Site characteristics of the soil samples
Code Soil order Soil type Location N Location E Forest type (tree species) Texture class BAT Leptosol Skeletic Dystric Leptosol
Humic Loamic 46°12'47.6" 18°36'00.8" oak (Quercus paetrea, Quercus cerris) Silt loam JOS1 Phaeozem Leptic Phaeozem Loamic 48°28'04.0" 20°32'18.5" oak (Quercus cerris) Silty clay loam
SOP3 Umbrisol Leptic Umbrisol Loamic 47°39'49.1" 16°33'42.2"
pine, chestnut, birch, beech (Pinus
sylvestris, Catanea sativa, Betula pendula, Fagus sylvatica)
Sandy loam
SOP1
Luvisol
Stagnic Luvisol Clayic
Humic 47°39'34.1" 16°33'18.0" beech, pine (Fagus sylvatica, Pinus
sylvestris) Silt loam
SOP2 Albic Luvisol Humic
Loamic 47°39'44.9" 16°33'55.4" pine, chestnut, birch (Pinus sylvestris,
Catanea sativa, Betula pendula) Loam SOP4 Haplic Luvisol Loamic 47°40'14.6" 16°33'53.6" beech (Fagus sylvatica) Silt loam
KIS Haplic Luvisol Loamic 48°00'55.7" 19°40'29.2" oak, hornbeam (Quercus paetrea, Carpinus
betulus) Silt loam
ACCEPTED MANUSCRIPT
KAR Haplic Luvisol Loamic 48°09'11.5" 19°46'20.6" oak, hornbeam (Quercus paetrea, Carpinus
betulus) Loam
CEG
Arenosol
Eutric Arenosol Humic 47°11'14.8" 19°40'55.2" oak (Quercus robur) Loamy sand NYIR1 Dystric Arenosol Ochric 47°31'40.0" 21°43'46.1" pine (Pinus sylvestris) Loamy sand NYIR2 Eutric Arenosol Humic 47°31'39.9" 21°43'54.0" oak, poplar (Quercus robur, Populus alba) Loamy sand
JOS2
Regosol
Dystric Regosol Clayic 48°28'16.1" 20°32'11.3" oak, hornbeam, beech (Quercus paetrea,
Carpinus betulus, Fagus sylvatica) Clay JOS3 Eutric Regosol Loamic 48°28'01.1" 20°32'21.0" oak, hornbeam (Quercus paetrea, Carpinus
betulus) Silt loam
ACCEPTED MANUSCRIPT
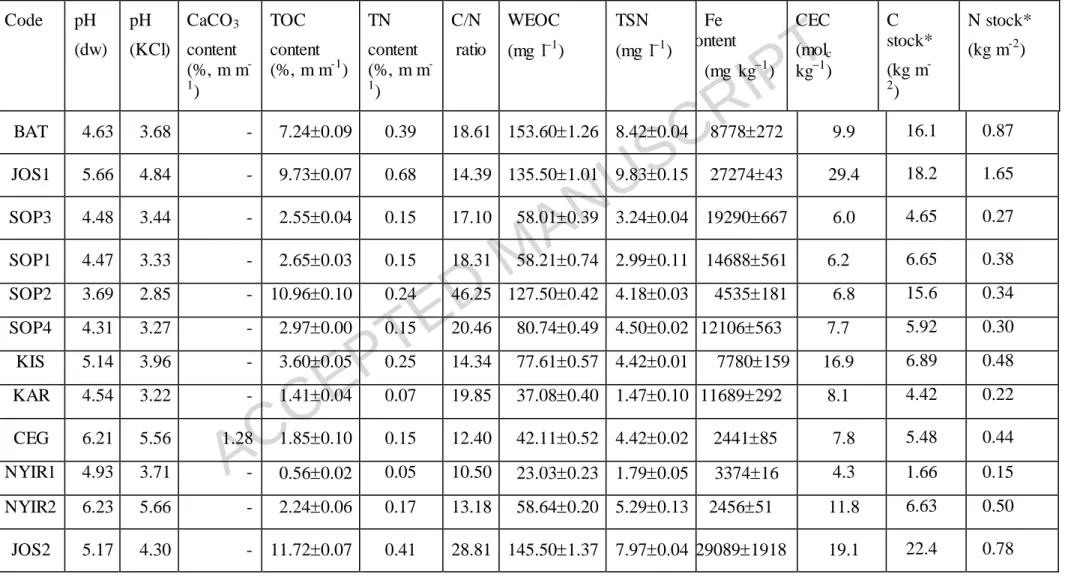
Table 2 Main chemical properties ( standard error) of the soils
Code pH (dw)
pH (KCl)
CaCO3 content (%, m m-
1)
TOC content (%, m m-1)
TN content (%, m m-
1)
C/N ratio
WEOC (mg l1)
TSN (mg l1)
Fe content
(mg kg1)
CEC (molc kg1)
C stock*
(kg m-
2)
N stock*
(kg m-2)
BAT 4.63 3.68 - 7.240.09 0.39 18.61 153.601.26 8.420.04 8778272 9.9 16.1 0.87
JOS1 5.66 4.84 - 9.730.07 0.68 14.39 135.501.01 9.830.15 2727443 29.4 18.2 1.65
SOP3 4.48 3.44 - 2.550.04 0.15 17.10 58.010.39 3.240.04 19290667 6.0 4.65 0.27
SOP1 4.47 3.33 - 2.650.03 0.15 18.31 58.210.74 2.990.11 14688561 6.2 6.65 0.38
SOP2 3.69 2.85 - 10.960.10 0.24 46.25 127.500.42 4.180.03 4535181 6.8 15.6 0.34
SOP4 4.31 3.27 - 2.970.00 0.15 20.46 80.740.49 4.500.02 12106563 7.7 5.92 0.30
KIS 5.14 3.96 - 3.600.05 0.25 14.34 77.610.57 4.420.01 7780159 16.9 6.89 0.48
KAR 4.54 3.22 - 1.410.04 0.07 19.85 37.080.40 1.470.10 11689292 8.1 4.42 0.22
CEG 6.21 5.56 1.28 1.850.10 0.15 12.40 42.110.52 4.420.02 244185 7.8 5.48 0.44
NYIR1 4.93 3.71 - 0.560.02 0.05 10.50 23.030.23 1.790.05 337416 4.3 1.66 0.15
NYIR2 6.23 5.66 - 2.240.06 0.17 13.18 58.640.20 5.290.13 245651 11.8 6.63 0.50
JOS2 5.17 4.30 - 11.720.07 0.41 28.81 145.501.37 7.970.04 290891918 19.1 22.4 0.78
ACCEPTED MANUSCRIPT
JOS3 5.92 5.53 - 3.950.03 0.29 13.45 88.120.76 7.290.13 1806290 16.9 8.99 0.66
TOC: total organic carbon; TN: total nitogen, WEOC: water extractable organic carbon; TSN: total soluble nitrogen; CEC: cation exchange capacity.
*C ans N stocks calculated from the bulk density of undisturbed samples for the upper 20 cm layer of the soils.
Soils are separated by each other with dashed lines according to their soil order as follows: BAT – Leptosol; JOS1 – Phaeozem; SOP3 – Umbrisol; SOP1, SOP2, SOP4, KIS and KAR – Luvisol; CEG, NYIR1 and NYIR2 – Arenosol; JOS2 and JOS3 – Regosol.
ACCEPTED MANUSCRIPT
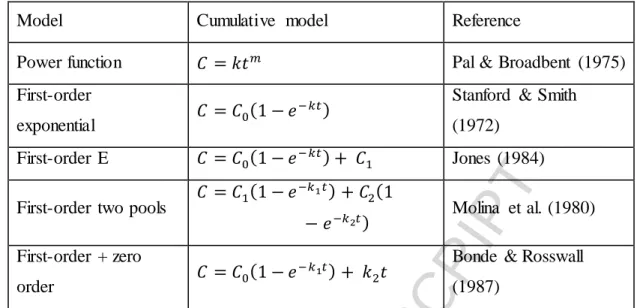
Table 3 The five kinetic models applied
Model Cumulative model Reference
Power function 𝐶 = 𝑘𝑡𝑚 Pal & Broadbent (1975)
First-order
exponential 𝐶 = 𝐶0(1 − 𝑒−𝑘𝑡) Stanford & Smith (1972)
First-order E 𝐶 = 𝐶0(1 − 𝑒−𝑘𝑡) + 𝐶1 Jones (1984) First-order two pools 𝐶 = 𝐶1(1 − 𝑒−𝑘1𝑡) + 𝐶2(1
− 𝑒−𝑘2𝑡) Molina et al. (1980) First-order + zero
order 𝐶 = 𝐶0(1 − 𝑒−𝑘1𝑡) + 𝑘2𝑡 Bonde & Rosswall (1987)
C: cumulative carbon mineralized over t time; C0: potentially mineralizable carbon;
C1: easily mineralizable carbon pool; C2: slowly mineralizable carbon pool; t: time from start of the incubation; k: decomposition rate constant; m: rate constant characterizing the shape of the curve.
ACCEPTED MANUSCRIPT
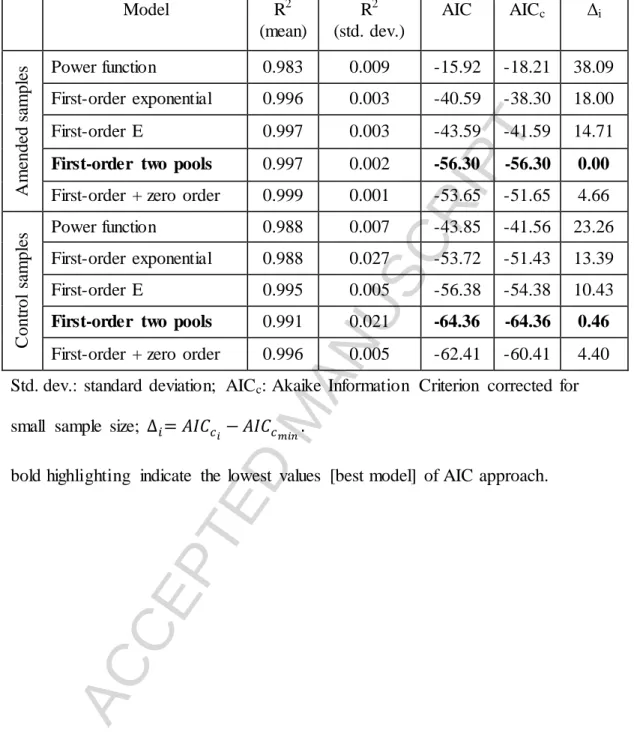
Table 4 Coefficients of determination (R2) and Akaike’s Information Criterion (AIC) used to compare the 5 different kinetic models
Model R2
(mean)
R2 (std. dev.)
AIC AICc Δi
Amended samples Power function 0.983 0.009 -15.92 -18.21 38.09 First-order exponential 0.996 0.003 -40.59 -38.30 18.00
First-order E 0.997 0.003 -43.59 -41.59 14.71
First-order two pools 0.997 0.002 -56.30 -56.30 0.00 First-order + zero order 0.999 0.001 -53.65 -51.65 4.66
Control samples Power function 0.988 0.007 -43.85 -41.56 23.26 First-order exponential 0.988 0.027 -53.72 -51.43 13.39
First-order E 0.995 0.005 -56.38 -54.38 10.43
First-order two pools 0.991 0.021 -64.36 -64.36 0.46 First-order + zero order 0.996 0.005 -62.41 -60.41 4.40 Std. dev.: standard deviation; AICc: Akaike Information Criterion corrected for small sample size; ∆𝑖= 𝐴𝐼𝐶𝑐
𝑖− 𝐴𝐼𝐶𝑐
𝑚𝑖𝑛.
bold highlighting indicate the lowest values [best model] of AIC approach.
ACCEPTED MANUSCRIPT
Table 5 Estimated kinetic parameters of the first-order two pools model (Molina et al., 1980) forthe amended soil samples
Soil C1
(g kg1)
C2
(g kg1)
k1
(day1)
k2
(day1)
C1% C1k1
(g kg1 day1)
C2k2
(g kg1 day1)
MRT1
(day)
MRT2
(day)
BAT 1.488 19.280 0.096 0.013 7.165 0.143 0.257 10.4 75.0
JOS1 1.048 9.183 0.170 0.020 10.243 0.178 0.183 5.9 50.2
SOP3 0.054 8.284 0.017 0.016 0.653 0.001 0.135 60.4 61.4
SOP1 0.346 6.185 0.393 0.019 5.299 0.136 0.117 2.6 53.1
SOP2 0.012 9.173 0.018 0.012 0.134 2.18 × 10⁴ 0.114 56.5 80.7
SOP4 1.711 5.987 0.033 0.017 22.227 0.056 0.101 30.5 59.4
KIS 0.855 7.859 0.080 0.017 9.809 0.069 0.135 12.5 58.2
KAR 0.228 6.070 0.009 0.009 3.614 0.002 0.055 114.9 110.5
CEG 2.20 × 10⁷ 9.682 0.024 0.021 2.27 × 10⁶ 5.34 × 10⁹ 0.200 41.2 48.4
NYIR1 1.52 × 10⁵ 6.076 0.018 0.012 2.51 × 10⁴ 2.79 × 10⁷ 0.072 54.7 83.9
NYIR2 0.077 7.617 0.148 0.018 1.006 0.011 0.140 6.8 54.6
JOS2 1.063 10.210 0.088 0.017 9.430 0.093 0.171 11.4 59.7
JOS3 0.833 7.143 0.149 0.019 10.443 0.124 0.138 6.7 51.7
ACCEPTED MANUSCRIPT
C1: size of the easily mineralizable carbon pool; C2: size of the slowly mineralizable carbon pool; k1: decomposition rate constant of the easily mineralizable carbon pool; k2: decomposition rate constant of the slowly mineralizable carbon pool; C1%: percentage of easily mineralizable carbon relative to the total mineralizable carbon (C1 + C2); C1k1: initial potential rate of carbon mineralization of the easily mineralizable carbon pool; C2k2: initial potential rate of carbon mineralization of the slowly mineralizable carbon pool; MRT1: mean residence time of the easily mineralizable carbon pool; MRT2: mean residence time of the slowly mineralizable carbon pool.
Soils are separated by each other with dashed lines according to their soil order as follows: BAT – Leptosol; JOS1 – Phaeozem; SOP3 – Umbrisol; SOP1, SOP2, SOP4, KIS and KAR – Luvisol; CEG, NYIR1 and NYIR2 – Arenosol; JOS2 and JOS3 – Regosol.
ACCEPTED MANUSCRIPT
Table 6 Estimated kinetic parameters of the first-order two pools model (Molina et al., 1980) for the control soil samples
Soil C1
(g kg1)
C2
(g kg1)
k1
(day1)
k2
(day1)
C1% C1k1
(g kg1 day1)
C2k2
(g kg1 day1)
MRT1
(day)
MRT2
(day)
BAT 1.211 17.130 0.068 0.012 6.603 0.082 0.202 14.8 84.8
JOS1 0.437 7.362 0.189 0.012 5.601 0.083 0.091 5.3 81.3
SOP3 1.03 × 10⁶ 6.322 0.007 0.006 1.63 × 10⁵ 7.106 × 10⁹ 0.039 145.2 160.1
SOP1 3.91 × 10⁷ 2.853 0.013 0.012 1.37 × 10⁵ 4.899 × 10⁹ 0.033 79.8 85.8
SOP2 0.524 5.143 0.546 0.012 9.248 0.286 0.060 1.8 85.7
SOP4 0.028 4.042 0.235 0.015 0.686 0.007 0.060 4.3 67.3
KIS 7.18 × 10⁵ 4.801 0.024 0.011 0.001 1.700 × 10⁶ 0.055 42.3 87.4
KAR 2.35 × 10¹² 2.316 0.010 0.010 1.01 × 10¹⁰ 2.390 × 10¹⁴ 0.023 98.2 100.0
CEG 0.001 2.559 0.010 0.009 0.028 6.715 × 10⁶ 0.024 105.0 106.5
NYIR1 0.006 1.369 0.013 0.013 0.400 7.373 × 10⁵ 0.018 74.6 75.1
NYIR2 3.18 × 10⁶ 3.798 0.016 0.009 1.00 × 10⁴ 6.044 × 10⁸ 0.036 63.1 106.3
JOS2 0.735 8.740 0.077 0.013 7.759 0.057 0.116 13.0 75.2
JOS3 0.434 4.975 0.031 0.009 8.020 0.013 0.045 32.5 109.9