1
Feasibility of quaternary ammonium and 1,4-diazabicyclo[2.2.2]octane- 1
functionalized anion-exchange membranes for biohydrogen production in 2
microbial electrolysis cells 3
4
René Cardeña1, Jan Žitka2, László Koók3, Péter Bakonyi3, Lukáš Pavlovec2, 5
Miroslav Otmar2, Nándor Nemestóthy3, Germán Buitrón1,*
6 7
1 Laboratory for Research on Advanced Processes for Water Treatment, Instituto 8
de Ingeniería, Unidad Académica Juriquilla, Universidad Nacional Autónoma de 9
México, Blvd. Juriquilla 3001, Querétaro, Qro., México, 76230 10
2 Institute of Macromolecular Chemistry, AS CR, Heyrovsky Sq. 2, 162 06 Prague 11
6, Czech Republic 12
3 Research Institute on Bioengineering, Membrane Technology and Energetics, 13
University of Pannonia, Egyetem ut 10, 8200 Veszprém, Hungary 14
15 16
*Corresponding author: Germán Buitrón 17
E-mail: gbuitronm@ii.unam.mx 18
19
2 Abstract
20 21
In this work, two commercialized anion-exchange membranes (AEMs), AMI-7001 22
and AF49R27, were applied in microbial electrolysis cells (MECs) and compared 23
with a novel AEM (PSEBS CM DBC, functionalized with 1,4- 24
diazabicyclo[2.2.2]octane) to produce biohydrogen. The evaluation regarding the 25
effect of using different AEMs was carried out using simple (acetate) and complex 26
(mixture of acetate, butyrate and propionate to mimic dark fermentation effluent) 27
substrates. The MECs equipped with various AEMs were assessed based on their 28
electrochemical efficiencies, H2 generation capacities and the composition of 29
anodic biofilm communities. pH imbalances, ionic losses and cathodic 30
overpotentials were taken into consideration together with changes to substantial 31
AEM properties (particularly ion-exchange capacity, ionic conductivity, area- and 32
specific resistances) before and after AEMs were applied in the process to 33
describe their potential impact on the behavior of MECs. It was concluded that the 34
MECs which employed the PSEBS CM DBC membrane provided the highest H2
35
yield and lowest internal losses compared to the two other separators. Therefore, it 36
has the potential to improve MECs.
37 38
Keywords: microbial electrolysis cell; biohydrogen; anion-exchange membrane;
39
volatile fatty acids; microbial community analysis; internal losses 40
3 1. Introduction
41 42
In bioelectrochemical technologies, e.g. microbial fuel cells (MFCs) [1-3], 43
microbial synthesis cells (MSC) [4-5], microbial desalination cells (MDC) [6] and 44
microbial electrohydrogenesis cells (MEC) [7-8], the system architecture, in 45
particular the type and properties of the membrane separator applied between the 46
electrode chambers, can play a notable role in terms of process performance [9- 47
11]. The membrane, as a physical barrier, contributes to the adequate separation 48
of anodic and cathodic reactions while allowing the required passage of ionic 49
species, e.g. H+ or OH-, that maintain charge balancing and operation of the cell 50
[12].
51
Researchers have shown, e.g. Harnisch and Schröder [13] and Sleutels et 52
al. [14], that the transfer of H+ or OH- across an ion-exchange membrane (IEM) 53
may be suppressed due to competition with other ions, namely sodium, potassium 54
and calcium, present in relatively higher concentrations in the electrolyte solutions.
55
Besides, the transport of both cations and anions other than H+ or OH- across a 56
membrane can develop a pH gradient between the electrodes as well as 57
unfavorable potential losses, which negatively affect the external energy demand 58
of MECs needed to produce hydrogen gas [14]. To mitigate these side effects, a 59
suitable IEM should be chosen. According to the findings by Sleutels et al. [14], 60
MECs installed with AEMs may achieve higher operational efficiencies as a result 61
of the more advantageous ratio of energy (voltage) input to membrane-associated 62
energy losses. Experimental studies by Rozendal et al. [15-16], Cheng and Logan 63
[17] and Ye and Logan [18] also proposed the deployment of AEM rather than 64
CEM in MECs to reduce the imbalance in pH across the membrane and enhance 65
the process. For example, the volumetric productivity of an MEC unit that 66
employed an AEM was 2.1 LH2 L-1 d-1, more than 5 times higher than the MEC that 67
employed a CEM which attributed to the lower (internal) ion transport resistance of 68
AEM-MEC [19]. Besides, in our recent work, a bioelectrochemical system (BES) in 69
an MFC configured with PSEBS CM DBC AEM (polystyrene-block-poly(ethylene- 70
ran-butylene)-block-polystyrene functionalized with 1,4-diazabicyclo[2.2.2]octane) 71
notably outperformed those that employed either Nafion or AN-VPA 60 CEM [20], 72
indicating the potential of this membrane material to improve microbial 73
electrochemical technology. However, the PSEBS CM DBC AEM has been tested 74
only in MFC-type BESs, where the current densities are generally moderate or low.
75
Hence, it may be worth elaborating on the viability of this separator in applications 76
that apply higher current densities and products other than electricity. In this way, 77
more relevant feedback may be obtained regarding the potential of PSEBS CM 78
DBC AEMs in various BESs. Driven by this motivation, to take a step forward and 79
continue this proposed line of research, a comparative evaluation regarding the H2
80
production capacities and electrochemical behavior of MECs in which PSEBS CM 81
4
DBC is applied was conducted with two commercialized AEMs, namely AMI-7001 82
and AF49R27 (MEGA, Czech Republic) as references. The comprehensive 83
assessment of these MECs – fed either with a pure or mixed substrates (acetate 84
vs. a mixture of volatile fatty acids (VFAs)) – was carried out by (i) evaluating the 85
performance of the MEC (namely in terms of current density, H2 production rate 86
and yield, Coulombic efficiency and cathodic H2 recovery), (ii) microbial community 87
analysis of anodic biofilms and (iii) estimating pH-related as well as ionic voltage 88
losses for the various AEMs. Moreover, all the membranes used were compared 89
based on their operational stability. This is definitely a research gap as papers 90
concerning changes to significant membrane properties before and after use in 91
BESs are few and far between.
92
In accordance with the above, this work can provide new insights into the 93
significance of membranes in MECs to produce H2 with an increased degree of 94
efficacy and enhance our understanding of the relationship between the behaviors 95
of MECs and features of membranes.
96 97
2. Materials and Methods 98
99
2.1. Bioelectrochemical reactors 100
101
Two-chamber bioelectrochemical reactors (Fig. 1) made of acrylic were 102
used with a working volume of 400 mL per chamber. The anode was composed of 103
graphite felt (Brunssen de Occidente, S.A. de C.V.). The active surface area was 104
approximately 9.3∙10-4 m2 (by applying specifications from the supplier 129 cm2 g-1) 105
and 0.006 m2 for the projected area. The cathode was composed of nickel foam (5 106
cm x 5 cm, Sigma-Aldrich Corp., St. Louis, MO) with titanium wire acting as the 107
current conductor. The membranes were located between the two chambers and 108
the geometric surface area of the membranes was 5.5 cm x 5.5 cm. Neoprene 109
seals were used to hold the membrane and tightly shut the reactor. The anode and 110
cathode were placed at a distance of 0.5 cm and 0.9 cm from the membrane, 111
respectively.
112 113
2.2. Anion-Exchange Membranes (AEM) 114
115
Three different AEMs were applied in the experiments. AMI-7001 116
(Membranes International Inc., Glen Rock, NJ) was pretreated at 40 °C in a 5 % 117
NaCl solution for 24 h as recommended by the manufacturer. AF49R27 is a 118
heterogeneous anion-exchange membrane (MEGA Inc., Czech Republic). PSEBS 119
CM DBC is a homogenous anion-exchange membrane based on the block 120
copolymer PSEBS (polystyrene-block-poly(ethylene-ran-butylene)-block- 121
5
polystyrene), functionalized with 1,4-diazabicyclo[2.2.2]octane and prepared 122
according to Hnát et al. [21].
123 124
2.3. Membrane characterization 125
126
The properties of both pristine and used membranes were measured. The 127
surface of each used membrane was first mechanically cleaned before the 128
samples were conditioned as described in Section 2.3.1.
129 130
2.3.1. Ion-exchange capacity 131
132
The ion-exchange capacity (IEC) was determined twice for each membrane 133
sample by titration [22-23]. The dry membrane samples (~0.5 g) were conditioned 134
for 24 hours in a 1M NaOH solution before being washed with Q water to extract 135
excess NaOH. By successively using HCl and NaOH, these steps were repeated 136
twice to transform the AEMs into the OH- form.
137
The samples of AEMs (~0.5 g) were dried at 35°C under a vacuum in 138
Erlenmeyer flasks before their constant weights were measured. Subsequently, 15 139
mL of 4 % NaNO3 solution was added to the dry samples, which were then shaken 140
for 24 hours. 30 mL UV ethanol was added to 10 mL of this solution before 141
extracting 2 mL from this sample to which 2 drops of 30 % HClO4 and 3 drops of 142
diphenylcarbazide (1 %) were added. Finally, the number of displaced chloride ions 143
was titrated by 0.01 N Hg(ClO4)2. The color shift between light yellow and pink- 144
violet indicated the end point of the titration.
145 146
2.3.2. Membrane resistance and ionic conductivity 147
148
Four-electrode impedance spectroscopy was applied to determine the 149
resistance (R) of the membranes by using a potentiostat/galvanostat Metrohm 150
Autolab PGSTAT302N, platinum working and Ag/AgCl reference electrodes [24- 151
25]. Equilibrated membrane samples (of 14.5 mm in diameter) were placed 152
between chambers of 25 mL in volume, which were filled with a 0.5 M KCl solution.
153
The temperature of the system was kept constant at 25°C. During the 154
measurements, a frequency range of 8 ∙ 105 – 1 Hz and a current of 1 mA were 155
applied. The area resistance (RA = R∙A), specific resistance (RS = RA∙L-1) and ionic 156
conductivity ( = RS-1) of each membrane were calculated with regard to the 157
apparent surface area (A) and thickness (L) of the samples. The average thickness 158
was derived from parallel measurements taken at multiple points on each 159
membrane by an analog micrometer.
160 161
2.4. MEC start-up and operation 162
6 163
At start-up, by using 20 g of anaerobic granular sludge per liter (to treat 164
wastewater from a beer factory in México) as the inoculum, the compartments of 165
the MEC were flushed with N2 gas to facilitate anaerobic conditions. The 166
experiments were performed at 30 °C. The anodic and cathodic chambers were 167
continuously mixed by using magnetic stirrers (175 rpm). The pH of the anolyte 168
was initially set at 8 for each MEC cycle. A 125 mM NaCl solution was used as the 169
catholyte without adjusting the pH [26-27]. From cycle to cycle throughout the 170
experiments in this work, the anolyte and catholyte were replaced with a fresh 171
medium/solution.
172
The colonization of the anode was followed by the determination of the 173
current density profiles [28]. Graphite felt functioned as the working electrode 174
(anode) and nickel foam as the counter electrode (cathode, place of hydrogen 175
evolution) were separated by the membrane. The applied anode potential (Ean) 176
was adjusted to +200 mV by a potentiostat/galvanostat VSP/Z-01 (Bio-Logic 177
Science Instruments, France), which facilitates the enrichment of Geobacter spp. in 178
electro-active biofilms [29-30]. All potential values are given against a Ag/AgCl 179
reference electrode (3 M KCl, +210 mV against SHE, Radiometer Analytical SAS) 180
placed in the anodic chamber.
181
MECs that applied the three membranes (AMI-7001, AF49R27, PSEBS CM 182
DBC) were operated simultaneously. The fair reproducibility of each experiment 183
under the influence of the same substrate loadings is reflected in the current 184
density profiles (Fig. 2) [31], which seemed to be somewhat dependent on the 185
membrane.
186
In total, an acclimation period of 40 days was ensured for the anodic biofilm 187
formation to take place as follows. A week after inoculation, the MECs for all three 188
membranes (AMI-7001, AF49R27, PSEBS CM DBC), which were fed repeatedly 189
with 1 gCOD L-1 using acetate as a substrate, began producing current and by the 190
21st day, more or less similar current densities and hydrogen production capacities 191
were observed. Stabilization of the reactors – interpreted as the initial colonization 192
(biofilm formation) period – was noted after approximately one month of operation, 193
therefore, further experiments using various pure and complex substrates were 194
conducted as follows (evaluated in Section 3). At the end of the colonization stage 195
(40 days), the anaerobic granular sludge (inoculum) was removed from the anode 196
chambers of the MECs.
197
In the stabilized MECs (Fig. 2), the substrate in the anolyte was modified 198
over two consecutive stages: (i) 1 gCOD L-1 using acetate as a substrate for the first 199
stage and subsequently (ii) 1 gCOD L-1 in a mixture of volatile fatty acids (VFAs) (57 200
% butyrate, 30 % acetate and 13 % propionate to mimic the effluent of a dark 201
fermentative H2-producing bioreactor) was applied instead of just acetate. The 202
proportion of VFAs was obtained based on a literature review of acidogenic 203
7
effluents produced from dark fermentation [32-38]. Regardless of the type of 204
substrate, the MECs equipped with the various AEMs were kept running for at least 205
7 cycles. The operation time for each cycle was 24 hours. Overall, the experiments 206
were conducted for 60 days, including 40 days to form the electroactive biofilm and 207
20 days to evaluate the substrates in terms of MEC performance using the three 208
different AEMs.
209
Besides the actual substrate, throughout the entire MEC operation, each 210
liter of anolyte was comprised of: 4.58 g Na2HPO4, 2.45 g NaH2PO4∙H2O, 0.31 g 211
NH4Cl, 0.13 g KCl, 12.5 mL of trace elements and 5 mL of vitamin solutions. Each 212
liter of the solution of trace elements contained: 3.0 g MgSO4, 0.5 g MnSO4∙H2O, 213
1.0 g NaCl, 0.1 g FeSO4∙7H2O, 0.1 g CaCl2∙2H2O, 0.1 g CoCl2∙6H2O, 0.13 g ZnCl2, 214
0.01 g CuSO4∙5H2O, 0.01 g AlK(SO4)2∙12H2O, 0.01 g H3BO3, 0.025 g Na2MoO4, 215
0.024 g NiCl2∙6H2O and 0.025 g Na2WO4∙2H2O. Each liter of the solution of 216
vitamins contained: 10 mg pyridoxine, 5 mg p-Aminobenzoic acid, 5 mg nicotinic 217
acid, 5 mg riboflavin, 5 mg thiamine, 2 mg biotin and 2 mg folic acid.
218 219
2.5. Analytical methods 220
221
The composition of the biogas (CH4, CO2, and H2) was analyzed using a SRI 222
8610C gas chromatograph equipped with a thermal conductivity detector and a 30- 223
m-long (0.53 mm ID) Carboxen-1010 PLOT column. The operating conditions were 224
set as follows: the carrier gas was nitrogen at a flow rate of 4.5 mL/min; the 225
temperature of the injector was 200 °C, the column was tempered at 100 °C and 226
the temperature of the detector was fixed at 230 °C. The pH was measured at the 227
starting point and endpoint of every batch by an Oakton pH meter. The Chemical 228
Oxygen Demand (COD) was measured spectrophotometrically (using the Hach 229
435 and 430 methods). The volume of the biogas was measured by a 230
displacement method using an inverted measuring cylinder filled with an acidified 231
(pH=2) and saturated solution of NaCl.
232 233
2.6. Assessment of microbial populations 234
235
The microbial community analysis was carried out (i) at the end of the MEC 236
operation with acetate (as a model substrate) and consecutively, and (ii) at the end 237
of the experiment with the mixture of VFAs (mimicking a real substrate). First, the 238
biofilm was scraped off the graphite felt anode, and the obtained biomass was 239
further used to extract the bacterial genomic DNA using a DNeasy PowerSoil Pro 240
Kit (QIAGEN, Carlsbad, CA) following the manufacturer's instructions. The 241
resulting DNA was treated according to procedures described previously by 242
Hernández et al. [39] in terms of the selection of markers, primers, amplification 243
and Polymerase Chain Reaction (PCR) steps, reaction conditions, sequencing, as 244
8
well as bioinformatic and metagenomic tools. Besides anodic samples of MECs, 245
the microbiological composition of the initial seed source was also determined.
246 247
2.7. Calculations 248
249
The electrochemical parameters were calculated at the end of every batch, 250
the duration of each was 24 h. The projected surface of the anode was used to 251
calculate the geometric current density (j / A m-2) by assuming that during 252
production the maximum current was sustained for a period of 4 h on average (I, in 253
the unit of Ampers) in each batch cycle. The MEC performance was characterized 254
by measures outlined in Eqs. 1-3 in accordance with Logan et al. [7].
255 256
Coulombic efficiency (CE / %), Eq. 1:
257 258
CE =(∫ Idt
t
t−0 )MO2
4F∆COD ∙ 100 (1) 259
260
where MO2 denotes the molecular weight of oxygen (32 g mol-1), F represents the 261
Faraday constant (96,485 C mol-1 e-), and ΔCOD (g) stands for the COD mass 262
equivalent of substrate consumed.
263 264
Cathodic hydrogen recovery (rcat / %), Eq. 2:
265 266
rcat= 2F nH2
(∫t−0t Idt) ∙ 100 (2) 267
268
where nH2 denotes the actual moles of hydrogen gas recovered at the cathode.
269 270
For estimating the hydrogen yield (YH2 / mLH2 gCOD-1) Eq. 3 was employed:
271 272
YH2 = VH2
∆COD (3)
273 274
where VH2 denotes the amount of hydrogen produced (mL). The volumetric 275
hydrogen production rate was calculated from the working volume of the cathode 276
chamber and duration of the operating cycle (Q / mLH2 Lcat-1 d-1).
277 278
9 3. Results and Discussion
279 280
3.1. Effects of membranes and substrates in stabilized MECs 281
282
3.1.1. Current densities and volumetric H2 production rates 283
284
Chronoamperometric measurements were conducted to evaluate the time 285
course of MEC performance using different AEMs and substrates (Fig. 2). AMI- 286
7001 yielded the least stable current densities (Fig. 2A), while the MEC with 287
AF49R27 exhibited the highest values with an increase in j within the last four 288
batches of acetate (Fig. 2B). The PSEBS CM DBC membrane exhibited the most 289
consistent current densities throughout the experiment (Fig. 2C) by and large 290
independent from the type of substrate used. It was observed in general that the 291
first cycle using the mixture of VFAs, regardless of the membrane applied, resulted 292
in a drop in j, which, however, was temporary as the current density gradually 293
recovered within all three MECs using the various AEMs.
294
The mean current densities achieved in the given MECs using acetate as a 295
substrate are shown in Fig. 3A. As can be seen, among the 3 anion-exchange 296
membranes, AF49R27 produced the highest mean current density (9.4 ± 0.9 A m- 297
2), while the lowest values were recorded using PSEBS CM DBC (6.4 ± 0.4 A m-2).
298
The change in substrate (from acetate to the mixture of VFAs) seemed to affect the 299
current density in the MECs that used the membranes AMI-7001 (7.1 ± 1.9 A m-2) 300
and AF49R27 (7.4 ± 0.7 A m-2), but not for MECs that employed the separator 301
PSEBS CM DBC (Fig. 3B). The highest current densities achieved in the case of 302
AF49R27 may be the result of the minimum resistance – in other words, maximum 303
ionic conductivity – of this membrane (evaluated in Section 3.4 and summarized in 304
Table 2).
305
Considering the fact that – in contrast to the membranes AMI-7001 and 306
AF49R27 – the MEC equipped with PSEBS CM DBC was less sensitive to 307
changes to the substrate, the nature of these membranes should be addressed.
308
PSEBS CM DBC is a homogenous non-reinforced membrane prepared by solution 309
casting and solvent evaporation from one kind of material. AF49R27 and AMI-7001 310
are heterogeneous membranes formed from a cross-linked ion-exchange resin 311
dispersed in an inert polymer (AF49R27) and a reinforced cross-linked membrane 312
(AMI-7001). Therefore, different ion transport kinetics are expected for various 313
substrates in the case of homogeneous and heterogeneous membranes. Usually, 314
homogeneous membranes are less affected by such changes. Overall, the 315
aforementioned observations could be attributed to such basic differences between 316
the membrane materials applied.
317
The values of j and Q obtained (Fig. 3A) exhibited similar tendencies when 318
using acetate as a single substrate, indicating that electrons harvested at the 319
10
anode were used proportionally at the cathode to generate H2 [7]. For the feed that 320
consisted of a mixture of VFAs, in MECs that applied the membranes AF49R27 321
and PSEBS CM DBC, the values of Q decreased remarkably by 24 and 23 %, 322
respectively (Fig. 3B).
323
In another work where the membrane Fumasep® FKE (FuMA-Tech GmbH, 324
Germany) was applied, a productivity of 2.1 LH2 L-1 d-1, and current density of 5.3 ± 325
0.5 A m-2 were obtained [14]. Besides, Carmona-Martínez et al. [28] achieved 326
current densities of 10.6 A m-2 (199.1 A m-3) and a maximum productivity of 0.9 LH2
327
L-1 d-1 in a tubular reactor using acetate (6.4 g L-1) and AEM as a separator (FAA- 328
PK, FuMA-Tech GmbH, Germany). Furthermore, Nam and Logan presented 329
results similar to ours (current density of 131 ± 12 A m-2 and productivity of 1.6 ± 330
0.2 LH2 L-1 d-1) by using the membrane AMI-7001 in MECs [26].
331 332
3.1.2. Hydrogen yield, Coulombic efficiency, cathodic hydrogen recovery 333
and organic matter removal 334
335
The hydrogen yield facilitates the evaluation of MECs by correlating the H2
336
produced based on the organic matter consumed. By taking into consideration the 337
hydrogen yield produced by the MECs with different separators when acetate is the 338
substrate (Fig. 4), the hierarchy of performance is as follows: PSEBS CM DBC 339
(1117 ± 68 mLH2 gCOD-1), AF49R27 (862 ± 108 mLH2 gCOD-1) and AMI-7001 (847 ± 340
116 mLH2 gCOD-1). The MEC assembled with the membrane PSEBS CM DBC 341
produced the highest yield and represented approximately 79 % of the theoretical 342
maximum yield (1419 mLH2 gCOD-1) [7]. Changing the substrate from acetate to a 343
VFA feedstock did not have a significant effect on the H2 yield, irrespective of the 344
membrane used.
345
In other studies, hydrogen yields of 1135 mLH2 gCOD-1 (AMI-7001) [26] and 346
1478 mLH2 gCOD-1 (Fumasep FAA AEM) [40] were accomplished using acetate and 347
the acidic effluents of wastewater from fruit juice, respectively.
348
In terms of the CE (Fig. 5), no significant differences were recorded for the 349
MECs operated using acetate as a substrate: AMI-7001 (69 ± 10 %) and AF49R27 350
(63 ± 3 %). Nevertheless, the best electron capture efficiency was associated with 351
the application of PSEBS CM DBC (85 ± 6 %). Generally, the change in the type of 352
substrate employed had little effect on the CE. When evaluating the values 353
concerning the removal of organic matter, a remarkable increase was observed in 354
the case of the MEC equipped with AMI-7001 after switching the substrate from 355
acetate to the VFA mixture (69 ± 4 % vs. 78 ± 2 %), while the other MECs 356
exhibited similar levels of COD removal using both substrates.
357
By comparison, CE in excess of 70 % was observed using an acidogenic 358
effluent (composed of mainly acetate and butyrate) in an MEC that employed the 359
membrane Fumasep FAA (FuMA-Tech BWT GmbH, Germany), moreover, COD 360
11
removal and rcat of 72 % and 101 %, respectively were achieved using a Pt-Ir 361
(90:10 %) cathode and applying a Ean= +0.2 V vs. SCE (saturated calomel 362
electrode) [40]. However, the productivity did not exceed 25 mLH2 L-1 d-1 [40].
363
The rcat is a variable that reflects the use of electrons harvested to form H2 364
gas, which depends on certain architectural factors, e.g. the properties of the 365
cathode material [41] (nickel foam in our study) as well as the current generated by 366
the MECs under given operating conditions. Here, as seen in Fig. 5, rcat was found 367
to be rather independent of the actual AEM when both acetate and a VFA mixture 368
were used as substrates. In the latter case,rcat of the MECs that employed AMI- 369
7001, AF49R27 and PSEBS CM DBC were 86 ± 3 %, 98 ± 2 % and 91 ± 4 %, 370
respectively. The hydrogen purity recovered in the cathode chamber was > 95 % in 371
all experiments. Additionally, only traces of carbon dioxide were detected in the 372
cathode chamber.
373
In the study by Carmona-Martínez et al. [28], CE and rcat of 20-20 % in a 4 L 374
MEC using the membrane FAA-PK (FuMA-Tech GmbH, Germany) were reported, 375
which seem relatively lower compared to our aforementioned results. However, the 376
rate of hydrogen production and the hydrogen purity were quite high, 900 mLH2 L-1 377
d-1 and > 90 %, respectively. Reactors of smaller volumes (28 mL and 30 mL for 378
the anode and cathode chambers, respectively) that were equipped with AMI-7001, 379
a graphite brush anode and a stainless steel cathode showed levels of organic 380
matter removal of 90 %, rcat of 117 % and CE of 84 % [26].
381 382
3.2. Results of microbial community analysis 383
384
Since the set up of all MECs was identical, except for in terms of the 385
membrane separator, the observed differences in their performances could have 386
been related to the composition of the maturing microbial community in contact 387
with the surface of the anode electrode [42].
388
The inoculum of MECs (anaerobic granular sludge) exhibited great microbial 389
diversity, therefore, only the phylum level is presented in Fig. 6A. As can be seen, 390
the inoculum was composed of Proteobacteria (21.91 %), Thermotogae (15.11 %), 391
Firmicutes (7.6 %), Cloacimonetes (5.14 %), Spirochaetes (2.14 %), Synergistetes 392
(1.86 %), Bacteroidetes (1.66 %) and Nitrospirae (0.61 %).
393
In samples of anodic biofilms from MECs that were analyzed at the end of 394
the experiments which employed acetate as a substrate, the predominance of 395
Geobacter spp. (84-94 %) was observed, according to Figs. 6 B-D. Consequently, 396
it can be concluded that although the presence of Geobacter spp. in the seed 397
source was initially marginal (0.0075 %), it was significantly enriched over time and 398
became the leading microbial species on the anode when the 3 different kinds of 399
membrane separators were employed. In bioelectrochemical systems, the 400
predominance of Geobacter spp. in the anodic biofilm community suggests that 401
12
high current densities can be generated [43].Geobacter spp. has been previously 402
described as a microorganism capable of (i) oxidizing volatile fatty acids such as 403
acetate and, hence (ii) producing electrons that are pumped extracellularly and 404
harvested at the anode.
405
Moreover, it can be concluded from Figs. 6 B-D that by changing the 406
substrate from pure acetate to a mixture of VFAs resulted in the additional 407
selection of Geobacter spp. (95 – 97.5 %) and even lower levels of bacterial 408
diversity for all membranes. Therefore, it would appear that by switching from a 409
single to complex VFA feeding stream had a certain promoting impact and further 410
supported the consistent growth of Geobacter spp. This can be of practical benefit 411
when complex mixtures are loaded into and treated in the MEC, e.g. fermentation 412
effluents comprised of remarkable quantities of VFAs [44].
413
It could be concluded from the aforementioned results that Geobacter spp.
414
was the predominant genus which confirms that the new membrane material 415
(PSEBS CM DBC) had no negative effect on the formation of the anodic electro- 416
active biofilm. In fact, the anodes of MECs tended to contain similar species 417
(meaning comparable microbial diversities), but it would appear that the MEC 418
equipped with the membrane PSEBS CM DBC achieved a somewhat higher 419
affinity for Geobacter spp.
420 421
3.3. Evaluation of the pH and ionic losses in MECs using different AEMs 422
423
In the case of MECs equipped with different separators, it is reasonable to 424
assume that the characteristics of a particular membrane influence the pH balance 425
on both sides of the membrane as well as the ionic composition of the anolyte and 426
catholyte [45]. One of the main ideas behind proposing the use of AEMs instead of 427
CEMs in BES is related to the theoretically more adequate management of the pH 428
gradient that occurs between the cathode and anode chambers [14]. This pH 429
imbalance inevitably leads to the loss of energy (voltage) (EpH) in the MEC, which 430
can be estimated according to Eq. 4 [19,46].
431 432
E∆pH =RT
F ln(10(pHC−pHA)) (4)
433 434
where pHC and pHA denote the mean pH values of the catholyte and anolyte, 435
respectively, calculated as the mathematical average of the respective final pH 436
values observed in the consecutive (individual) feeding cycles.
437
To evaluate the pH and ionic losses in the MECs, the potentials were 438
determined after the start-up. The cathode potentials reported were measured in 439
the stationary current-producing phase. In the case of acetate feedings, the mean 440
final pH was 6.1 ± 0.2, 6.2 ± 0.2 and 6.3 ± 0.2 in the anolyte and 13 ± 0.1, 12.8 ± 441
13
0.1 and 12.5 ± 0.1 in the catholyte for AMI-7001-, AF49R27- and PSEBS CM DBC- 442
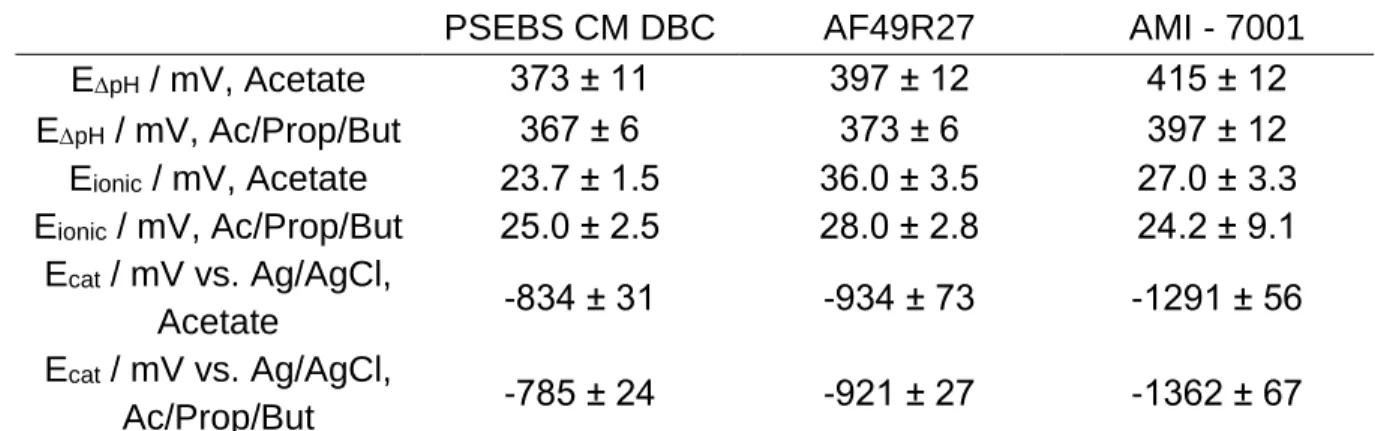
equipped MECs, respectively. It seems that the pH shift was the lowest for PSEBS 443
CM DBC and the highest for AMI-7001. Accordingly, the pH-related voltage drop 444
followed the same order and fell to within the range of 373 – 415 mV (Table 1). In 445
fact, the MEC that employed PSEBS CM DBC exhibited a EpH that was ~10 % 446
less than that of the AMI-7001 equivalent.
447
In the cases where the VFA mixture was the substrate, similar conclusions 448
can be made, however, the EpH values were somewhat smaller in each MEC. In 449
addition, the difference between the highest (AMI-7001) and lowest (PSEBS CM 450
DBC) EpH decreased by ~7.5 %. Thus, it could be observed that the pH splitting 451
effect was notable and varied depending on the type of membrane employed. In 452
conclusion, the membrane PSEBS CM DBC demonstrated the most beneficial 453
features from this point of view.
454
In terms of electrolyte resistance (associated with the ionic composition and 455
thus, the conductivity of the solution), the ionic voltage drop (Eionic) could be 456
dependent on the flow of ions (current density, j), the membrane-anode and 457
membrane-cathode distances (dA and dC, respectively), as well as the 458
conductivities of the anolyte and catholyte (A and C, respectively), as expounded 459
in Eq. 5 [47]:
460 461
Eionic = j (dA
κA+dC
κC) (5)
462 463
As listed in Table 1, the MEC equipped with the membrane AF49R27 464
exhibited the highest Eionic with both acetate and a mixture of VFAs as substrates.
465
In general, Eionic was one order of magnitude lower than EpH, indicating the 466
dominance of pH-related losses over those linked to ionic compounds of 467
electrolytes in the MECs [15-16].
468
To further evaluate the potential losses in the different MECs and support 469
the aforementioned data concerning EpH and Eionic, the cathodic overpotentials can 470
also be taken into consideration. It was observed that in the case of both feedings 471
using acetate and a mixture of VFAs, the system equipped with PSEBS CM DBC 472
exhibited by far the lowest cathodic overpotentials (Table 1). So far in this study, it 473
has been demonstrated that PSEBS CM DBC could be less sensitive to changes in 474
substrate that would appear to be a consequence of its homogeneous polymer 475
nature (and concomitantly different ion-transfer kinetics) (Section 3.1).
476
Furthermore, this membrane ensured efficient operation of the MEC based on the 477
reduction of losses related to pH imbalance and the change in the ionic 478
composition of the electrolytes in the MEC. Therefore, given all these aspects, the 479
use of PSEBS CM DBC resulted in a lower cathodic overpotential for the hydrogen 480
evolution reaction in the MEC, when compared to the commercial, heterogeneous 481
14
AEMs tested. These relatively advantageous features indicate the notable potential 482
of applying the membrane PSEBS CM DBC in MECs. In the next section, the 483
membranes and, in particular, their stability will be evaluated by the intrinsic 484
material properties and their alteration over the course of operation of MECs.
485 486
3.4. Assessment of membrane stability in MECs 487
488
The operating efficacy of BESs may be affected by changes to the 489
properties of membrane separators over time, e.g. due to (bio)fouling [3,10].
490
Therefore, especially when new membrane materials such as AF49R27 and 491
PSEBS CM DBC are tested in BESs, it is crucial to check their in-use stabilities 492
compared to ones that have already been commercialized, e.g. AMI-7001 in this 493
research.
494
During our experiments, the three membranes tested were exposed to 495
significant pH gradients (pH 6.2–6.9, as presented in Section 3.3) that developed 496
between the anode and cathode chambers. The stability of AEMs in an alkaline 497
environment might be problematic [48-49], and since the final pH of the catholyte 498
exceeded 12 in all the MECs, it appeared to be important to gain insights into the 499
possible alteration of membrane traits and evaluate them in the light of those of 500
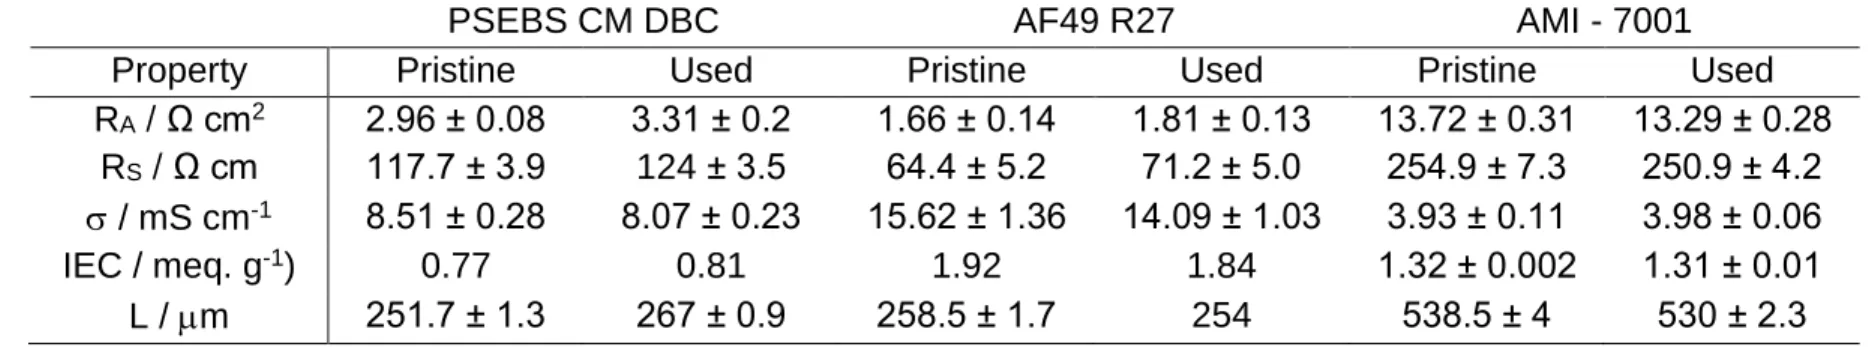
unused materials. These measured characteristics (RA, RS, , IEC and L) are 501
summarized in Table 2.
502
AMI-7001 exhibited the highest area specific resistance but the lowest ionic 503
conductivity, followed by PSEBS CM DBC and AF49R27, for both the pristine and 504
used materials. For example, the ionic conductivity of the unused AMI-7001 was 505
3.97 times and 2.16 times lower than that of both AF49R27 and PSEBS CM DBC, 506
respectively. Furthermore, concerning IEC – which provides information about the 507
amount of active functional groups on the given membrane material [23] – it turned 508
out (as expected) that AF49R27 exhibited a remarkably higher IEC than AMI-7001 509
in both pristine and used states (45.5 % and 40.4 %, respectively). This 510
observation, keeping in mind that the membrane AF49R27 was considerably 511
thinner (almost half as thick as AMI-7001), is a result of the higher ionic 512
conductivity and underlines the potential benefit of applying AF49R27 over AMI- 513
7001 in MECs. In the case of PSEBS CM DBC, however, the IEC appeared to be 514
lower compared to that of AMI-7001 (0.77 vs. 1.32 meq. g-1 for pristine and 0.81 515
vs. 1.31 meq g-1 for used samples, respectively). Nonetheless, given that the 516
pristine and used samples were 53 % and 49 % thinner when compared to the 517
AMI-7001 equivalents, respectively, a higher ionic conductivity of PSEBS CM DBC 518
can be presumed.
519
Alterations to the aforementioned features of the membrane as a result of 520
use in MECs are displayed in Fig. 7. First of all, it can be inferred that in the case 521
of AMI-7001, alterations to all terms fell within the range of methodological 522
15
accuracy, which is indicative of an excellent degree of durability (a desirable 523
characteristic for a widely applied commercial material) in such complex and 524
dynamic environments as those found in MECs. Moreover, the outcomes suggest 525
the in-use stability of the other two membranes as well since alterations of less 526
than 10 % were observed (except for RA in the case of PSEBS CM DBC, where it 527
was 12 %). During the operation of MECs, the thickness of the membrane PSEBS 528
CM DBC changed the most, while it remained rather comparable for the other two 529
materials before and after being used. AF49R27 suffered from the largest 530
reduction in ionic conductivity, although after use it still exhibited the highest ionic 531
conductivity of all three AEMs. The IEC seemed to be stable in all cases 532
(alterations were of less than 5 %), implying the remarkable chemical stability of 533
the investigated polymers. This can be seen as a factor when new membranes, 534
e.g. PSEBS CM DBC, are benchmarked [50-51].
535
In conclusion, PSEBS CM DBC as a novel separator for use in MECs 536
seems more technologically feasible compared to AMI-7001, making it a potential 537
alternative membrane to be deployed in MECs.
538 539
4. Conclusions 540
541
In this work, a novel anion-exchange membrane, PSEBS CM DBC 542
(functionalized with 1,4-diazabicyclo[2.2.2]octane), was compared with quaternary 543
ammonium-functionalized, commercially available AEMs, namely AMI-7001 and 544
AF49R27, in terms of producing hydrogen gas in MECs. Given the outcomes of 545
research where acetate or a mixture of VFAs were applied as substrates, PSEBS 546
CM DBC could be more suitable for MECs than the two other membranes when H2
547
production data, electrochemical behavior, as well as microbiological insights into 548
anodic populations and internal losses are all taken into consideration. Moreover, 549
analysis of the alterations of various membrane properties following their use in 550
MECs indicated that PSEBS CM DBC was sufficiently stable when compared to 551
commercialized materials, making it a promising candidate for sustainable MEC 552
operation.
553 554
Acknowledgements 555
556
This research was supported through Fondo de Sustentabilidad Energética 557
SENER-CONACYT [grant number 247006 Gaseous Biofuels Cluster]. The authors 558
are grateful to Sarai E. Rodríguez, Jaime Perez and Gloria Moreno for the 559
technical support and fruitful discussions. Péter Bakonyi acknowledges the support 560
received from National Research, Development and Innovation Office (Hungary) 561
[grant number PD 115640]. László Koók was supported by the ÚNKP-19-3 New 562
National Excellence Program of the Ministry for Innovation and Technology.
563
16 References
564 565
[1] B.E. Logan, B. Hamelers, R. Rozendal, U. Schröder, J. Keller, S. Freguia et 566
al., Microbial fuel cells: methodology and technology, Environ. Sci. Technol.
567
40 (2006) 5181-5192. https://doi.org/10.1021/es0605016 568
[2] C. Santoro, C. Arbizzani, B. Erable, I. Ieropoulos, Microbial fuel cells: From 569
fundamentals to applications. A review, J. Power Sources 356 (2017) 225- 570
244. https://doi.org/10.1016/j.jpowsour.2017.03.109 571
[3] P. Bakonyi, L. Koók, G. Kumar, G. Tóth, T. Rózsenberszki, D.D. Nguyen et 572
al., Architectural engineering of bioelectrochemical systems from the 573
perspective of polymeric membrane separators: A comprehensive update 574
on recent progress and future prospects, J. Membr. Sci. 564 (2018) 508- 575
522. https://doi.org/10.1016/j.memsci.2018.07.051 576
[4] S. Bajracharya, S. Srikanth, G. Mohanakrishna, R. Zacharia, D.P. Strik, D.
577
Pant, Biotransformation of carbon dioxide in bioelectrochemical systems:
578
State of the art and future prospects, J. Power Sources 356 (2017) 256-273.
579
https://doi.org/10.1016/j.jpowsour.2017.04.024 580
[5] S. Gildemyn, K. Verbeeck, R. Jansen, K. Rabaey, The type of ion selective 581
membrane determines stability and production levels of microbial 582
electrosynthesis, Bioresour. Technol. 224 (2017) 358-364.
583
https://doi.org/10.1016/j.biortech.2016.11.088 584
[6] E. Yang, K.J. Chae, M.J. Cho, Z. He, I.S. Kim, Critical review of 585
bioelectrochemical systems integrated with membrane based technologies 586
for desalination, energy self-sufficiency, and high efficiency water and 587
wastewater treatment, Desalination 452 (2019) 40-67.
588
https://doi.org/10.1016/j.desal.2018.11.007 589
[7] B.E. Logan, D. Call, S. Cheng, H.V.M. Hamelers, T.H.J.A. Sleutels, A.W.
590
Jeremiasse et al., Microbial electrolysis cells for high yield hydrogen gas 591
production from organic matter, Environ. Sci. Technol. 42 (2008) 8630-8640.
592
https://doi.org/10.1021/es801553z 593
[8] G. Zhen, X. Lu, G. Kumar, P. Bakonyi, X. Kaiqin, Z. Youcai, Microbial 594
electrolysis cell platform for simultaneous waste biorefinery and clean 595
electrofuels generation: Current situation, challenges and future 596
perspectives, Prog. Energy Combust. Sci. 63 (2017) 119-145.
597
https://doi.org/10.1016/j.pecs.2017.07.003 598
[9] S.A. Patil, S. Gildemyn, D. Pant, K. Zengler, B.E. Logan, K. Rabaey, A 599
logical data representation framework for electricity-driven bioproduction 600
processes, Biotechnol. Adv. 33 (2015) 736-744.
601
https://doi.org/10.1016/j.biotechadv.2015.03.002 602
[10] L. Koók, P. Bakonyi, F. Harnisch, J. Kretzschmar, K.J. Chae, G.
603
Zhen et al., Biofouling of membranes in microbial electrochemical 604
17
technologies: Causes, characterization methods and mitigation strategies, 605
Bioresour. Technol. 279 (2019) 327-338.
606
https://doi.org/10.1016/j.biortech.2019.02.001 607
[11] M.T. Noori, M.M. Ghangrekar, C.K. Mukherjee, B. Min, Biofouling 608
effects on the performance of microbial fuel cells and recent advances in 609
biotechnological and chemical strategies for mitigation, Biotechnol. Adv.
610
(2019) 107420, https://doi.org/10.1016/j.biotechadv.2019.107420 611
[12] F. Harnisch, R. Warmbier, R. Schneider, U. Schröder, Modeling the 612
ion transfer and polarization of ion exchange membranes in 613
bioelectrochemical systems, Bioelectrochemistry 75 (2009) 136-141.
614
https://doi.org/10.1016/j.bioelechem.2009.03.001 615
[13] F. Harnisch, U. Schröder, Selectivity versus Mobility: Separation of 616
Anode and Cathode in Microbial Bioelectrochemical Systems, 617
ChemSusChem 2 (2009) 921-926. https://doi.org/10.1002/cssc.200900111 618
[14] T.H.J.A. Sleutels, A. ter Heijne, P. Kuntke, C.J.N. Buisman, H.V.M.
619
Hamelers, Membrane selectivity determines energetic losses for ion 620
transport in bioelectrochemical systems, ChemistrySelect 2 (2017) 3462- 621
3470. https://doi.org/10.1002/slct.201700064 622
[15] R.A. Rozendal, H.V.M. Hamelers, R.J. Molenkamp, C.J.N. Buisman, 623
Performance of single chamber biocatalyzed electrolysis with different types 624
of ion exchange membranes, Water Res. 41 (2007) 1984-1994.
625
https://doi.org/10.1016/j.watres.2007.01.019 626
[16] R.A. Rozendal, T.H.J.A. Sleutels, H.V.M. Hamelers, C.J.N. Buisman, 627
Effect of the type of ion exchange membrane on performance, ion transport, 628
and pH in biocatalyzed electrolysis of wastewater, Water Sci. Technol. 57 629
(2008) 1757-1762. https://doi.org/10.2166/wst.2008.043 630
[17] S. Cheng, B.E. Logan, Evaluation of catalysts and membranes for 631
high yield biohydrogen production via electrohydrogenesis in microbial 632
electrolysis cells (MECs), Water Sci. Technol. 58 (2008) 853-857.
633
https://doi.org/10.2166/wst.2008.617 634
[18] Y. Ye, B.E. Logan, The importance of OH− transport through anion 635
exchange membrane in microbial electrolysis cells, Int. J. Hydrogen Energy 636
43 (2018) 2645-2653. https://doi.org/10.1016/j.ijhydene.2017.12.074 637
[19] T.H.J.A. Sleutels, H.V.M. Hamelers, R.A. Rozendal, C.J.N. Buisman, 638
Ion transport resistance in Microbial Electrolysis Cells with anion and cation 639
exchange membranes, Int. J. Hydrogen Energy 34 (2009) 3612-3620.
640
https://doi.org/10.1016/j.ijhydene.2009.03.004 641
[20] L. Koók, E.D.L. Quéméner, P. Bakonyi, J. Zitka, E. Trably, G. Tóth et 642
al., Behavior of two-chamber microbial electrochemical systems started-up 643
with different ion-exchange membrane separators, Bioresour. Technol. 278 644
(2019) 279-286. https://doi.org/10.1016/j.biortech.2019.01.097 645
18
[21] J. Hnát, M. Plevová, J. Zitka, M. Paidar, K. Bouzek, Anion-selective 646
materials with 1,4-diazabicyclo[2.2.2]octane functional groups for advanced 647
alkaline water electrolysis, Electrochim. Acta 248 (2017) 547-555.
648
https://doi.org/10.1016/j.electacta.2017.07.165.
649
[22] H. Strathmann, Ion-exchange membrane separation processes (Vol.
650
9), Elsevier, 2004.
651
[23] Y. Tanaka, Ion Exchange Membranes: Fundamentals and 652
Applications, Series 12, Membrane Science and Technology: Elsevier, 653
Netherlands, 2007.
654
[24] J. Schauer, V. Kůdela, K. Richau, R. Mohr, Heterogeneous ion- 655
exchange membranes based on sulfonated poly(1,4-phenylene sulfide), 656
Desalination 198 (2006) 256-264.
657
https://doi.org/10.1016/j.desal.2005.12.027 658
[25] J. Schauer, J. Hnát, L. Brožová, J. Žitka, K. Bouzek, Heterogeneous 659
anion-selective membranes: Influence of a water-soluble component in the 660
membrane on the morphology and ionic conductivity, J. Membr. Sci. 401 661
(2012) 83-88. https://doi.org/10.1016/j.memsci.2012.01.038 662
[26] J.Y. Nam, B.E. Logan, Enhanced hydrogen generation using a saline 663
catholyte in a two chamber microbial electrolysis cell, Int. J. Hydrogen 664
Energy 36 (2011) 15105-15110.
665
https://doi.org/10.1016/j.ijhydene.2011.08.106 666
[27] Y. Ahn, B.E. Logan, Saline catholytes as alternatives to phosphate 667
buffers in microbial fuel cells, Bioresour. Technol. 132 (2013) 436-439.
668
https://doi.org/10.1016/j.biortech.2013.01.113 669
[28] A.A. Carmona-Martínez, E. Trably, K. Milferstedt, R. Lacroix, L.
670
Etcheverry, N. Bernet, Long-term continuous operation of H2 in microbial 671
electrolysis cell (MEC) treating saline wastewater, Water Res. 81 (2015) 672
149-156. https://doi.org/10.1016/j.watres.2015.05.041 673
[29] B.H. Kim, H.S. Park, H.J. Kim, G.T. Kim, I.S. Chang, J. Lee et al., 674
Enrichment of microbial community generating electricity using a fuel-cell- 675
type electrochemical cell, Appl. Microbiol. Biotechnol. 63 (2004) 672-681.
676
https://doi.org/10.1007/s00253-003-1412-6 677
[30] Y. Liu, F. Harnisch, K. Fricke, R. Sietmann, U. Schröder, 678
Improvement of the anodic bioelectrocatalytic activity of mixed culture 679
biofilms by a simple consecutive electrochemical selection 680
procedure, Biosens. Bioelectron. 24 (2008) 1006-1011.
681
https://doi.org/10.1016/j.bios.2008.08.001 682
[31] S. Mateo, P. Cañizares, M.A. Rodrigo, F.J. Fernández-Morales, 683
Reproducibility and robustness of microbial fuel cells technology, J. Power 684
Sources 412 (2019) 640-647.
685
https://doi.org/10.1016/j.jpowsour.2018.12.007 686
19
[32] J.I. Horiuchi, T. Shimizu, K. Tada, T. Kanno, M. Kobayashi, Selective 687
production of organic acids in anaerobic acid reactor by pH control, 688
Bioresour. Technol. 82 (2002) 209-213. https://doi.org/10.1016/S0960- 689
8524(01)00195-X 690
[33] S.K. Khanal, W.H. Chen, L. Li, S. Sung, Biological hydrogen 691
production: effects of pH and intermediate products, Int. J. Hydrogen Energy 692
29 (2004) 1123-1131. https://doi.org/10.1016/j.ijhydene.2003.11.002 693
[34] I. Hussy, F.R. Hawkes, R. Dinsdale, D.L. Hawkes, Continuous 694
fermentative hydrogen production from sucrose and sugarbeet, Int. J.
695
Hydrogen Energy 30 (2005) 471-483.
696
https://doi.org/10.1016/j.ijhydene.2004.04.003 697
[35] C.Y. Lin, C.H. Lay, A nutrient formulation for fermentative hydrogen 698
production using anaerobic sewage sludge microflora, Int. J. Hydrogen 699
Energy 30 (2005) 285-292. https://doi.org/10.1016/j.ijhydene.2004.03.002 700
[36] H.N. Gavala, I.V. Skiadas, B.K. Ahring, Biological hydrogen 701
production in suspended and attached growth anaerobic reactor systems, 702
Int. J. Hydrogen Energy, 31 (2006) 1164-1175.
703
https://doi.org/10.1016/j.ijhydene.2005.09.009 704
[37] N. Ren, J. Li, B. Li, Y. Wang, S. Liu, Biohydrogen production from 705
molasses by anaerobic fermentation with a pilot-scale bioreactor system, 706
Int. J. Hydrogen Energy, 31 (2006) 2147-2157.
707
https://doi.org/10.1016/j.ijhydene.2006.02.011 708
[38] Y. Tao, Y. Chen, Y. Wu, Y. He, Z. Zhou, High hydrogen yield from a 709
two-step process of dark- and photo-fermentation of sucrose, Int. J.
710
Hydrogen Energy 32 (2007) 200-206.
711
https://doi.org/10.1016/j.ijhydene.2006.06.034 712
[39] C. Hernández, Z.L. Alamilla-Ortiz, A.E. Escalante, M. Navarro-Díaz, 713
J. Carrillo-Reyes, I. Moreno-Andrade et al., Heat-shock treatment applied to 714
inocula for H2 production decreases microbial diversities, interspecific 715
interactions and performance using cellulose as substrate, Int. J. Hydrogen 716
Energy 44 (2019) 13126-13134.
717
https://doi.org/10.1016/j.ijhydene.2019.03.124 718
[40] A. Marone, O.R. Ayala-Campos, E. Trably, A.A. Carmona-Martínez, 719
R. Moscoviz, E. Latrille et al., Coupling dark fermentation and microbial 720
electrolysis to enhance bio-hydrogen production from agro-industrial 721
wastewaters and by-products in a bio-refinery framework, Int. J. Hydrogen 722
Energy 42 (2017) 1609-1621. https://doi.org/10.1016/j.ijhydene.2016.09.166 723
[41] A. Kundu, J.N. Sahu, G. Redzwan, M.A. Hashim, An overview of 724
cathode material and catalysts suitable for generating hydrogen in microbial 725
electrolysis cell, Int. J. Hydrogen Energy 38 (2013) 1745-1757.
726
https://doi.org/10.1016/j.ijhydene.2012.11.031 727