Physical activity during pregnancy alters gene expression in neonatal tissue
L.J. REYNOLDS
1p, O.A. VSEVOLOZHSKAYA
2, B.B. RICE
3, N.R. CHAVAN
4, A.J. DUGAN
2, H.F. MADDOX
3, J.D. PRESTON
3,5,
L.B. DEHOFF
3, J.M. O'BRIEN
4and K.J. PEARSON
31Department of Human Movement Sciences, College of Education and Professional Studies, Old Dominion University, Norfolk, VA, USA
2Department of Biostatistics, College of Public Health, University of Kentucky, Lexington, KY, USA
3Department of Pharmacology and Nutritional Sciences, College of Medicine, University of Kentucky, Lexington, KY, USA
4Division of Maternal Fetal Medicine, Department of Obstetrics and Gynecology, College of Medicine, University of Kentucky, Lexington, KY, USA
5School of Medicine, Emory University, Atlanta, GA, USA
Received: August 25, 2020 • Accepted: August 28, 2020 Published online: March 20, 2021
© 2021 Akademiai Kiado, Budapest
ABSTRACT
Reducing the risk of developing chronic disease, such as obesity and type 2 diabetes, is an important component of successful aging. Offspring born to mothers who exercise during pregnancy have improved body composition and metabolic profiles. However, mechanisms to explain this phenomenon are lacking.
Purpose:This study examined whether maternal step counts were correlated with neonatal gene expression markers related to glucose metabolism and adipogenesis.Methods:Physical activity levels were assessed in women with male neonates via Fitbit Flex®during the second and third trimester of pregnancy. The dartos and epidermal/dermal layers of the foreskin were collected following circumcision in full-term, singleton, neonates (n512 dartos andn514 dermal). Tissue was homogenized, RNA isolated, and a NanoString code set was run to quantify a panel of genes related to glucose metabolism and adipogenesis.Results:
Twelve genes were correlated to steps per day with a P-value of <0.05. After adjusting for multiple comparisons, six genes remained significantly correlated to steps per day (False Discovery Rate-corrected
pCorresponding author. Department of Human Movement Sciences, Old Dominion University, Student Recreation Center 1006C, Norfolk, VA, 23529, USA. Tel.:þ1 757 683 4974; faxþ1 757 683 4270. E-mail:
lreynold@odu.edu
P-value < 0.10). Notably, glucose transporter 1, adiponectin receptor 1, and CCAAT/enhancer-binding protein alpha and beta were positively correlated with steps per day, while peroxisome proliferator- activated receptor alpha and peroxisome proliferator-activated receptor gamma coactivator 1- alpha were negatively correlated with steps per day.Conclusion:Maternal physical activity is associated with offspring gene expression markers of adipogenesis, insulin sensitivity and glucose uptake. Future studies should aim to mechanistically examine whether these markers are driving increased adiposity in offspring born to sedentary mothers.
KEYWORDS
exercise, developmental origins of health and disease, gestation, offspring, obesity
INTRODUCTION
Developmental programming describes changes in phenotype of offspring in response to in utero or early postnatal life environmental challenges which impact long term health [1, 2].
These challenges occur during critical windows of pregnancy or early postnatal life and may shorten offspring longevity [3, 4], in part, by increasing the risk of developing chronic diseases as they age. Poor fetal nutrition during pregnancy imparts negative health consequences on neonatal and adult offspring [5-11]. Some evidence supports that undernutrition in the form of famine during gestation may even shorten lifespan. The Dutch Potato famine of 1846–1847 demonstrates 2.5–4 year shortened lifespan after the age of 50 in both men and women [12].
Additionally, chronic diseases, particularly those stemming from obesity, lead to excess mor- tality [13, 14]. Diabetes and aging are intricately linked. Diabetes accelerates aging related organ dysfunction and individuals with diabetes are more susceptible to disease [15, 16]. However, aging also increases the risk for chronic diseases, such as diabetes [17]. Thus, the goal of suc- cessful aging is to enhance both lifespan and healthspan.
Physical activity has been shown to enhance healthy aging [18]. While the aforementioned studies have examined the impact of nutrition during pregnancy on developmental pro- gramming, data are largely lacking on how exercise or physical activity during pregnancy impact developmental programming. Exercise during pregnancy has remained understudied, in part, due to early theoretical concerns that exercise during pregnancy may be unsafe for a developing fetus [19]. However, guidelines by the American College of Obstetrics and Gy- necologists state that in uncomplicated pregnancies, physical activity presents minimal risk to mother and baby. These guidelines even recommend that women who are physically inactive prior to pregnancy, engage in aerobic and strength-conditioning exercises during pregnancy assuming that they have healthy, uncomplicated pregnancies [20]. Studies have demonstrated no increased risk of pregnancy, fetal, or birth related complications in healthy women while performing moderate intensity exercise. In fact, many experimental studies in animals have shown that exercise during pregnancy has numerous beneficial effects on offspring as they age [21–28].
Offspring born to mothers who exercise during pregnancy have reduced body fat and improved glucose tolerance [25, 26]. Exercise during pregnancy can even offset some of the negative health effects in offspring of a poor maternal diet or maternal obesity [29]. However,
these studies have primarily been performed in animal models. Observational, epidemiological studies exist in humans demonstrating that children born to mothers who report exercising during pregnancy have reduced body weight and percent body fat [30]. Unfortunately, mech- anistic studies in humans on the impact of exercise during pregnancy on offspring health are lacking.
In humans, tissues traditionally utilized to study developmental programming are cord blood/tissue and placenta. Global methylation, indicative of epigenetic programming, in these tissues have been correlated to fetal/infant growth in women with gestational diabetes, obesity and preeclampsia. It appears that placental derived tissue may be epigenetically programmed by these conditions to influence fetal/infant growth [31]. However, one of the limitations investi- gating those tissues is that they do not directly originate from the infant after birth. While a wealth of knowledge can be obtained from these samples, the foreskin is a terminal neonatal tissue that can be collected up to three days after birth. We and others have already begun to utilize skin tissue in efforts to examine potential mechanisms of disease related to developmental programming [32–34]. In this study, we collected the foreskin tissue following circumcision of male neonates to examine the impact of physical activity levels during pregnancy on markers of gene expression related to adipogenesis and glucose tolerance in male neonates. The purpose of this study was to examine if physical activity levels during pregnancy were significantly corre- lated to genes related to adipogenesis and glucose homeostasis in offspring. We hypothesized that physical activity levels during pregnancy would be inversely correlated to genes indicative of increased risk of developing obesity and type 2 diabetes in offspring. If babies born to physically active mothers have reduced risk of developing disease, then understanding potential mecha- nisms by which maternal physical activity impacts offspring development of obesity and type 2 diabetes may lead to healthy aging.
METHODS
Ethical approval
Protocols were approved by the University of Kentucky Institutional Review Board and written informed consent was obtained from all subjects.
Subjects
Twenty-four pregnant women were initially recruited to complete this study at their anatomy scan (approximately 20 weeks of gestation) when the gender of the baby was determined. Only women who had self-selected to learn the gender of the baby at the anatomy scan were approached for the study. Women pregnant with male fetuses that they intended to circumcise were recruited into the study. In the United States, circumcision is common with approximately 77% percent of male neonates circumcised [35]. Subject characteristics are provided inTable 1. Inclusion criteria for the pregnant women were 18–
45 years of age, singleton gestation, and a male infant that they intended to circumcise.
Inclusion criteria for foreskin collection of neonates was vaginal or cesarean delivery of non- anomalous, newborns with circumcision performed within 72 hours after birth and before leaving the hospital.
Experimental procedures
Pregnant women were given the Fitbit Flex®(San Francisco, CA) to wear from approximately 20 weeks of gestation until delivery of their male neonate. Average steps taken per day was assessed weekly from week 22 of gestation to delivery. The participants set up their own accounts via www.Fitbit.com. Then they selected to electronically share their physical activity data with study personnel. Average steps taken per day were manually entered each week from the Fitbit website. The Fitbit Flex has been shown to be a valid marker of counting steps per day in men and women [36–39]. Further, others are already utilizing the Fitbit to track physical activity levels in pregnant women [40] and have found the Fitbit Flex to be a valid assessment of physical activity in pregnant women in their third trimester [41]. Women were instructed to not change their physical activity or exercise levels during the study. Compliance was defined as wearing the physical activity monitor for at least 4 days out of the week which is a more conservative approach than necessary to adequately assess physical activity. Tudor-Locke et al. and others have shown that physical activity levels can be accurately captured by assessing as little as 3 days of physical activity each week [42, 43]. There were 10 occurrences total, out of all subjects combined, in which subjects did not wear the physical activity monitor for at least 4 days per week. Regardless, these weeks were still incorporated into the weekly average number of steps due to the small number of occurrences. Foreskin tissue was collected following routine circumcision by the obstetrics team on duty. The dermal/epidermal layer of the foreskin tissue was grossly dissected from the dartos layer. Both layers were immediately snap frozen in liquid nitrogen and stored at808C until analysis. RNA was extracted from the dermal/epidermal and dartos layers as previously described by our lab [33]. NanoString Technology was utilized to assess RNA content in each sample. While 24 women were recruited for the study, samples were collected in only 14 subjects due to the following reasons: 1) technical difficulties in obtaining tissue, 2) anomalies in the infant or 3) infant circumcision occurring >72 hours following birth.
Further, due to poor sample quality, only 12 of the 14 samples from the dartos layer were included in thefinal analyses. Thus, the dartos layer had a sample size of 12 and the dermal layer had a sample size of 14.
RNA isolation
Approximately 40–60 mg of tissue was placed in 1 mL Qiazol and homogenized using a Geno/
Grinder 2010 (SPEX SamplePrep). RNA was extracted from the dermal and dartos layers using the Qiagen RNeasy Lipid Tissue Mini Kit (Cat. No. 74804, Qiagen) [44]. RNA was eluted from the column using 30
m
L of nuclease free water. RNA integrity number (RIN) was measured using an Agilent 2100 BioAnalyzer (Agilent).NanoString code set
We pre-selected a panel of 56 genes involved in glucose metabolism, insulin signaling, inflammation, and oxidative stress in addition to 4 housekeeping genes. One hundred nano- grams of RNA was loaded per sample for each NanoString run. NanoString results were normalized by creating scaling factors for positive controls (sum of positive controls) and pre- selected housekeeping genes (the geometric mean was calculated for 4 housekeeping genes for each sample) according to manufacturer’s suggestions. Five (non-housekeeping) genes in the
dermal tissue and 7 (non-housekeeping) genes in the dartos tissue whose average corrected NanoString counts were below 15 were excluded; and 49 candidate genes remained for the analyses described subsequently. The NanoString nCounter system is highly reproducible and provides similar expression patterns to real-time qPCR [45].
Statistical analysis
The preplanned primary analysis was to correlate normalized expression levels of candidate genes to mother’s physical activity during pregnancy, as captured by the average number of steps taken per day from weeks 22 of gestation to delivery. To account for the correlation between dartos and dermal samples collected on the same infant, a linear mixed model wasfit for each gene which included the average number of steps, tissue type, and an interaction between the average number of steps and tissue type asfixed effects along with mother ID as a random effect.
If the distribution of normalized expression counts for a gene was skewed, then the normalized counts were log-transformed prior to modeling. If the interaction between average number of steps and tissue type was found to be not significant, then the interaction term was removed from the model prior to reporting the results. TheP-value for the estimated effect of the average number of steps was calculated for each candidate gene. To account for multiple comparisons among candidate genes, gene-level P-values were corrected using 10% false discovery rate (FDR). All reportedP-values are 2-tailed. FDR adjustedP-values of <0.1 passed the false dis- covery rate correction and were statistically significant. All analyses were conducted using R statistical software, version 3.6.0 (R Core Team, Vienna, Austria). Linear mixed models werefit using the R package nlme, version 3.1-139 [46].
RESULTS
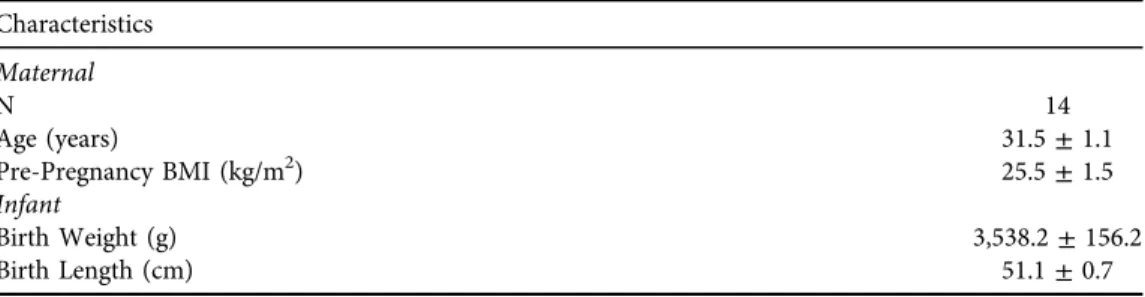
Maternal and infant characteristics
Maternal and infant characteristics are listed inTable 1.
Physical activity during pregnancy
Average weekly number of steps was calculated for each subject with the corresponding con- fidence intervals. Weekly confidence intervals crossed the subject-specific mean for each
Table 1.Maternal and infant characteristics Characteristics
Maternal
N 14
Age (years) 31.5±1.1
Pre-Pregnancy BMI (kg/m2) 25.5±1.5
Infant
Birth Weight (g) 3,538.2±156.2
Birth Length (cm) 51.1±0.7
BMI: Body Mass Index;N5Sample Size.
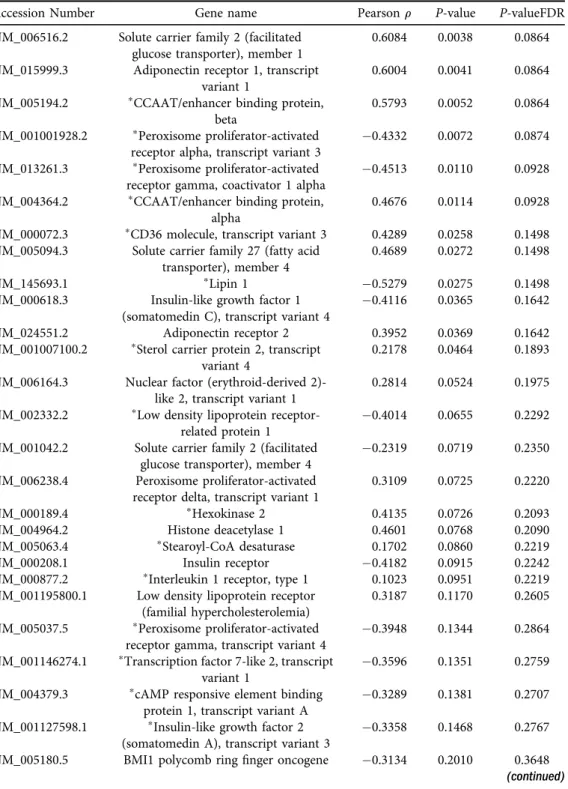
Table 2.Gene list for NanoString CodeSet
Accession Number Gene name Pearsonr P-value P-valueFDR
NM_006516.2 Solute carrier family 2 (facilitated glucose transporter), member 1
0.6084 0.0038 0.0864
NM_015999.3 Adiponectin receptor 1, transcript variant 1
0.6004 0.0041 0.0864
NM_005194.2 pCCAAT/enhancer binding protein, beta
0.5793 0.0052 0.0864
NM_001001928.2 pPeroxisome proliferator-activated receptor alpha, transcript variant 3
0.4332 0.0072 0.0874
NM_013261.3 pPeroxisome proliferator-activated receptor gamma, coactivator 1 alpha
0.4513 0.0110 0.0928
NM_004364.2 pCCAAT/enhancer binding protein, alpha
0.4676 0.0114 0.0928
NM_000072.3 pCD36 molecule, transcript variant 3 0.4289 0.0258 0.1498 NM_005094.3 Solute carrier family 27 (fatty acid
transporter), member 4
0.4689 0.0272 0.1498
NM_145693.1 pLipin 1 0.5279 0.0275 0.1498
NM_000618.3 Insulin-like growth factor 1 (somatomedin C), transcript variant 4
0.4116 0.0365 0.1642
NM_024551.2 Adiponectin receptor 2 0.3952 0.0369 0.1642
NM_001007100.2 pSterol carrier protein 2, transcript variant 4
0.2178 0.0464 0.1893
NM_006164.3 Nuclear factor (erythroid-derived 2)- like 2, transcript variant 1
0.2814 0.0524 0.1975
NM_002332.2 pLow density lipoprotein receptor- related protein 1
0.4014 0.0655 0.2292
NM_001042.2 Solute carrier family 2 (facilitated glucose transporter), member 4
0.2319 0.0719 0.2350
NM_006238.4 Peroxisome proliferator-activated receptor delta, transcript variant 1
0.3109 0.0725 0.2220
NM_000189.4 pHexokinase 2 0.4135 0.0726 0.2093
NM_004964.2 Histone deacetylase 1 0.4601 0.0768 0.2090
NM_005063.4 pStearoyl-CoA desaturase 0.1702 0.0860 0.2219
NM_000208.1 Insulin receptor 0.4182 0.0915 0.2242
NM_000877.2 pInterleukin 1 receptor, type 1 0.1023 0.0951 0.2219 NM_001195800.1 Low density lipoprotein receptor
(familial hypercholesterolemia)
0.3187 0.1170 0.2605
NM_005037.5 pPeroxisome proliferator-activated receptor gamma, transcript variant 4
0.3948 0.1344 0.2864
NM_001146274.1 pTranscription factor 7-like 2, transcript variant 1
0.3596 0.1351 0.2759
NM_004379.3 pcAMP responsive element binding protein 1, transcript variant A
0.3289 0.1381 0.2707
NM_001127598.1 pInsulin-like growth factor 2 (somatomedin A), transcript variant 3
0.3358 0.1468 0.2767
NM_005180.5 BMI1 polycomb ringfinger oncogene 0.3134 0.2010 0.3648 (continued)
occurrence in every subject; thus, there was no statistically significant deviation in the number of steps per week across gestation (Supplemental Fig. 1-14).
Identification of potential target genes
NanoString was used to quantify mRNA expression in the foreskin. Twelve genes were found to be significantly correlated to steps per day in the epidermal/dermal and dartos layers (P< 0.05) (Table 2). After adjusting for multiple comparisons, expression of six genes remained Table 2. Continued
Accession Number Gene name Pearsonr P-value P-valueFDR
NM_001379.2 pDNA (cytosine-5-)- methyltransferase 1, transcript variant 2
0.1109 0.2129 0.3725
NM_002574.2 Peroxiredoxin 1, transcript variant 1 0.1801 0.2303 0.3891 NM_001003679.1 pLeptin receptor, transcript variant 2 0.1407 0.2408 0.3932 NM_001018077.1 pNuclear receptor subfamily 3, group C,
member 1 (NR3C1), transcript variant 5
0.2180 0.3017 0.4768
NM_000875.4 pInsulin-like growth factor 1 receptor, transcript variant 1
0.1201 0.3024 0.4631
NM_002889.3 pRetinoic acid receptor responder 0.2434 0.3242 0.4814
NM_001442.2 pFatty acid binding protein 4 0.2631 0.3594 0.5179
NM_003329.2 pThioredoxin 0.3368 0.3612 0.5057
NM_004530.2 Matrix metallopeptidase 2 0.2036 0.3734 0.5082
NM_198580.1 pSolute carrier family 27 (fatty acid transporter), member 1
0.2232 0.4329 0.5733
NM_001025366.1 Vascular endothelial growth factor A, transcript variant 1
0.2058 0.4489 0.5788
NM_001031847.2 pCarnitine palmitoyltransferase 1A, transcript variant 2
0.1278 0.4765 0.5987
NM_002103.4 Glycogen synthase 1 (muscle), transcript variant 1
0.2196 0.4907 0.6011
NM_003955.3 pSuppressor of cytokine signaling 3 0.2011 0.5142 0.6146
NM_002982.3 pC–C motif chemokine ligand 2 0.0647 0.5306 0.6190
NM_005544.2 pInsulin receptor substrate 1 0.1631 0.5432 0.6190
NM_001030272.1 Aryl hydrocarbon receptor nuclear translocator-like, transcript variant 2
0.1039 0.5682 0.6328
NM_002015.3 pForkhead box O1 0.1229 0.6864 0.7474
NM_004566.3 p6-phosphofructo-2- kinase/fructose- 2,6- biphosphatase 3, transcript variant
1
0.1045 0.7242 0.7714
NM_004958.3 pMechanistic target of rapamycin kinase 0.1546 0.7945 0.8283 NM_000602.2 pSerpin peptidase inhibitor, clade E,
member 1
0.0336 0.8943 0.9130
NM_022817.2 pPeriod circadian regulator 2 0.0184 0.9236 0.9236
pGenes which were log transformed tofit normality.
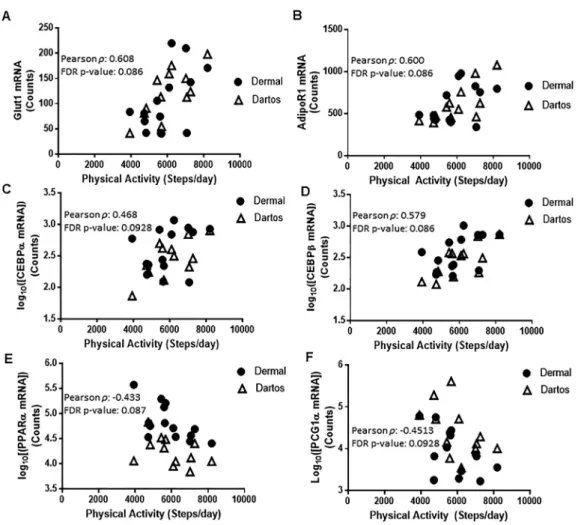
significantly correlated to steps per day in both the epidermal/dermal and dartos layers (Table 2). Notably, glucose transporter 1 (Glut1), adiponectin receptor 1 (AdipoR1) and CCAAT/enhancer-binding protein alpha and beta (CEBPaand CEBPb) were positively corre- lated with steps per day (FDR-correctedP-value <0.10), while peroxisome proliferator-activated receptor alpha (PPARa) and peroxisome proliferator-activated receptor gamma coactivator 1- alpha (PGC1a) were negatively correlated with steps per day (FDR-correctedP-value < 0.10) (Fig. 1A–FandTable 2). Additionally, these 6 genes were not significantly correlated to maternal characteristics such as maternal age, pre-pregnancy BMI, total weight gain during pregnancy, neonatal birth weight, and neonatal birth length,P > 0.05 (data not shown).
Fig. 1. Glut1(A),AdipoR1(B),CEBPa(C),CEBPb(D),PPARa(E), andPGC1a(F) mRNA expression correlated to average maternal steps per day in dermal and dartos tissues of the foreskin. Pearson corre- lation coefficient and the false discovery rate (FDR)-adjustedP-values are displayed. Only genes that passed
the 10% FDR adjustedP-value of <0.1 are shown
Uncovering additional results
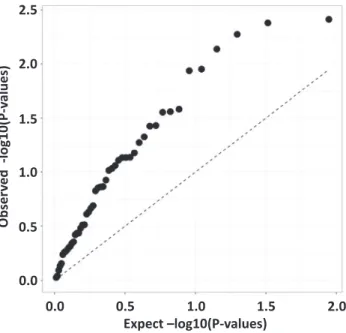
In genome-wide association studies (GWAS), a commonly used method to visualize results of the analysis is the quantile-quantile (“Q-Q”) plot. The QQ plot displays minus logarithm based 10 transformed observed associationP-valuesð−log10ðP −valueÞÞon the y-axis versus minus log10P-values that are expected under the null hypothesis of no association on the x- axis. Strongly associated signals will deviate from the diagonal at the upper-right end of the QQ plot, displaying a“hockey stick” shape.Fig. 2presents a QQ-plot based on the 49 gene expression P-values. The strong upward shift from the diagonal line suggests that the pro- portion of genes that is differentially expressed in foreskin tissue in response to maternal physical activity is higher than the 6 out of 49 genes we report inFig. 1andTable 2. Here, the failure to detect more association results may be due to a correction for multiple comparisons or the relatively small sample size. We estimated the number of true associations in our data by the method proposed by Benjamini et al. [47], and concluded that at least 41% of gene expression from our samples (dermal and dartos tissues combined) are associated with the mother’s physical activity levels. We conducted a small simulation study to check the validity of this estimate (data not shown) and concluded that the chance of getting this estimated value under the null hypothesis of no association is approximately 1 in 1,000,000.
DISCUSSION
In this study, a number of genes were significantly correlated to steps per day in the dermal and dartos layers of the foreskin tissue of neonates. Specifically, we found that Glut1, AdipoR1,
Observed-log10(P-values)
2.5
2.0
1.5
1.0
0.5
0.0
0.0 0.5
Expect –log10(P-values)
1.0 1.5 2.0
Fig. 2.Quantile-quantile plot of the observedP-values versus the expectedP-values for the 49 genes analyzed via NanoString
CEBPa, and CEBPb were positively correlated with steps per day (FDR-corrected P-value <
0.10). Other well-known regulators of adipogenesis such asPPARa[48] andPGC1a[49] were also significantly, negatively correlated to steps per day. These data point to potential genes of interest which may be regulating the reduced risk of obesity in adolescence and insulin sensi- tivity in adult offspring born to mothers who were more physically active.
PPARs are a class of transcription factors that regulate lipid and glucose metabolism [50].
Specifically, PPARgis expressed in adipose tissue and regulates the development and storage capacity of fat cells. PPARgis believed to be the master regulator of adipogenesis [48]. However, PPARaalso regulates adipogenesis in adipose tissue, but to a lesser extent than PPARg [48].
Nonetheless, we show thatPPARais downregulated in babies born to mothers with higher levels of physical activity, which further corroborates our hypothesis that adipogenesis may be downregulated in babies born to mothers with higher levels of physical activity. This also provides a potential mechanism for reduced fat mass in children who are born to mothers who exercise during pregnancy [30]. Overweight and obese children are more likely to be overweight/
obese adults. Thus, adolescent weight affects adult morbidity and mortality [51].
CEBPbis upstream in the adipogenesis pathway and acts to induce expression ofPGC1a,which is a master regulator of mitochondrial biogenesis and formation of brown adipocytes [52], as well as CEBPawhich acts to induce expression of a number of adipocyte genes [53]. It is interesting that in the present studyCEBPbwas positively correlated to steps per day which would then suggest that PGC1awould also be positively correlated. However, we demonstrate that expression ofPGC1ais lower in the babies born to mothers with higher levels of physical activity. There are a number of factors, other thanCEBPb, that act to increasePGC1aexpression [52] which are likely regulating the gene expression. Further, there is some evidence thatCEBPb, is increased following acute exercise [54]. While the babies in the present study did not exercise, we didfind that those babies born to mothers who had higher levels of physical activity during pregnancy also had higher CEBPblevels. It appears in the present study thatCEBPbis not directly regulating gene expression ofPGC1ain our samples, but additional studies are needed to tease apart these mechanisms.
We also found that Glut1 was positively correlated with steps per day in the dermal and dartos layers.Glut1is an insulin independent glucose transporter that is expressed in virtually all tissues [55]. Miele et al. [56] found that basal Glut1 cell surface content was increased in in- dividuals with type 2 diabetes and in obese individuals compared to lean, non-diabetic in- dividuals in skinfibroblasts and skeletal muscle. It is interesting that we alsofind increasedGlut1 mRNA expression in the babies born to mothers with higher levels of physical activity. Previous exercise training studies have shown that Glut1 expression is unchanged following exercise training [57, 58]. However, whether maternal physical activity levels impact offspringGlut1gene expression has never been examined which speaks to the novelty of our study. Results from our study suggest that offspring foreskin Glut1 is positively correlated to maternal steps per day.
Acosta et al. [59] examined Glut1 expression in the placenta and found that it was positively correlated to infant birthweight. Babies born to mothers who exercise during pregnancy tend to be lighter than those born to sedentary mothers; thus, it is interesting that wefind a positive relationship between steps per day andGlut1 expression. Lastly, we found that AdipoR1 was positively correlated to steps per day. Adiponectin is an adipokine that directly sensitizes skeletal muscle to insulin [60], and AdipoR1 is one of its receptors. We speculate that increased adi- ponectin receptor may be one of the mechanisms by which babies born to mothers who exercise are more insulin sensitive and tend to have lower rates of type 2 diabetes.
This small study has several limitations. Firstly, we cannot translate these findings into fe- males as we only collected skin samples from male neonates. Secondly, foreskin is used in this study as a surrogate tissue to understand how mechanisms regulating insulin signaling and adipogenesis are altered in human neonates in response to maternal exercise. However, foreskin tissue, adipose tissue, and muscle are all derived from the mesodermal germ layer [61, 62]. While it appears that the proteins regulating these mechanisms are similar between skin and other tissues such as skeletal muscle and/or adipose tissue, we did not directly make these measure- ments in those tissues and thus can only speculate that we would detect similar changes. Thirdly, we used the Reference (Housekeeping) Gene Normalization method from the nCounter Expression Data Analysis Guide [63] as our approach to analyzing the data as we have done previously [64, 33]. However, as noted in the nCounter Expression Data Analysis Guide, there are several methods that can be used to normalize NanoString data. As a sensitivity analysis, after analyzing the genes using the Reference Gene Normalization method, the NanoString data were also normalized using two other approaches from the NanoString Norm R package but neither approach resulted in any significant genes at the FDR <0.10 threshold. This suggests that the normalization procedure can have a meaningful impact on the results of a differential expression analysis and that other normalization approaches should be considered. Finally, we interrogated a select number of genes and other pathways may be altered by maternal exercise which deserves exploration.
Future efforts in our group will be aimed at performing more mechanistic studies examining how maternal exercise impacts neonatal tissue insulin signaling and adipogenesis. A study from our group demonstrated the foreskin tissue, in response to insulin stimulation, increases the phosphorylation of proteins traditionally believed to be involved in insulin stimulated glucose uptake [65]. Further, we showed that primary dermalfibroblasts can be isolated from the foreskin and differentiated into adipocyte-like cells [64, 65]. Thus, there are a number of endpoints relating to glucose uptake and adipogenesis that can be examined using the foreskin as a surrogate tissue.
We found that a number of genes involved in insulin sensitivity and adipogenesis were significantly correlated with maternal steps/day in both the dermal and dartos layers of neonatal foreskin tissue. Thus, it appears that physical activity may be a successful strategy to improve health and potentially delay aging. These findings lead to potential genes of interest for more mechanistic studies to examine why babies born to mothers who exercise or have high levels of physical activity during pregnancy tend to have reduced rates of obesity and type 2 diabetes.
Funding:Funding for the study was generously provided by the Graduate Center for Nutritional Sciences at the University of Kentucky. L.J.R. was supported by an American Heart Association Post-Doctoral Fellowship (15POST25110002). B.B.R was supported by the Southern Regional Education Board Doctoral Scholars Program, and the University of Kentucky Lyman T. Johnson Diversity Fellowship.
Conflicts of interest:The authors report no conflicts of interest.
Ethics approval: Protocols were approved by the University of Kentucky Institutional Review Board.
Consent to participate:Written informed consent was obtained from all subjects.
SUPPLEMENTARY MATERIAL
Supplementary data to this article can be found online at https://doi.org/10.1556/2060.2021.
00003.
REFERENCES
1. Nathanielsz PW, Ford SP, Long NM, Vega CC, Reyes-Castro LA, Zambrano E. Interventions to prevent adverse fetal programming due to maternal obesity during pregnancy. Nutr Rev 2013; 71(Suppl 1): S78–87.
https://doi.org/10.1111/nure.12062.
2. Preston JD, Reynolds LJ, Pearson KJ. Developmental origins of health span and life span: a mini-review.
Gerontology 2018; 64(3): 237–45.https://doi.org/10.1159/000485506.
3. Zambrano E, Reyes-Castro LA, Nathanielsz PW. Aging, glucocorticoids and developmental programming.
Age (Dordr) 2015; 37(3): 9774.https://doi.org/10.1007/s11357-015-9774-0.
4. Tarry-Adkins JL, Ozanne SE. Nutrition in early life and age-associated diseases. Ageing Res Rev 2017; 39:
96–105.https://doi.org/10.1016/j.arr.2016.08.003.
5. Khan IY, Dekou V, Douglas G, Jensen R, Hanson MA, Poston L, et al. A high-fat diet during rat pregnancy or suckling induces cardiovascular dysfunction in adult offspring. Am J Physiol Regul Integr Comp Physiol 2005; 288(1): R127–33.https://doi.org/10.1152/ajpregu.00354.2004.
6. Zhang ZY, Dai YB, Wang HN, Wang MW. Supplementation of the maternal diet during pregnancy with chocolate and fructose interacts with the high-fat diet of the young to facilitate the onset of metabolic dis- orders in rat offspring. Clin Exp Pharmacol Physiol 2013; 40(9): 652–61.https://doi.org/10.1111/1440-1681.
12147.
7. Leturque A, Burnol AF, de Saintaurin MA, Penicaud L, Girard J. Effect of feeding a high-fat diet during pregnancy on glucose metabolism in the rat. Metabolism 1987; 36(1): 66–70.
8. Painter RC, Roseboom TJ, Bleker OP. Prenatal exposure to the Dutch famine and disease in later life: an overview. Reprod Toxicol 2005; 20(3): 345–52.https://doi.org/10.1007/s11357-020-00199-9.
9. Rodriguez-Gonzalez GL, Reyes-Castro LA, Vega CC, Boeck L, Ibanez C, Nathanielsz PW, et al. Accelerated aging of reproductive capacity in male rat offspring of protein-restricted mothers is associated with increased testicular and sperm oxidative stress. Age (Dordr) 2014; 36(6): 9721. https://doi.org/10.1007/s11357-014- 9721-5.
10. Barker DJ, Gluckman PD, Godfrey KM, Harding JE, Owens JA, Robinson JS. Fetal nutrition and cardio- vascular disease in adult life. Lancet 1993; 341(8850): 938–41.
11. Palliyaguru DL, Rudderow AL, Sossong AM, Lewis KN, Younts C, Pearson KJ, et al. Perinatal diet influences health and survival in a mouse model of leukemia. Geroscience 2020; 42(4): 1147–55.https://doi.org/10.1007/
s11357-020-00199-9.
12. Lindeboom M, Portrait F, van den Berg GJ. Long-run effects on longevity of a nutritional shock early in life:
the Dutch Potato famine of 1846–1847. J Health Econ 2010; 29(5): 617–29.https://doi.org/10.1016/j.jhealeco.
2010.06.001.
13. Flegal KM, Graubard BI, Williamson DF, Gail MH. Excess deaths associated with underweight, overweight, and obesity. Jama 2005; 293(15): 1861–7.https://doi.org/10.1001/jama.293.15.1861.
14. Fontaine KR, Redden DT, Wang C, Westfall AO, Allison DB. Years of life lost due to obesity. Jama 2003;
289(2): 187–93.https://doi.org/10.1001/jama.289.2.187.
15. Xu W, Caracciolo B, Wang HX, Winblad B, Backman L, Qiu C, et al. Accelerated progression from mild cognitive impairment to dementia in people with diabetes. Diabetes 2010; 59(11): 2928–35.https://doi.org/10.
2337/db10-0539.
16. Morley JE. Diabetes, sarcopenia, and frailty. Clin Geriatr Med 2008; 24(3): 455–69, vi.https://doi.org/10.1016/
j.cger.2008.03.004.
17. Kirkland JL. Translating the science of aging into therapeutic interventions. Cold Spring Harb Perspect Med 2016; 6(3): a025908.https://doi.org/10.1101/cshperspect.a025908.
18. Topp R, Fahlman M, Boardley D. Healthy aging: health promotion and disease prevention. Nurs Clin North Am 2004; 39(2): 411–22.https://doi.org/10.1016/j.cnur.2004.01.007.
19. Wang TW, Apgar BS. Exercise during pregnancy. Am Fam Physician 1998; 57(8): 1846–52, 57.
20. ACOG Committee Opinion No. 650: Physical activity and exercise during pregnancy and the postpartum period. Obstet Gynecol 2015; 126(6): e135–42.https://doi.org/10.1097/AOG.0000000000001214.
21. Xu WH, Wu H, Xia WL, Lan H, Wang Y, Zhang Y, et al. Physical exercise before pregnancy helps the development of mouse embryos produced in vitro. Mitochondrion 2017; 34: 36–42.https://doi.org/10.1016/j.
mito.2016.12.004.
22. Wu Z, Li X, Zhang Y, Tong D, Wang L, Zhao P. Effects of sevoflurane exposure during mid-pregnancy on learning and memory in offspring rats: beneficial effects of maternal exercise. Front Cell Neurosci 2018; 12:
122.https://doi.org/10.3389/fncel.2018.00122.
23. Blaize AN, Pearson KJ, Newcomer SC. Impact of maternal exercise during pregnancy on offspring chronic disease susceptibility. Exerc Sport Sci Rev 2015; 43(4): 198–203. https://doi.org/10.1249/JES.
0000000000000058.
24. Sheldon RD, Nicole Blaize A, Fletcher JA, Pearson KJ, Donkin SS, Newcomer SC, et al. Gestational exercise protects adult male offspring from high-fat diet-induced hepatic steatosis. J Hepatol 2016; 64(1): 171–8.
https://doi.org/10.1016/j.jhep.2015.08.022.
25. Carter LG, Lewis KN, Wilkerson DC, Tobia CM, Ngo Tenlep SY, Shridas P, et al. Perinatal exercise improves glucose homeostasis in adult offspring. Am J Physiol Endocrinol Metab 2012; 303(8): E1061–8.https://doi.
org/10.1152/ajpendo.00213.2012.
26. Carter LG, Qi NR, De Cabo R, Pearson KJ. Maternal exercise improves insulin sensitivity in mature rat offspring. Med Sci Sports Exerc 2013; 45(5): 832–40.https://doi.org/10.1249/MSS.0b013e31827de953.
27. Camarillo IG, Clah L, Zheng W, Zhou X, Larrick B, Blaize N, et al. Maternal exercise during pregnancy reduces risk of mammary tumorigenesis in rat offspring. Eur J Cancer Prev 2014; 23(6): 502–5.https://doi.
org/10.1097/CEJ.0000000000000029.
28. Herring A, Donath A, Yarmolenko M, Uslar E, Conzen C, Kanakis D, et al. Exercise during pregnancy mitigates Alzheimer-like pathology in mouse offspring. FASEB J 2012; 26(1): 117–28.https://doi.org/10.1096/
fj.11-193193.
29. Stanford KI, Lee MY, Getchell KM, So K, Hirshman MF, Goodyear LJ. Exercise before and during pregnancy prevents the deleterious effects of maternal high-fat feeding on metabolic health of male offspring. Diabetes 2015; 64(2): 427–33.https://doi.org/10.2337/db13-1848.
30. Clapp JF, 3rd. Morphometric and neurodevelopmental outcome at agefive years of the offspring of women who continued to exercise regularly throughout pregnancy. J Pediatr 1996; 129(6): 856–63.
31. Nomura Y, Lambertini L, Rialdi A, Lee M, Mystal EY, Grabie M, et al. Global methylation in the placenta and umbilical cord blood from pregnancies with maternal gestational diabetes, preeclampsia, and obesity. Reprod Sci 2014; 21(1): 131–7.https://doi.org/10.1177/1933719113492206.
32. Reynolds LJ, Dickens BJ, Green BB, Marsit CJ, Pearson KJ. Using neonatal skin to study the developmental programming of aging. Exp Gerontol 2017; 94: 93–8.https://doi.org/10.1016/j.exger.2016.12.015.
33. Reynolds LJ, Pollack RI, Charnigo RJ, Rashid CS, Stromberg AJ, Shen S, et al. Increased birth weight is associated with altered gene expression in neonatal foreskin. J Dev Orig Health Dis 2017: 1–9.https://doi.org/
10.1017/S2040174417000290.
34. Salmon AB, Dorigatti J, Huber HF, Li C, Nathanielsz PW. Maternal nutrient restriction in baboon programs later-life cellular growth and respiration of cultured skinfibroblasts: a potential model for the study of aging- programming interactions. Geroscience 2018; 40(3): 269–78.https://doi.org/10.1007/s11357-018-0024-0.
35. Morris BJ, Bailis SA, Wiswell TE. Circumcision rates in the United States: rising or falling? What effect might the new affirmative pediatric policy statement have? Mayo Clin Proc 2014; 89(5): 677–86.https://doi.org/10.
1016/j.mayocp.2014.01.001.
36. Reid RER, Insogna JA, Carver TE, Comptour AM, Bewski NA, Sciortino C, et al. Validity and reliability of Fitbit activity monitors compared to ActiGraph GT3Xþwith female adults in a free-living environment. J Sci Med Sport 2017; 20(6): 578–82.https://doi.org/10.1016/j.jsams.2016.10.015.
37. Alharbi M, Bauman A, Neubeck L, Gallagher R. Validation of Fitbit-Flex as a measure of free-living physical activity in a community-based phase III cardiac rehabilitation population. Eur J Prev Cardiol 2016; 23(14):
1476–85.https://doi.org/10.1177/2047487316634883.
38. Nelson MB, Kaminsky LA, Dickin DC, Montoye AH. Validity of consumer-based physical activity monitors for specific activity types. Med Sci Sports Exerc 2016; 48(8): 1619–28.https://doi.org/10.1249/MSS.
0000000000000933.
39. Sushames A, Edwards A, Thompson F, McDermott R, Gebel K. Validity and reliability of Fitbit Flex for step count, moderate to vigorous physical activity and activity energy expenditure. PLoS One 2016; 11(9):
e0161224.https://doi.org/10.1371/journal.pone.0161224.
40. Huberty JL, Buman MP, Leiferman JA, Bushar J, Adams MA. Trajectories of objectively-measured physical activity and sedentary time over the course of pregnancy in women self-identified as inactive. Prev Med Rep 2016; 3: 353–60.https://doi.org/10.1016/j.pmedr.2016.04.004.
41. St-Laurent A, Mony MM, Mathieu ME, Ruchat SM. Validation of the Fitbit zip and Fitbit Flex with pregnant women in free-living conditions. J Med Eng Technol 2018; 42(4): 259–64.https://doi.org/10.1080/03091902.
2018.1472822.
42. Kubota A, Nagata J, Sugiyama M, Ishiduka K, Unno Y. [How many days of pedometer monitoring predict weekly physical activity in Japanese adults?]. Nihon Koshu Eisei Zasshi 2009; 56(11): 805–10.
43. Tudor-Locke C, Burkett L, Reis JP, Ainsworth BE, Macera CA, Wilson DK. How many days of pedometer monitoring predict weekly physical activity in adults? Prev Med 2005; 40(3): 293–8.https://doi.org/10.1016/j.
ypmed.2004.06.003.
44. Berglund SR, Schwietert CW, Jones AA, Stern RL, Lehmann J, Goldberg Z. Optimized methodology for sequential extraction of RNA and protein from small human skin biopsies. J Invest Dermatol 2007; 127(2):
349–53.https://doi.org/10.1038/sj.jid.5700557.
45. Geiss GK, Bumgarner RE, Birditt B, Dahl T, Dowidar N, Dunaway DL, et al. Direct multiplexed measurement of gene expression with color-coded probe pairs. Nat Biotechnol 2008; 26(3): 317–25.https://doi.org/10.1038/
nbt1385.
46. Pinheiro J BD, DebRoy S, Sarkar D. Linear and nonlinear mixed effects model. R package version 3.1-140 ed2019.
47. Benjamini Y KA, Yekutieli D. Adaptive linear step-up procedures that control the false discovery rate.
Biometrika 2006; 93(3): 491–507.
48. Brun RP, Tontonoz P, Forman BM, Ellis R, Chen J, Evans RM, et al. Differential activation of adipogenesis by multiple PPAR isoforms. Genes Dev 1996; 10(8): 974–84.
49. Spiegelman BM. PPAR-gamma: adipogenic regulator and thiazolidinedione receptor. Diabetes 1998; 47(4):
507–14.
50. Kota BP, Huang TH, Roufogalis BD. An overview on biological mechanisms of PPARs. Pharmacol Res 2005;
51(2): 85–94.https://doi.org/10.1016/j.phrs.2004.07.012.
51. Dietz WH. Childhood weight affects adult morbidity and mortality. J Nutr 1998; 128(2 Suppl): 411S–4S.
https://doi.org/10.1093/jn/128.2.411S.
52. Zhang H, Guan M, Townsend KL, Huang TL, An D, Yan X, et al. MicroRNA-455 regulates brown adipo- genesis via a novel HIF1an-AMPK-PGC1alpha signaling network. EMBO Rep 2015; 16(10): 1378–93.https://
doi.org/10.15252/embr.201540837.
53. Leow SC, Poschmann J, Too PG, Yin J, Joseph R, McFarlane C, et al. The transcription factor SOX6 con- tributes to the developmental origins of obesity by promoting adipogenesis. Development 2016; 143(6):
950–61.https://doi.org/10.1242/dev.131573.
54. Nizielski SE, Arizmendi C, Shteyngarts AR, Farrell CJ, Friedman JE. Involvement of transcription factor C/
EBP-beta in stimulation of PEPCK gene expression during exercise. Am J Physiol 1996; 270(5 Pt 2):
R1005–12.https://doi.org/10.1152/ajpregu.1996.270.5.R1005.
55. Thorens B, Charron MJ, Lodish HF. Molecular physiology of glucose transporters. Diabetes Care 1990; 13(3):
209–18.
56. Miele C, Formisano P, Condorelli G, Caruso M, Oriente F, Andreozzi F, et al. Abnormal glucose transport and GLUT1 cell-surface content infibroblasts and skeletal muscle from NIDDM and obese subjects. Dia- betologia 1997; 40(4): 421–9.https://doi.org/10.1007/s001250050696.
57. Rodnick KJ, Henriksen EJ, James DE, Holloszy JO. Exercise training, glucose transporters, and glucose transport in rat skeletal muscles. Am J Physiol 1992; 262(1 Pt 1): C9–14.https://doi.org/10.1152/ajpcell.1992.
262.1.C9.
58. Goodyear LJ, Hirshman MF, Valyou PM, Horton ES. Glucose transporter number, function, and subcellular distribution in rat skeletal muscle after exercise training. Diabetes 1992; 41(9): 1091–9.
59. Acosta O, Ramirez VI, Lager S, Gaccioli F, Dudley DJ, Powell TL, et al. Increased glucose and placental GLUT-1 in large infants of obese nondiabetic mothers. Am J Obstet Gynecol 2015; 212(2): 227 e1–7.https://
doi.org/10.1016/j.ajog.2014.08.009.
60. Kadowaki T, Yamauchi T, Kubota N, Hara K, Ueki K, Tobe K. Adiponectin and adiponectin receptors in insulin resistance, diabetes, and the metabolic syndrome. J Clin Invest 2006; 116(7): 1784–92.https://doi.org/
10.1172/JCI29126.
61. Elliott K, O'Conner, M., O'Conner, M. Embryogenesis in mammals. 1st ed. John Wiley & Sons, Inc.; 2008.
62. De Kock J, Najar M, Bolleyn J, Al Battah F, Rodrigues RM, Buyl K, et al. Mesoderm-derived stem cells: the link between the transcriptome and their differentiation potential. Stem Cells Dev 2012; 21(18): 3309–23.
https://doi.org/10.1089/scd.2011.0723.
63. nCounter expression data analysis Guide. Seattle, Washington: NanoString Technologies; 2012.https://www.
nanostring.com/download_file/view/251/3842. 2019.
64. Reynolds LJ, Chavan NR, DeHoff LB, Preston JD, Maddox HF, O'Brien JM, et al. Smoking during pregnancy increases chemerin expression in neonatal tissue. Exp Physiol 2019; 104(1): 93–9.https://doi.org/10.1113/
EP087307.
65. Reynolds LJ, Dickens BJ, Green BB, Marsit CJ, Pearson KJ. Using neonatal skin to study the developmental programming of aging. Exp Gerontol 2017; 94: 93–8.https://doi.org/10.1016/j.exger.2016.12.015.