L E T T E R The geography of metapopulation synchrony in dendritic river networks
Stefano Larsen,1,2* Lise Comte,3,4 Ana Filipa Filipe,5,6 Marie-Jos´ee Fortin,7 Claire Jacquet,8,9,10 Remo Ryser,11,12 Pablo A. Tedesco,13 Ulrich Brose,11,12 Tibor Er˝os,14 Xingli Giam,4 Katie Irving,15,16 Albert Ruhi,16 Sapna Sharma17 and Julian D. Olden3
Abstract
Dendritic habitats, such as river ecosystems, promote the persistence of species by favouring spa- tial asynchronous dynamics among branches. Yet, our understanding of how network topology influences metapopulation synchrony in these ecosystems remains limited. Here, we introduce the concept of fluvial synchrogram to formulate and test expectations regarding the geography of metapopulation synchrony across watersheds. By combining theoretical simulations and an exten- sive fish population time-series dataset across Europe, we provide evidence that fish metapopula- tions can be buffered against synchronous dynamics as a direct consequence of network connectivity and branching complexity. Synchrony was higher between populations connected by direct water flow and decayed faster with distance over the Euclidean than the watercourse dimen- sion. Likewise, synchrony decayed faster with distance in headwater than mainstem populations of the same basin. As network topology and flow directionality generate fundamental spatial pat- terns of synchrony in fish metapopulations, empirical synchrograms can aid knowledge advance- ment and inform conservation strategies in complex habitats.
Keywords
Fish time-series, fluvial variography, metapopulations, network topology, spatial patterns, spatial synchrony.
Ecology Letters(2021)24: 791–801
INTRODUCTION
Metapopulation synchrony, the coherent temporal dynamics in the abundance of spatially separated populations, has been observed across a wide range of taxa and is now considered a fundamental property of metapopulations (Liebhold et al.
2004; Wang et al. 2019). Spatial synchrony has well-recog- nised implications for the long-term persistence of species and ecosystem stability (Heinoet al. 1997; Wilcoxet al. 2017; Eros˝ et al. 2020). Synchrony can decrease opportunities for demo- graphic rescue among populations leading to higher local extinction risks when facing environmental change, while asynchrony may lead to longer-term stability (Loreau et al.
2003). Spatial synchrony can arise from a combination of
intrinsic and extrinsic mechanisms, including dispersal among connected populations, community processes such as preda- tor–prey interactions, and spatially correlated environmental factors, also known as the Moran effect (Moran 1953; Gren- fell et al. 1998; Liebhold et al. 2004). Disentangling these mechanisms remains challenging, except in simulation studies (e.g. Wang et al. 2019) or in specific geographical contexts where dispersal between populations is prevented (e.g.
Tedescoet al. 2004).
Scientific investigations have recently focused on examining the spatial dimensions of synchrony (Walter et al. 2017), pre- dominantly relying on exploring the decay of synchrony with geographic distance among populations (Hanski & Woiwod 1993; Sutcliffe et al. 1996; Abbott 2007; Jarillo et al. 2018).
1Unit of Computational Biology, Research and Innovation Centre, Fondazione Edmund Mach, via E. Mach 1, San Michele all’Adige 38010, Italy
2Department of Civil Environmental and Mechanical Engineering, University of Trento, Trento, Italy
3School of Aquatic and Fishery Sciences, University of Washington, Seattle, WA 98105, USA
4School of Biological Sciences, Illinois State University, Normal IL 61790, USA
5CIBIO/InBio, Centro de Investigac¸˜ao em Biodiversidade e Recursos Gen´eticos, Universidade do Porto, Vairao, Portugal˜
6Instituto Superior de Agronomia, Universidade de Lisboa, Lisboa, Portugal
7Department of Ecology and Evolutionary Biology, University of Toronto, Tor- onto, ON M5S 3B2, Canada
8Department of Aquatic Ecology, Swiss Federal Institute of Aquatic Science and Technology, Eawag, D¨ubendorf, Switzerland
9Complex Systems Lab, INRAE–Centre Clermont-Auvergne-Rhone-Alpes, 9ˆ avenue Blaise Pascal, Aubi`ere, 63170, France
10Department of Evolutionary Biology and Environmental Studies, University of Zurich, Zurich, Switzerland¨
11German Centre for Integrative Biodiversity Research (iDiv) Halle-Jena-Leip- zig, Leipzig 04103, Germany
12Institute of Biodiversity, Friedrich-Schiller-University Jena, Jena 07743, Ger- many
13UMR EDB, CNRS 5174, UPS, Universite Paul Sabatier, IRD 253, Toulouse,´ France
14MTA Centre for Ecological Research, Balaton Limnological Institute, Klebels- berg K. u. 3, Tihany 8237, Hungary
15Biology Department, Southern California Coastal Water Research Project, Costa Mesa, CA 92626, USA
16Department of Environmental Science, Policy, and Management, University of California, Berkeley, Berkeley, CA 94720, USA
17Department of Biology, York University, 4700 Keele Street, Toronto, ON M3J 1P3, Canada
*Correspondence: E-mail: larsen.stefano@gmail.com
©2021 The Authors.Ecology Letterspublished by John Wiley & Sons Ltd.
Despite important insights gained, this approach typically assumes isotropic changes in synchrony across homogeneous landscapes and thus potentially overlooks complex spatial pat- terns. Such challenges are acutely manifested in river ecosys- tems where both metapopulations and environmental dynamics reflect the topology, directionality and connectivity of the network. The isotropic assumption is clearly violated in river systems whose network geometry has profound influence on instream physical, ecological and evolutionary processes. In fact, the unique attributes of hierarchical dendritic structures relative to linear or random networks have long been recog- nised (Campbell Grant et al. 2007; Eros˝ et al. 2012; Filipe et al. 2017; Eros & Lowe 2019), with models linking the˝ branching connectivity of river-like networks with greater metapopulation persistence (Fagan 2002; Sarhad et al. 2014;
Maet al. 2020). This occurs because river geometry (hereafter
‘network topology’) and the unidirectional water flow promote asynchronous dynamics among populations, thus favouring species persistence (Yeakelet al. 2014; Tonkinet al. 2018).
Riverine metapopulation dynamics have been investigated extensively in recent theoretical and experimental works (e.g.
Yeakel et al. 2014; Bertuzzo et al. 2015; Altermatt & Fron- hofer 2018; Anderson & Hayes 2018). Yet, assessments of how network topology influences the spatio-temporal dynam- ics and synchrony of metapopulations in natural river systems are strikingly rare, despite the conservation implications of such studies (Moore et al. 2015; Terui et al. 2018). Here, we address this issue using freshwater fishes of Europe as an exemplar. Focusing on the influence of dispersal and Moran effect on synchrony within river networks, we first derive the- oretical expectations regarding spatial aspects of riverine metapopulation synchrony based on principles of fluvial vari- ography (i.e. geostatistics accounting for spatial dependencies within dendritic networks; Peterson et al. 2013) and network theory (Er˝os & Lowe 2019). We further support the key expectations using simulations from a spatially explicit meta- community model applied to river networks. This provides the theoretical basis of the ‘fluvial synchrogram’ concept as a graphical exploratory tool. Next, we confront expectations from theoretical synchrograms using empirical synchrony esti- mates between>34 000 pairs of fish species populations from an extensive abundance time-series data across Europe (Comte et al. 2021). Although not designed to provide an explicit quantification of the different synchrony mechanisms, our analytical framework elucidates the emerging patterns of synchrony manifested from spatial variations in the underly- ing mechanisms. We thus articulate an empirically driven
‘geography of synchrony’ (Defriez & Reuman 2017; Walter et al. 2017) within river basins. Our results demonstrate the existence of fundamental aspects of population synchrony that are directly predictable from network topology and in-stream connectivity. Network branching complexity appears to buffer synchronous dynamics, and headwater fish populations dis- play a faster decay of synchrony with distance compared to those in mainstem habitats. By allowing prediction of syn- chrony patterns even if empirical population time-series are not available, our findings have implications for the persis- tence and management of populations in complex habitats, such as streams and rivers that support high levels of diversity
and are among the most threatened ecosystems globally (Tick- neret al. 2020).
MATERIAL AND METHODS
Theoretical expectations of metapopulation synchrony and the fluvial synchrogramconcept
Here, we derive key expectations regarding the geography of fish metapopulations synchrony within river networks (Figs 1 and 2). To visualise these expectations, we propose the con- cept offluvial synchrogram(Fig. 1), and present basic theoreti- cal synchrograms using simulated abundance time-series from a spatially explicit dynamic metacommunity model (Ryser et al. 2019). Importantly, the simulation model was used to illustrate the key expected patterns in synchrony, but not to resolve the role of network complexityper seon fish metapop- ulation dynamics. As such, we did not perform multiple simu- lations of river network configurations as this has been covered by previous investigations (e.g. Yeakel et al. 2014;
Anderson & Hayes 2018). The metacommunity model corre- sponds to a food chain composed of a basal resource (e.g.
algae) supported by nutrients, an herbivore (e.g. macroinverte- brate) and a fish predator, where fish and herbivores are able to disperse between patches of a river network generated with optimal channel network methods, implemented in R by the OCNet package (Carraro et al. 2020). Using metacommunity simulations allowed us to explore the extent to which spatial patterns of synchrony could emerge directly from dispersal and the unique structure of dendritic river networks (see Appendix S1 in Supplementary Information for description of the metacommunity model).
We further derive expectations on how synchrograms are likely to vary within stream networks – from headwater to mainstem reaches – and between networks of different branching complexity.
The fluvial synchrogram concept
In order to capture the inherent spatial complexity of river habitats, dedicated geostatistical approaches are needed to reveal spatial structures over both Euclidean and watercourse dimensions, while concurrently accounting for flow direction- ality (Peterson et al. 2013; Zimmerman & Ver Hoef 2017).
Geographical separation between sampling locations (popula- tions) on a river network can be measured by three types of distance (Fig. 1a): Euclidean, watercourse (hydrological dis- tance) and flow-connected (hydrological distance between locations where water flows from one to the other). We draw from fluvial geostatistics and introduce the ‘fluvial synchro- gram’ as a graphical exploratory tool to depict the decay of pairwise population synchrony with these distances. To illus- trate the expected patterns, we derived theoretical synchro- grams using simulated fish abundance time-series on a 100- segment river network (Fig. 1b; Appendix S1).
Synchrograms among flow-connected populations can inform on the effect of hydrological connectivity and upstream dependence between populations. Conversely, syn- chrograms based on watercourse (including locations not
directly linked by water flow) and Euclidean distances describe relationships between populations in adjacent tribu- taries and across the wider landscape context respectively (Ver Hoef et al. 2006; Larsen et al. 2019). Patterns are then expected to differ among geographical distance types (Fig. 1 b). In the case of obligate aquatic biota, such as fish, we expect a steeper decay of synchrony over Euclidean than watercourse distance, the latter reflecting the actual connectiv- ity perceived by individuals (Olden et al. 2001). In addition, over relatively short distances, populations directly linked by water flow are likely to experience similar environmental
dynamics and higher dispersal rates, leading to higher syn- chrony than equally distant populations not connected by direct water flow (Tonkin et al. 2018). Over larger distances, however, this pattern may revert, as flow-connected popula- tions will necessarily inhabit reaches at the opposite ‘margin’
of the network (e.g. headwater to river mouth) and thus dis- play lower synchrony. In fluvial synchrograms, this is depicted as a relatively high synchrony at short distances and steep decay of synchrony for flow-connected populations (Fig. 1b).
Adding a third dimension to the fluvial synchrogram (3D synchrogram), we can calculate the ratio of Euclidean to
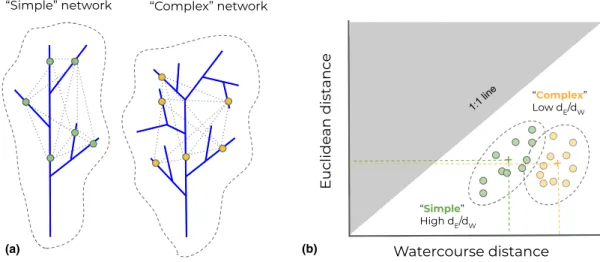
Figure 1(a) Hypothetical river network with five populations (labelledatoe) whose geographic separation can be measured as Euclidean (orange dashed lines) and hydrological distance (blue watercourse line). In addition, flow-connected locations can be identified in which water flows from one to the other (e.g. purple dashed line connectingatoe, but notatob, c ord). We refer to this distance as flow-connected. (b) Theoretical ‘Fluvial synchrogram’ derived from simulated metacommunity fish abundance time series (see text and Appendix S1), depicting the decay of pairwise population synchrony over the three types of spatial distances. (c) Theoretical ‘3D synchrogram’ displayed as 2D contour GAM model. The synchrony among pairs of spatially separated populations (small dots) can be plotted as a function of actual Euclidean distance (x-axis) against the ratio of Euclidean (dE) to Watercourse (dW) distance (dE/dW,y-axis). Four major types of pairwise distance combinations can be identified on the 3D synchrograms (D1 to D4), as shown in (a) and (c).
(a) (b)
Figure 2Relationship between network branching complexity and the ratio of Euclidean to watercourse distance (dE/dW) between populations, represented by colored dots over the networks (a). For populations distributed over ‘simple’ less branching basins, the mean pairwise dE/dWis expected to be higher;
that is closer to the 1:1 line, as indicated by the green dashed lines (b). Conversely, populations distributed in more branching ‘complex’ networks should be separated, on average, by lower dE/dWdistances (as the relative dWincreases). A geometric demonstration of these patterns is given in Fig. S1
watercourse distance (hereafter:dE/dW) to describe the relative location of any given pair of spatially separated populations within the network. Thus, the dE/dW metric represents a dimensionless measure of functional (as opposed to absolute) spatial separation as perceived by populations, which can be plotted for each pair-wise comparison. Values of dE/dWclose to 1 imply that populations are likely located on the same branch or segment of the network, whereas small values sug- gest that populations are located on different branches (Fig. 1 a and c). Low values of dE/dWcan also indicate separate loca- tions along the same branch of highly meandering rivers when the absolute Euclidean distance is small. According to this rationale, the synchrony between pairs of locations through- out a river network can be examined with respect to their values on the two-dimensional surface defined by dE/dWand Euclidean distances. We note that by including Euclidean distances on both axes of the 3D synchrogram, a spurious shape may occur due to the non-independent variable formu- lation (Pearson, 1897). However, we were not interested in the statistical relationships between dE/dW and Euclidean distances, but rather on how synchrony varies spatially with respect to both. Second, including the Euclidean distances on the x-axis allows anchoring the dimensionless dE/dWinto a spatially explicit context, where the distribution of site pairs is obviously influenced by the inherent structure of river networks (e.g. site pairs are unlikely to be located at the top right corner of the 3D synchrogram where Euclidean distances are large, but dE/dWis small; see Fig. 1c). The spa- tial synchrony patterns over the 3D synchrogram thus pro- vide an exploratory tool to appraise the underlying mechanisms.
Synchrograms can then help appraise the relative impor- tance of dispersal and Moran effect in determining observed synchrony. Indeed, watercourse distance and flow direction- ality are inherently related to dispersal probability. In con- trast, Euclidean distances are most likely reflecting the probability of a Moran effect, although we note that envi- ronmental autocorrelation can occur both along the Eucli- dean and watercourse dimensions (see Discussion). Four major expectations can be formulated according to combina- tions of pair-wise distances on the 3D synchrogram (D1 to D4; Fig. 1a and c). Populations separated by D1 (i.e. small and similar dE and dW) are likely located on the same net- work branch and expected to display high synchrony, being proximate in terms of both distance types and similarly influ- enced by dispersal and Moran effect. Conversely, popula- tions separated by D4 (i.e. large dEand much larger dW) are likely positioned on distant and separate branches and thus expected to display the lowest degree of synchrony. Popula- tions separated by D3 (i.e. small dE but much larger dW; located in separated but nearby branches) are expected to display intermediate degree of synchrony, which should be primarily influenced by a Moran effect. Finally, synchrony over D2 (i.e. large and equal dEand dW; distant populations, but likely located on the same branch) is also expected to display intermediate degree of synchrony resulting from a combination of both dispersal and a Moran effect. These expectations were well exemplified by the theoretical 3D syn- chrogram in Fig. 1c fitted using a tensor-product Generalised
Additive Model (GAM) on simulated metacommunity fish abundance time-series (described above).
Differences within networks
As the rate of dispersal among populations vary predictably across the network hierarchy, synchrograms are expected to differ between headwaters and mainstem reaches. According to river network theory, mainstem reaches are characterised by higher dispersal rates compared to more isolated headwa- ters due to their central position in the network, which inte- grates movements of organisms within and between branches (Brown & Swan 2010; Er˝os et al. 2012). In addition, local environmental conditions are also likely to vary more rapidly with distance in headwaters (e.g. Clarke et al. 2008). There- fore, we predict a faster decay of synchrony with distance between populations in low-order compared to high-order river segments.
Differences between networks
Basin shape and network topology inherently influence the position of population pairs over the 3D synchrogram. Popu- lations in complex branching networks will be, on average, separated by lower dE/dW distances compared to simpler branching networks (Fig. 2). As such, basin-level dE/dW is a measure of branching complexity that reflects the degree of branching separation experienced by populations, and it is expected to directly influence metapopulation dynamics.
Hence, the average dE/dW in a basin varies according to the distribution of populations and effectively captures the re- alised network complexity (Fig. S1). Moreover, although the data used to present our framework come from monitoring programmes whose sampling locations were not designed to reflect network branching, all available stream orders were well represented across the basins (Fig. S2).
In addition, highly branching networks are often charac- terised by relatively larger tributaries and higher proportions of geomorphically significant confluences (Benda et al. 2004), which promote physical heterogeneity along the river network (e.g. less predictable sediment size, and variability of reach- scale habitat features and flow regimes). Given these struc- tural constrains, we expect populations distributed in net- works with lower dE/dWdistances to display less synchronous dynamics.
Deriving empirical fluvial synchrograms
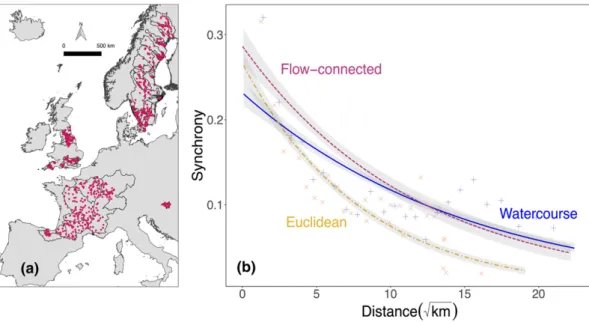
We compared theoretical synchrograms to the geography of fish metapopulation synchrony within 58 river basins through- out Europe (Fig. 3a) using long-term stream fish time-series (≥10 years; Comte et al. 2021). Surveys used standardised protocols through time, and sampling occurred during low flow periods (summer-autumn). The basins were selected to include at least eight sites (i.e. stream reaches; median=16;
range=8–63). Only species occurring in at least 80% of sam- pling events (median=7 species/basin; range=1–23 species/
basin) were included to limit the influence of zeros and low means when calculating synchrony (e.g. Chevalier et al. 2014).
Overall, the dataset contained 1150 sites, 48 species and
>34000 pairs of fish population time series.
Analytical approach
For each species in a given river basin, we expressed pairwise population synchrony as Spearman correlations between the pairs of abundance time-series. We extracted the Euclidean and watercourse distance separating each pair of populations, while also distinguishing population pairs directly linked by water flow (flow-connected), according to HydroRIVERS (Lehner et al. 2008). In the latter case, non-flow-connected populations were excluded from the model (Zimmerman &
Ver Hoef 2017). These data were combined to construct the empirical fluvial synchrogramdepicting the decay in synchrony over the Euclidean, watercourse and flow-connected distances.
The synchrony-decay was fitted with an exponential model:
y¼aebdistance, (1)
where y represents the pairwise synchrony, a the intercept, b the decay, and distance is square-root transformed. Confi- dence intervals for the different nonlinear fits were estimated using Monte Carlo uncertainty propagation as implemented in the R package ‘propagate’ (Spiess 2018). The exponential model with square-root transformed distances provided better fits to the data compared to linear and non-transformed mod- els (delta-AIC>10 in all cases; Table S1).
From the synchrograms we derived the decay (b), and the short-scale synchrony, corresponding to the 1st percentile of the empirical distance distribution (c. 1 km). This 1-km syn- chronywas used to indicate the maximum expected synchrony for each distance type and was considered as a more inter- pretable parameter than the model intercept (synchrony at 0- distance).
We then used null models to evaluate differences in model parameters between distances. We created null synchrograms by randomly shuffling (999 times) the ‘labels’ of distance types (i.e.
Euclidean, watercourse, flow-connected) within basins, while maintaining the observed distances and synchrony estimates.
This procedure broke the correspondence between synchrony and distance types within each basin, but preserved the overall data structure. We compared the observed differences in decay and 1-km synchrony between distance types with those from null synchrograms. Differences were expressed asz-score:
zscore¼ ½observedmeanðnullÞ=sdðnullÞ, (2) with|z-score| >1.96 indicating significant difference in param- eters between the examined distance types (Gotelli 2001).
To display the 3D synchrogram, we deployed a flexible local polynomial smoothing (LOESS) with a span=0.75, using Euclidean distance and dE/dW as predictors. To account for the complex structure of the data (i.e. multiple observations per species and basins) we also fitted synchrograms including random species and basin effects.
Differences within networks
To examine how synchrograms varied across the network hierarchy, we fitted synchrograms based on watercourse dis- tances separately for populations located in low-order (i.e.
headwaters; Strahler order 1-3, 12 934 population pairs, 37 species), high-order (i.e. downstream; order 4–7; 11106 popu- lation pairs, 40 species) and mixed order (between high- and low-order; 10 452 population pairs, 39 species) river segments.
Differences in synchrogram parameters between stream order groups were tested using null-models that randomly reshuffled synchrony values across stream order within basins, and were then expressed asz-scores as in eqn (2).
Figure 3(a) Location of sites (n=1150) and basins (58) used in the study. (b) Empirical synchrograms showing the decay of synchrony as separate exponential fits for watercourse (continuous line), Euclidean (dot-dashed) and flow-connected (dashed; directly linked by water flow) distances. Confidence intervals were estimated with Monte Carlo uncertainty propagation. To aid visualisation, the mean synchrony values for 30 distance bins is also shown for watercourse (indicated with ‘+’) and Euclidean (‘x’) distances, where each cross includes c.1100 population pairs.
Differences between networks
To assess the overall effect of branching complexity on metapopulation synchrony, we calculated the mean dE/dW between all pairs of sites within each basin. To control for the influence of basin size, mean dE/dW was regressed against basin area and residuals were used in the analyses. We then fitted synchrograms (over the watercourse dimension) for each species within each basin separately. For each basin, syn- chrony decay and 1-km synchrony were expressed as the mean among species weighted by species-specific overall abundance (Wang et al. 2019). We also computed basin-level synchro- gram parameters usinglog-transformed species abundances to reduce the influence of highly abundant species. The influence of basin-level dE/dWon the decay of synchrony and its values at 1-km, was tested using a simple linear regression. A quan- tile regression was further used to examine whether network branching specifically influenced the lower or upper distribu- tion of synchrogram parameters.
RESULTS
Empirical fluvial synchrograms
In accordance with the theoretical synchrograms, fish metapop- ulation synchrony decayed more rapidly over Euclidean distance than watercourse distance (Fig. 3b; z-score difference=7.35), which also displayed a slightly higher, albeit non-significant (z- score=−1.28), short-scale synchrony (Table 1).
Flow-connected populations displayed the highest short- scale synchrony (z-score difference from watercourse and Euclidean=−3.55 and −6.65 respectively) with higher syn- chrony up to c. 50 km separation (Fig. 3b). However, the decay in synchrony along flow-connected distances was stee- per than along watercourse distances (z-score=3.3), but simi- lar to the decay over the Euclidean dimension (z- score=1.13). The synchrogram fitted using random basin and species effects displayed similar patterns (Fig. S3).
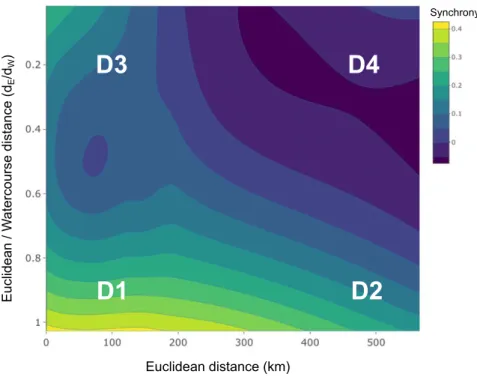
Agreeing with theoretical expectations, the 3D fish metapopulation synchrogram (Fig. 4) corresponded with the one obtained from the simulations (see Fig. 1c). The highest synchrony was observed between fish populations separated by short and comparable Euclidean and watercourse distances (D1 distance combination in Fig. 4; populations likely located on the same network branch). Conversely, the lowest
synchrony was found over D4 distance combination, as expected for populations separated by large Euclidean distances and inhabiting different branches. We also observed high syn- chrony between fish populations over short Euclidean dis- tances, albeit separated by relatively longer watercourse distances (D3 in Fig. 4), suggesting a Moran effect driving mechanism in adjacent headwaters. Similarly, the comparable level of synchrony predicted over D2 and D3 suggests that as the relative functional separation declines (i.e. ‘straighter’
watercourse distances with dE/dWapproaching 1), similar levels of synchrony manifest despite larger physical distances between populations. This implies that, over equal Euclidean separation, fish populations in more branching networks (i.e. with lower dE/dW) are likely to display less synchronous dynamics.
Differences within networks
Synchrograms differed when separately modelling fish popula- tions within low-order, high-order and mixed-order river seg- ments. Synchrony decayed faster for populations occupying low-order streams compared to mainstem populations (Fig. 5;
z-score=2.98). Also, the short-scale synchrony for low-order streams was slightly higher than for high-order streams, with a marginally significantz-score=−1.96, reflecting higher syn- chrony between headwater populations within c. 25 km stream distance. The lowest level of synchrony occurred between populations in low- and high-order reaches (mixed- order; Table 1) with lower 1-km synchrony than high-order populations (z-score=5.56), albeit similar decay with distance (z-score=−1.45).
Differences between networks
Basin-level 1-km synchrony (weighted by overall species abun- dance) increased significantly as network complexity declined (i.e. larger dE/dW, independent of basin size (Fig. 6a;
P=0.03). This occurred despite observing similar basin-level decay of synchrony with distance (Fig. 6b). This suggests that network branching complexity, as perceived by populations, can influence the maximum levels of synchrony within a net- work. This is further supported by the significant increase in the upper quantile of 1-km synchrony in less branching net- works (grey line in Fig. 6; quantile regression at q=0.8;
P<0.001). Qualitatively similar results were observed when weighting basin-level synchrony by the log-transformed spe- cies abundance (Fig. S6).
DISCUSSION
In this study, we introduce the fluvial synchrogram as a con- ceptual framework and exploratory tool to examine the geog- raphy of metapopulation synchrony within riverine dendritic networks. Using simulations and empirical data, we showed that fundamental spatial aspects of fish metapopulation syn- chrony can be predicted from stream network topology and connectivity. Fluvial synchrograms revealed that spatial pat- terns in fish temporal dynamics resembled those typical of spa- tial dynamics within dendritic networks. The overall shape of the fluvial synchrogram mirrored the spatial autocorrelation
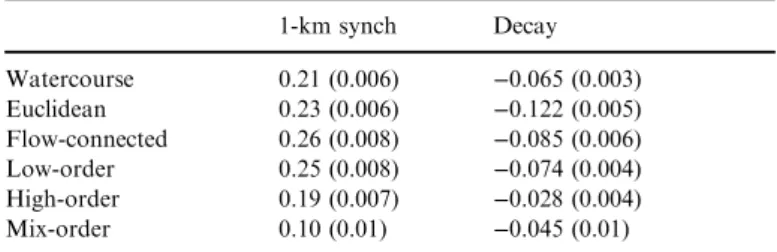
Table 1 Parameters from synchrograms (SE) including synchrony esti- mates at 1-km distance (1-km synch) and decay for watercourse, Eucli- dean and flow-connected distances, and between low-, high- and mixed- order stream pairs (over watercourse distance)
1-km synch Decay
Watercourse 0.21 (0.006) −0.065 (0.003)
Euclidean 0.23 (0.006) −0.122 (0.005)
Flow-connected 0.26 (0.008) −0.085 (0.006)
Low-order 0.25 (0.008) −0.074 (0.004)
High-order 0.19 (0.007) −0.028 (0.004)
Mix-order 0.10 (0.01) −0.045 (0.01)
patterns often revealed by empirical variograms in river net- works, known as ‘Torgegrams’ (Peterson et al. 2013; Zimmer- man & Ver Hoef 2017). For instance, for most in-stream variables and processes, flow-connected locations often display higher spatial correlation (analogous to higher synchrony here) than those not directly linked by flow; however, this relation- ship can often reverse at larger distances (e.g. Fig. 7 in Peterson
et al. 2013). The role of spatial processes and network topology in driving synchrony was further supported by the similarity of the empirical synchrograms with patterns derived from simula- tions that emerged from dispersal within dendritic networks.
The observed empirical patterns also indicate that network structure, such as the relative proportion of low- and high-order segments and network branching complexity, can directly
Synchrony
D1 D2
D4 D3
Euclidean distance (km) Euclidean / Watercourse distance (dE/dW)
Figure 43D synchrogram modelled as 2D contour LOESS illustrating fish metapopulation synchrony over the plane defined by the ratio Euclidean/
watercourse distance (dE/dW) against Euclidean distance. The position of four major types of pair-wise distance combinations over the plane are also shown (D1 to D4, as presented in Fig. 1). See Figs. S4 and S5 for an alternative formulation of the 3D synchrograms using a tensor-product GAM that include random basin and species effects.
Low−order
High−order Mixed−order
0.1 0.2 0.3
0 5 10 15 20
Watercourse distance( km)
Synchrony
Figure 5Synchrograms fitted separately for fish populations within low- (headwaters), high- (mainstem) and mixed-order stream reaches. Confidence intervals were estimated with Monte Carlo uncertainty propagation.
regulate the degree of synchrony among fish populations. In particular, the steeper decline of synchrony among headwater populations implies a stronger effect of isolation by distance.
This is consistent with stream network theory, where connectiv- ity and dispersal are predicted to be higher over the central nodes (mainstem) than the marginal nodes (headwater) of the network (Finnet al. 2007; Brown & Swan 2010; Er˝os & Lowe 2019). This may reflect a general tendency for fish species to dis- perse less along headwaters than mainstem segments (e.g.
Radinger & Wolter 2014), and the fact that environmental con- ditions could change more rapidly and unpredictably along headwater reaches (Clarkeet al. 2008), thus limiting synchrony.
However, synchrony remained high between headwater popula- tions up to c. 25 km watercourse distance. It is possible that over such relatively short distances, environmental conditions change less along low-order than high-order reaches, where the presence of tributaries and human pressure could have impor- tant influences. The empirically derived synchrony patterns across the network hierarchy are also coherent with the theoret- ical expectations shown in the 3D synchrograms. Fish popula- tions in headwaters were, on average, separated by lower dE/dW (0.45) compared to those in the mainstem (0.57). That is, they would be primarily located on the upper half of the 3D synchro- gram in Fig. 4, where synchrony is lower. As expected, the
lowest synchrony occurred between headwaters and mainstem populations (mixed-order), as these are separated by equally low dE/dW(0.45), but are also likely to experience markedly dif- ferent environmental conditions.
Our results support the growing recognition that riverine metapopulations can be buffered against synchronous dynam- ics as a direct consequence of network branching (Yeakelet al.
2014; Terui et al. 2018). Interestingly, we found that network branching appeared to limit the maximum expected synchrony (i.e. at short distances) rather than its rate of decay. Our mea- sure ofrealisednetwork branching–mean dE/dWamong pop- ulations – is a proxy of dispersal limitation across the basin that reflects the actual distribution of the populations over the network, rather than the overall network shape.
However, basin shape and network branching are also related to the physical diversity of channel and riparian condi- tions (Benda et al. 2004). This is supported by the correlation between basin level dE/dW and circularity ratio (Fig. S7;
P<0.01; R2=0.15), a network-wide measure of basin com- pactness, which reflects confluence-mediated habitat hetero- geneity (Benda et al. 2004). This implies that both dispersal limitation and environmental-related mechanisms combine to buffer synchrony in branching river networks. Basin shape and branching geometry are controlled by factors such as cli- mate and geology across evolutionary times (Seybold et al.
2017; Yi et al. 2018), suggesting that the overall propensity for synchrony in riverine metapopulations may inherently depend on larger scale processes and biogeographic settings.
This study sought to elucidate the geography of metapopu- lation synchrony in river networks emerging from the spatial variation in the underlying mechanisms. As such, it was not designed to assess the contribution of species-specific dispersal or the influence of specific environmental factors (i.e. Moran effect). That is, the modelled synchrograms did not account for species and basin identity; however, patterns based on a mixed-modelling framework where species and basins were included as random factors were similar (Figs S2 and S4), supporting the generalities of our findings and the utility of synchrograms as exploratory tools. For instance, patterns of metapopulation synchrony could be compared with those obtained from environmental data to appraise the contribu- tion of Moran effects to population dynamics (e.g. Defriez &
Reuman 2017). The advantage of using fluvial synchrograms is that they can indicate whether Moran effects may be related to factors operating over the Euclidean (e.g. climate, fire) or the watercourse (e.g. water quality, flow-regime) dimension.
The importance of defining appropriate dispersal pathways and connectivity matrix beyond the Euclidean dimension has clearly emerged from recent studies of population synchrony (e.g. Anderson et al. 2017, 2019; Lopes et al. 2018; Zanon et al. 2018). This is particularly evident in constrained habitats where dispersal is directional or for organisms relying on wind-borne dispersal (Vindstad et al. 2019). Since fluvial syn- chrograms rely on multiple types of pairwise distances, several hypothesised drivers of synchrony could be examined using matrix regressions, which can specifically control for alterna- tive mechanisms (Walteret al. 2017).
Similarly, exploring differences in synchrograms fitted for different species (or functional groups) within the same basin
0.0 0.2 0.4 0.6
−0.2 0.0 0.2
Basin−level 1−km synch
−0.075
−0.050
−0.025 0.000 0.025
−0.2 0.0 0.2
Basin−level dE/dW (residuals)
Basin−level decay
Figure 6Relation of basin-level short-scale synchrony (1-km synch; a) and decay (b) over the watercourse dimension (weighted by overall species abundance) with the mean ratio of Euclidean – Watercourse distance between fish populations (mean dE/dW; controlled for basin area). Dashed line indicates non-significant relationship. Larger dE/dWvalues represent populations distributed, on average, over less branching networks. The significant upper quantile regression at q=0.8 is also shown (grey line; A).
represents an exciting research avenue into the relative impor- tance of dispersal (i.e. different patterns over the watercourse and flow-connected distance) versus environmental factors (i.e. different patterns over the Euclidean dimension) in driv- ing synchrony patterns.
Our understanding of how dendritic habitats influence spe- cies dispersal, persistence and diversity, has grown steadily over the last 20 years. Yet, the implications of river network structure for metapopulation synchrony and stability have been explored only recently and primarily through theoretical approaches. Overall, our results are consistent with theoretical work in showing that the geometry of river networks can inherently promote the persistence of species by favouring spatial asynchronous dynamics among localities (Yeakelet al.
2014; Anderson & Hayes 2018). This has important conserva- tion implications. The spatially explicit nature of synchro- grams allows estimating the distance at which synchrony falls below any desired thresholds. The ‘scale of synchrony’ is often used as such threshold, indicating the distance at which the exponential function decays at e−1≈0.37 of its maximum value (e.g. Myerset al. 1997; Jarillo et al. 2018). The scale of synchrony calculated from the overall fluvial synchrogram is comparable to what has been derived from other studies of stream fishes. Over the Euclidean dimensions, the scale of syn- chrony was 74 km, whereas for watercourse and flow-con- nected distance it was 161 and 154 km respectively. For comparison, Myers et al. (1997) reported values of c. 20 km (Euclidean) for species of pike (Esocidae) and perch (Percidae) and up to 180 km for Pacific salmon (Salmonidae) in streams.
Tedescoet al. (2004) reported high synchrony values (r =0.8) up toc. 200 km (Euclidean) for some tropical fish species.
Synchrograms can also help protect the stability of the basin level portfolio by identifying network branches that contribute the most to overall asynchrony (e.g. with shorter scales of syn- chrony). For instance we show how low-order segments can con- tribute to the maintenance of biodiversity in river networks by promoting asynchrony among populations. The importance of headwater ecosystems as hotspots of biodiversity is well recognised (e.g. Richardson 2019) and our results thus provide further theoretical and empirical support for their protection.
However, the key role of headwaters and habitat heterogene- ity in promoting asynchrony is threatened by modification in catchment land-use, flow-regimes and the establishment of non-native species that homogenise river landscapes globally (Poffet al. 2007; Eros˝ et al. 2020). The consequences of this are already evident, for example in the synchronous dynamics of benthic invertebrates in modified catchments (Ruhiet al.
2018). This calls for more efficient and holistic conservation efforts that explicitly include complex riverine habitats (e.g.
Colvinet al. 2019).
Our results indicate that network topology and asymmetric connectivity promote fundamental patterns of synchrony in fish populations. The analytical framework can be further relevant for the study of synchrony in any complex landscape where dis- persal is prevalently directional and constrained by a dendritic habitat template (e.g. Rayfieldet al. 2011; Fletcheret al. 2013).
Expanding the present framework to integrate interspecific syn- chrony represents a promising avenue for future research, given that interspecific interactions might scale-up to generate
emerging spatial patterns at the metacommunity level (Ander- son & Hayes 2018). We therefore hope that our study will stim- ulate further investigation of the mechanisms underlying the geometry of synchrony in complex habitats.
ACKNOWLEDGEMENTS
We thank all the researchers and monitoring programs who collected, maintained, and shared the datasets, without which our study would not have been possible. This paper is a joint effort of the international working group sYNGEO - The geography of synchrony in dendritic networks kindly sup- ported by sDiv, the Synthesis Centre of the German Centre for Integrative Biodiversity Research (iDiv) Halle-Jena-Leip- zig, funded by the German Research Foundation (FZT 118).
SL was also supported by funding from the European Union’s Horizon 2020 research and innovation programme under the Marie Skøodowska-Curie Grant Agreement No. 748969.
Several constructive comments from the Editor and three anonymous reviewers greatly improved the quality of the manuscript.
AUTHORSHIP
All authors contributed to developing the theoretical frame- work of the study. SL performed the analyses and wrote the first draft of the manuscript, with substantial contribution from LC, AFF, MJF, CJ, PD and JDO as core writing team.
CJ, RR and UB developed the metacommunity simulation model. All authors provided critical feedback that helped shape the research and the final draft.
PEER REVIEW
The peer review history for this article is available at https://
publons.com/publon/10.1111/ele.13699.
DATA AVAILABILITY STATEMENT
Data supporting the results are available in Figshare at https://figshare.com/s/9013dce8314e2cec6937. Moreover, raw fish time-series data are described in the data paper Comte et al 2020; DOI: 10.1111/geb.13210, and are publicly available through the iDiv data portal at https://doi.org/10.25829/idiv.
1873-10-4000.
REFERENCES
Abbott, K.C. (2007). Does the pattern of population synchrony through space reveal if the Moran effect is acting?Oikos, 116, 903–912.
Altermatt, F. & Fronhofer, E.A. (2018). Dispersal in dendritic networks:
Ecological consequences on the spatial distribution of population densities.Freshw. Biol., 63, 22–32.
Anderson, K.E. & Hayes, S.M. (2018). The effects of dispersal and river spatial structure on asynchrony in consumer-resource metacommunities.Freshw. Biol., 63, 100–113.
Anderson, T.L., Sheppard, L.W., Walter, J.A., Hendricks, S.P., Levine, T.D., White, D.S.et al. (2019). The dependence of synchrony on timescale and geography in freshwater plankton.Limnol. Oceanogr., 64, 483–502.
Anderson, T.L., Walter, J.A., Levine, T.D., Hendricks, S.P., Johnston, K.L., White, D.S. et al. (2017). Using geography to infer the
importance of dispersal for the synchrony of freshwater plankton.
Oikos, 127, 403–414.
Benda, L., Poff, N.L., Miller, D., Dunne, T., Reeves, G., Pess, G.et al.
(2004). The network dynamics hypothesis: how channel networks structure riverine habitats.Bioscience, 54, 413.
Bertuzzo, E., Rodriguez-Iturbe, I. & Rinaldo, A. (2015). Metapopulation capacity of evolving fluvial landscapes. Water Resour. Res., 51, 2696–2706.
Brown, B.L. & Swan, C.M. (2010). Dendritic network structure constrains metacommunity properties in riverine ecosystems. J. Anim.
Ecol., 79, 571–580.
Campbell Grant, E.H., Lowe, W.H. & Fagan, W.F. (2007). Living in the branches: population dynamics and ecological processes in dendritic networks.Ecol. Lett., 10, 165–175.
Carraro, L., Bertuzzo, E., Fronhofer, E.A., Furrer, R., Gounand, I., Rinaldo, A., et al. (2020). Generation and application of river network analogues for use in ecology and evolution.Ecol. Evol., 10, 7537–7550.
Chevalier, M., Laffaille, P. & Grenouillet, G. (2014). Spatial synchrony in stream fish populations: influence of species traits. Ecography, 37, 960–968.
Clarke, A., Mac Nally, R., Bond, N. & Lake, P.S. (2008).
Macroinvertebrate diversity in headwater streams: a review. Freshw.
Biol., 53, 1707–1721.
Colvin, S.A.R., Sullivan, S.M.P., Shirey, P.D., Colvin, R.W., Winemiller, K.O., Hughes, R.M.et al. (2019). Headwater streams and wetlands are critical for sustaining fish, fisheries, and ecosystem services. Fisheries, 44, 73–91.
Comte, L., Carvajal-Quintero, J., Tedesco, P., Giam, X., Brose, U., Eros, T.et al. (2021). RivFishTIME: A global database of fish time-series to study global change ecology in riverine systems.Glob. Ecol. Biogeogr., 30, 38–50.
Defriez, E.J. & Reuman, D.C. (2017). A global geography of synchrony for marine phytoplankton: Defriez and Reuman.Glob. Ecol. Biogeogr., 26, 867–877.
Eros, T., Comte, L., Filipe, A.F., Ruhi, A., Tedesco, P.A., Brose, U.˝ et al. (2020). Effects of nonnative species on the stability of riverine fish communities.Ecography, 43, 1156–1166.
Eros, T. & Lowe, W.H. (2019). The landscape ecology of rivers: from˝ patch-based to spatial network analyses.Curr. Landsc. Ecol. Rep., 4, 103–112.
Eros, T., Olden, J.D., Schick, R.S., Schmera, D. & Fortin, M.-J. (2012).˝ Characterizing connectivity relationships in freshwaters using patch- based graphs.Landsc. Ecol., 27, 303–317.
Fagan, W.F. (2002). Connectivity, fragmentation, and extinction risk in dendritic metapopulations.Ecology, 83, 3243–3249.
Filipe, A.F., Quaglietta, L., Ferreira, M., Magalh˜aes, M.F. & Beja, P.
(2017). Geostatistical distribution modelling of two invasive crayfish across dendritic stream networks.Biol. Invasions, 19, 2899–2912.
Finn, D.S., Blouin, M.S. & Lytle, D.A. (2007). Population genetic structure reveals terrestrial affinities for a headwater stream insect.
Freshw. Biol., 52, 1881–1897.
Fletcher, R.J., Revell, A., Reichert, B.E., Kitchens, W.M., Dixon, J.D. &
Austin, J.D. (2013). Network modularity reveals critical scales for connectivity in ecology and evolution.Nat. Commun., 4, 1–7.
Gotelli, N.J. (2001). Research frontiers in null model analysis.Glob. Ecol.
Biogeogr., 10, 337–343.
Grenfell, B.T., Wilson, K., Finkenstadt, B.F., Coulson, T.N., Murray, S.,¨ Albon, S.D.et al. (1998). Noise and determinism in synchronized sheep dynamics.Nature, 394, 674–677.
Hanski, I. & Woiwod, I.P. (1993). Spatial synchrony in the dynamics of moth and aphid populations.J. Anim. Ecol., 62, 656.
Heino, M., Kaitala, V., Ranta, E. & Lindstrom, J. (1997). Synchronous¨ dynamics and rates of extinction in spatially structured populations.
Proc. R. Soc. Lond. B Biol. Sci., 264, 481–486.
Jarillo, J., Saether, B.-E., Engen, S. & Cao, F.J. (2018). Spatial scales of population synchrony of two competing species: effects of harvesting and strength of competition.Oikos, 127, 1459–1470.
Larsen, S., Bruno, M.C., Vaughan, I.P. & Zolezzi, G. (2019). Testing the river continuum concept with geostatistical stream-network models.
Ecol. Complex., 39, 100773.
Lehner, B., Verdin, K. & Jarvis, A. (2008). New global hydrography from spaceborne elevation data. Eos, Transactions American Geophysical Union, 89, 93–94.
Liebhold, A., Koenig, W.D. & Bjørnstad, O.N. (2004). Spatial synchrony in population dynamics.Annu. Rev. Ecol. Evol. Syst., 35, 467–490.
Lopes, G.V., Castelo Branco, C.W.C., Kozwloski-Suzuki, B., Sousa- Filho, I.F. & Coimbra e Souza, L. & Bini, L.M. (2018). Environmental distances are more important than geographic distances when predicting spatial synchrony of zooplankton populations in a tropical reservoir.Fresh. Biol., 63, 1592–1601.
Loreau, M., Mouquet, N. & Gonzalez, A. (2003). Biodiversity as spatial insurance in heterogeneous landscapes.Proc. Natl. Acad. Sci. U. S. A., 100, 12765–12770.
Ma, C., Shen, Y., Bearup, D., Fagan, W.F. & Liao, J. (2020). Spatial variation in branch size promotes metapopulation persistence in dendritic river networks.Freshw. Biol., 65, 426–434.
Moore, J.W., Beakes, M.P., Nesbitt, H.K., Yeakel, J.D., Patterson, D.A., Thompson, L.A. et al. (2015). Emergent stability in a large, free- flowing watershed.Ecology, 96, 340–347.
Moran, P.A.P. (1953). The statistical analysis of the Canadian Lynx cycle.
Aust. J. Zool., 1, 291–298.
Myers, R.A., Mertz, G. & Bridson, J. (1997). Spatial scales of interannual recruitment variations of marine, anadromous, and freshwater fish.
JAWRA, 54, 8.
Olden, J.D., Jackson, D.A. & Peres-Neto, P.R. (2001). Spatial isolation and fish communities in drainage lakes.Oecologia, 127, 572–585.
Pearson, K. (1897). On a form of spurious correlation which may arise when indices are used in the measurement of organs. Proc. R. Soc.
London, 60, 489–498.
Peterson, E.E., Ver Hoef, J.M., Isaak, D.J., Falke, J.A., Fortin, M.-J., Jordan, C.E. et al. (2013). Modelling dendritic ecological networks in space: an integrated network perspective.Ecol. Lett., 16, 707–719.
Poff, N.L., Olden, J.D., Merritt, D.M. & Pepin, D.M. (2007).
Homogenization of regional river dynamics by dams and global biodiversity implications.Proc. Natl. Acad. Sci., 104, 5732–5737.
Radinger, J. & Wolter, C. (2014). Patterns and predictors of fish dispersal in rivers.Fish Fish., 15, 456–473.
Rayfield, B., Fortin, M.-J. & Fall, A. (2011). Connectivity for conservation:
a framework to classify network measures.Ecology, 92, 847–858.
Richardson, J. (2019). Biological diversity in headwater streams. Water, 11, 366.
Ruhi, A., Dong, X., McDaniel, C.H., Batzer, D.P. & Sabo, J.L. (2018).
Detrimental effects of a novel flow regime on the functional trajectory of an aquatic invertebrate metacommunity. Glob. Change Biol., 24, 3749–3765.
Ryser, R., Haussler, J., Stark, M., Brose, U., Rall, C.B. & Guill, C.¨ (2019). The biggest losers: habitat isolation deconstruct complex food webs from top to bottom.Proc. R. Soc. B, 286.
Sarhad, J., Carlson, R. & Anderson, K.E. (2014). Population persistence in river networks.J. Math. Biol., 69, 401–448.
Seybold, H., Rothman, D.H. & Kirchner, J.W. (2017). Climate’s watermark in the geometry of stream networks.Geophys. Res. Lett, 44, 2272–2280.
Spiess, A.-N. (2018). propagate: Propagation of Uncertainty. R package version 1.0-6.
Sutcliffe, O.L., Thomas, C.D. & Moss, D. (1996). Spatial synchrony and asynchrony in butterfly population dynamics.J. Anim. Ecol., 65, 85.
Tedesco, P.A., Hugueny, B., Paugy, D. & Fermon, Y. (2004). Spatial synchrony in population dynamics of West African fishes: a demonstration of an intraspecific and interspecific Moran effect. J.
Anim. Ecol., 73, 693–705.
Terui, A., Ishiyama, N., Urabe, H., Ono, S., Finlay, J.C. & Nakamura, F. (2018). Metapopulation stability in branching river networks.Proc.
Natl Acad. Sci., 115, E5963–E5969.
Tickner, D., Opperman, J.J., Abell, R., Acreman, M., Arthington, A.H., Bunn, S.E. et al. (2020). Bending the curve of global freshwater biodiversity loss: an emergency recovery plan.Bioscience, 70, 330–342.
Tonkin, J.D., Altermatt, F., Finn, D.S., Heino, J., Olden, J.D., Pauls, S.U.
et al. (2018). The role of dispersal in river network metacommunities:
Patterns, processes, and pathways.Freshw. Biol., 63, 141–163.
Ver Hoef, J.M., Peterson, E. & Theobald, D. (2006). Spatial statistical models that use flow and stream distance. Environ. Ecol. Stat., 13, 449–464.
Vindstad, O.P.L., Jepsen, J.U., Yoccoz, N.G., Bjørnstad, O.P., Mesquita, M.D.S. & Ims, R.A. (2019). Spatial synchrony in sub-arctic geometrid moth outbreaks reflects dispersal in larval and adult life cycle stages.J.
An. Ecol., 88, 1134–1145.
Walter, J.A., Sheppard, L.W., Anderson, T.L., Kastens, J.H., Bjørnstad, O.N., Liebhold, A.M. et al. (2017). The geography of spatial synchrony.Ecol. Lett., 20, 801–814.
Wang, S., Lamy, T., Hallett, L.M. & Loreau, M. (2019). Stability and synchrony across ecological hierarchies in heterogeneous metacommunities: linking theory to data.Ecography, 42, 1200–1211.
Wilcox, K.R., Tredennick, A.T., Koerner, S.E., Grman, E., Hallett, L.M., Avolio, M.L. et al. (2017). Asynchrony among local communities stabilises ecosystem function of metacommunities. Ecol. Lett., 20, 1534–1545.
Yeakel, J.D., Moore, J.W., Guimaraes, P.R. & de Aguiar, M.A.M.˜ (2014). Synchronisation and stability in river metapopulation networks.
Ecol. Lett., 17, 273–283.
Yi, R.S., Arredondo, A., Stansifer, E., Seybold, H. & Rothman, D.H. (2018).
Shapes of river networks.Proc. Roy. Soc A: Math. Phy. Eng. Sci., 474.
Zanon, J.E., Rodrigues, L. & Bini, L.M. (2018). Hard to predict:
Synchrony in epiphytic biomass in a floodplain is independent of spatial proximity, environmental distance, and environmental synchrony.Ecol. Ind., 93, 379–386.
Zimmerman, D.L. & Ver Hoef, J.M. (2017). The Torgegram for Fluvial Variography: characterizing spatial dependence on stream networks.J.
Comput. Graph. Stat., 26, 253–264.
SUPPORTING INFORMATION
Additional supporting information may be found online in the Supporting Information section at the end of the article.
Editor, Mikko Heino
Manuscript received 13 August 2020 First decision made 30 September 2020 Manuscript accepted 7 January 2021