CTOZ
© Péter Takács et al., 2022 | doi:10.1163/18759866-bja10026
This is an open access article distributed under the terms of the cc-by 4.0 license.
Infirm effect of phylogeny on morphometric features in a cryptic Gobio species complex
Péter Takács | ORCID: 0000-0001-5247-7597 Corresponding author,
Balaton Limnological Research Institute, Klebelsberg Kuno street 3, Tihany, 8237, Hungary takacs.peter@blki.hu
Gabor Maasz | ORCID: 0000-0001-5524-1424
Soós Ernő Research and Development Center, University of Pannonia, 8800 Nagykanizsa, Hungary
maasz.gabor@uni-pen.hu
Zita Zrínyi | ORCID: 0000-0001-9446-4874
Soós Ernő Research and Development Center, University of Pannonia, 8800 Nagykanizsa, Hungary
zrinyi.zita@uni-pen.hu
Nóra Boross | ORCID: 0000-0002-3362-160X
Balaton Limnological Research Institute, Klebelsberg Kuno street 3, Tihany, 8237, Hungary boross.nora@blki.hu
Zoltán Vitál | ORCID: 0000-0001-7832-082X
National Agricultural Research and Innovation Centre, Research Institute for Fisheries and Aquaculture, Anna-liget u. 35, Szarvas 5540, Hungary
Vital.Zoltan@uni-mate.hu
Dóra Ildikó Kánainé Sipos | ORCID: 0000-0001-7647-9861
Deparment of Molecular Ecology, Institute of Aquaculture and Environmental Safety, Hungarian University of Agricultural and Life Sciences, Gödöllő, 2100, Hungary kanai.dora@gmail.com
Bálint Bánó | ORCID: 0000-0001-7734-4803
Balaton Limnological Research Institute, Klebelsberg Kuno street 3, Tihany, 8237, Hungary Deparment of Molecular Ecology, Institute of Aquaculture and Environmental Safety, Hungarian University of Agricultural and Life Sciences, Gödöllő, 2100, Hungary bano.balint@blki.hu
Ádám Staszny | ORCID: 0000-0002-6166-8333
Department of Freshwater Fish Ecology, Institute of Aquaculture and Environmental Safety, Hungarian University of Agricultural and Life Sciences, Gödöllő, 2100, Hungary
Staszny.Adam@uni-mate.hu
Péter Sály | ORCID: 0000-0002-3936-2063
Centre for Ecological Research, Institute of Aquatic Ecology, Budapest, Karolina street 29, Hungary
saly.peter@ecolres.hu
Balázs Kovács | ORCID: 0000-0003-1753-5098
Department of Freshwater Fish Ecology, Institute of Aquaculture and Environmental Safety, Hungarian University of Agricultural and Life Sciences, Gödöllő, 2100, Hungary
Kovacs.Balazs@uni-mate.hu
received: 13 september 2021 | revised and accepted: 16 january 2022 editor: i. buj
Abstract
Several recent notes prove that taxonomic relations of close relative animal groups (species complexes or cryptic species) can be revealed by the combined use of genetic and morphologic methodologies.
At the same time scarce information can be found about how phylogeny, population origin, and sexual dimorphism affect the morphometric features of these species. In our present work, we performed simultaneous phylogenetic and morphological studies on the taxonomically still questionable Carpathian stream dwelling gudgeons (Cyprinidae, Gobio) by using two different methodologies (distance based and geometric morphometry). Our results were in correspondence with the previous findings, showing the presence of three phylogenetically more or less distinct groups in the area. The results of the whole-body geometric and the traditional, distance-based morphometry reflected the extent of phylogenetic differences.
While the results of geometric scale morphometry did not correspond with the genetic subdivisions.
Results of three way PERMANOVA analyses showed that the phylogenetic effects on morphometry is less considerable as the population origin or the sexual dimorphism at these cyprinid taxa. Our investigation contributed to the better understanding of the taxonomy of fish stocks in the Carpathian Basin, and to their conservation, but additional investigations will be needed to clarify the exact taxonomic position of the gudgeons (’Gobio sp1’) dominating the eastern part of the studied drainage.
Keywords
mtCR – gudgeon – fish – distance – geometric morphometry
Introduction
It has long been known that the vast major- ity of species can consist of phenotypically closely related entities (cryptic species) or form species complexes (Mayr, 1948;
Winterbottom et al., 2014; Victor, 2015). This intraspecific variability is considered as the cornerstone of evolution (Coyne et al., 1998;
Pfenninger et al., 2007); moreover, it also provides an important segment of global biodiversity. Therefore, the exploration and preservation of the infraspecific variability can also make a significant contribution to the long-term conservation of the global biota (Des Roches et al., 2018). However, the proper- ties of these closely related and therefore phe- notypically very similar entities are difficult to explore. Therefore, the traditional methodol- ogies using solely anatomical and phenotypic features are not appropriate on their own to reveal these still difficult to discover segments of biodiversity (Maderbacher et al., 2008).
As molecular genetic methods have become cheaper and easier executable in the last dec- ades, they have become fundamental tools of taxonomic researches. Thus, nowadays the use of dna-based methods are indispensable in the modern taxonomy (Miller, 2007). As a result of molecular studies, the knowledge of intraspecific-variability of several widespread European fish species has been expanded (Šedivá et al., 2008; Bryja et al., 2010; Marić et al., 2012; Palandačić et al., 2015). Moreover, as the results of these investigations the tax- onomy of certain wide ranged species have been changed essentially (Denys et al., 2014;
Palandačić et al., 2020). While molecular methods provide adequate information on the phylogenetic differences of these newly discovered groups or species, there is much less information available about how the revealed genetic differences get to fixation
in a population, if they manifest at all, in the phenotype in general. In some cases it is still questionable if there are any tangible pheno- typic features, which would reflect the phy- logenetic differences of the newly described entities (species or subspecies).
A good example of this phenomenon is the taxonomic changes of the ancient cyp- rinid genus Gobio. The eponymous species of the genus the G. gobio Linnaeus 1758 had long been known as a widely distributed superspecies in Eurasia, showing a remarka- ble phenotypic variability (Banarescu et al., 1999). The results of genetic analyses altered the taxonomy of this genus fundamentally (Mendel et al., 2008). Although most of its 19 European subspecies were elevated into species level, one can hardly find any count- able or measurable morphological features which can be used to differentiate these newly described species (Kottelat et al., 2007;
Takács, 2012). Thus, molecular methods can be characterised by higher accuracy and sta- bility compared to the morphological studies, at the same time the sole use of the molecular method has its own pitfalls also (Seberg et al., 2003; Sun et al., 2019). This indicates that the use of traditional, phenotypic based approach is still required for the taxonomic description of species. In field identification, or fisher- ies-induced selection has been done so far mostly by traditional methods (Turan, 2004;
Keat-Chuan Ng et al., 2017).
The geometric morphometric technique and its statistical background were developed in the last decades, and provide a promising methodology to reveal differences among species (Adams et al., 2004). Their sensitiv- ity also makes them appropriate to classify a certain sample into intraspecific groups (e.g., populations) or even to examine speciation processes (Clabaut et al., 2007; Kerschbaumer et al., 2011). Therefore, the combined use of
molecular techniques and these modern- ized morphometric methods with the use of the data of the entire body or only a certain body part (Wakefield et al., 2014; Ibáñez, 2015;
Zischke et al., 2016; Ibáñez et al., 2017) can help to indicate the phenotypic differences of the cryptic species and hybrids as well (Andrews et al., 2016; Denys et al., 2021; Lax et al., 2021;
Špelić et al., 2021). At the same time, the extent of morphological differences of closely related entities are unrevealed in many cases, and it is still questionable how considerable are these differences compared to the effects of environment, population origin, or sexual dimorphism. Moreover, there has been scarce information available about the usability of certain morphometric methods to show slight phenotypic differences of phylogenetically closely related groups.
In this work, our study objects are the Carpathian stocks of the above mentioned stream dwelling gudgeons (Cyprinidae, Gobio). This taxon appears to be particularly suitable for this kind of study because accord- ing to the results of the recently published finer-scale genetic studies three phylogenet- ically distinguishable groups can be found in the area (Mendel et al., 2008; Erős et al., 2014; Zangl et al., 2020; Takács et al., 2021).
The G. sp1 (sic!) mentioned as a ’species in waiting’ Mendel et al. (2008) from the Tisza drainage, situated to the Eastern area of the Carpathian basin. The G. obtusirostris, a valid species (hereafter: G.obt.), and the Southern haplogroup are distributed mainly at the nw and sw areas of the basin (Erős et al., 2014;
Zangl et al., 2020). In addition, an extended hybridisation zone of these latter mentioned clades is assumed to be exist at the borders of their distribution (Takács et al., 2021).
Notwithstanding, the genetic features of the Carpathian stream dwelling gudgeons have already been described (Mendel et al., 2008;
Erős et al., 2014; Zangl et al., 2020; Takács et al.,
2021), the morphometric differences of these clades have not yet been explored in detail.
Therefore, the aims of this study were 1) to specify the morphometric differences of phy- logenetically identified Carpathian stream dwelling gudgeon stocks, 2) to compare the effect of phylogeny, population origin, and sexual dimorphism on their morphometric features and 3) to reveal the reliability and separation power of three different morpho- metric methods in these phylogenetically closely related entities.
Materials and methods Sampling, data recordings
Sampling was conducted on five Hungarian stream sites by electrofishing (collection per- mit: pe-ktf/659-15/2017) in the spring of 2017.
Basic hydrophysico-chemical parameters of the sampled stream sections (temperature, pH, dissolved O2 concentration, conductiv- ity, and tds) were recorded at the time of fishing (Supplementary Table S1). Altogether 102 stream dwelling gudgeon (Gobio sp.) indi- viduals were collected (Fig. 1 and Table 1) and sacrificed, because most of them were used for other investigation purposes (Maasz et al., 2020) as well. Then they were placed flat on a polystyrol surface and their left sides were photographed from a perpendicular angle using a tripod-mounted Nikon D5300 digital camera with a fixed zoom range. Additionally, a single scale was removed from the area anterior to the dorsal fin, and scanned with a Hewlet Packard ScanJet 5300C xpa scanner at 2400 dpi. After that fin clips were sampled for genetic investigations and stored in 96%
ethanol at -20°C until dna extraction. Since no pronounced sexual dimorphism can be detected in case of the Gobio species (Nowak et al., 2010), all individuals were dissected in the lab for sex identification.
Phylogenetic investigations
Fin clips of the collected 102 gudgeon spec- imens were used for dna isolation with a DNeasy Blood and Tissue kit (Qiagen, Germany), using 10–20 mg of fin tissue per individual, according to the manufactur- er’s instructions. The quality and quantity of the extracted dna were checked by using a NanoDrop 2000c Spectrophotometer (Thermo Scientific, USA).
The sequences of the mitochondrial control region (mtCR) were amplified by polymerase chain reaction (pcr) using the primers cr159 (CCCAAAGCAAGTACTAACGTC) and cr851 (TGCGATGGCTAACTCATAC) (Mendel et al.,
2008). pcr was carried out using 0.2 ml of 5 U/ml Taq dna polymerase (Fermentas), 2.5 µl of 10X Taq buffer, 1.7 µl MgCl2 (25 mM), 0.2 µl dNTPs (10 mM), 0.3 µl of each primer (20 mM), 2.0 µl template dna (50 ng/µl), and 17.8 µl purified and distilled water in a final volume of 25 µl. Reactions were performed in a mj Research ptc-200 Peltier Thermal Cycler under the following cycling conditions: 95°C for 1 min, followed by 37 cycles of 94°C for 45 s, annealing at 52°C for 30 s, and an extension temperature of 72°C for 45 s, followed by a final extension at 72°C for 8 min. pcr products were purified using the NucleoSpin® Gel and pcr Clean-up (Macherey Nagel) extraction
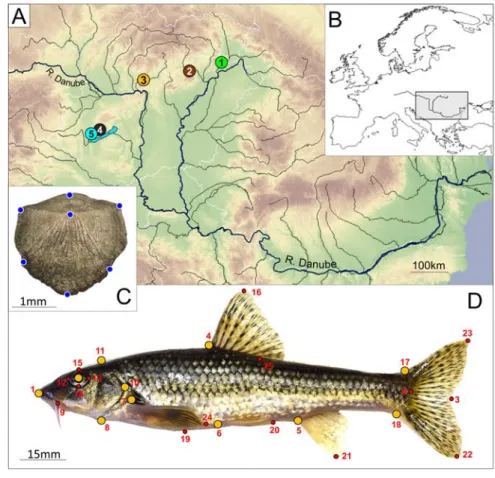
figure 1 Geographic distribution of the five sampling sites (A) and the position of the study area in Europe (B). Blue dots show the seven landmarks recorded on scales (C) Distribution of landmark points (orange) used for geometric morphometric analyses. The numbered points are the start and endpoints of measured distances on fish body (D) for more details see Table 1. and Supplementary Table S2.
Photographs were taken by the first author.
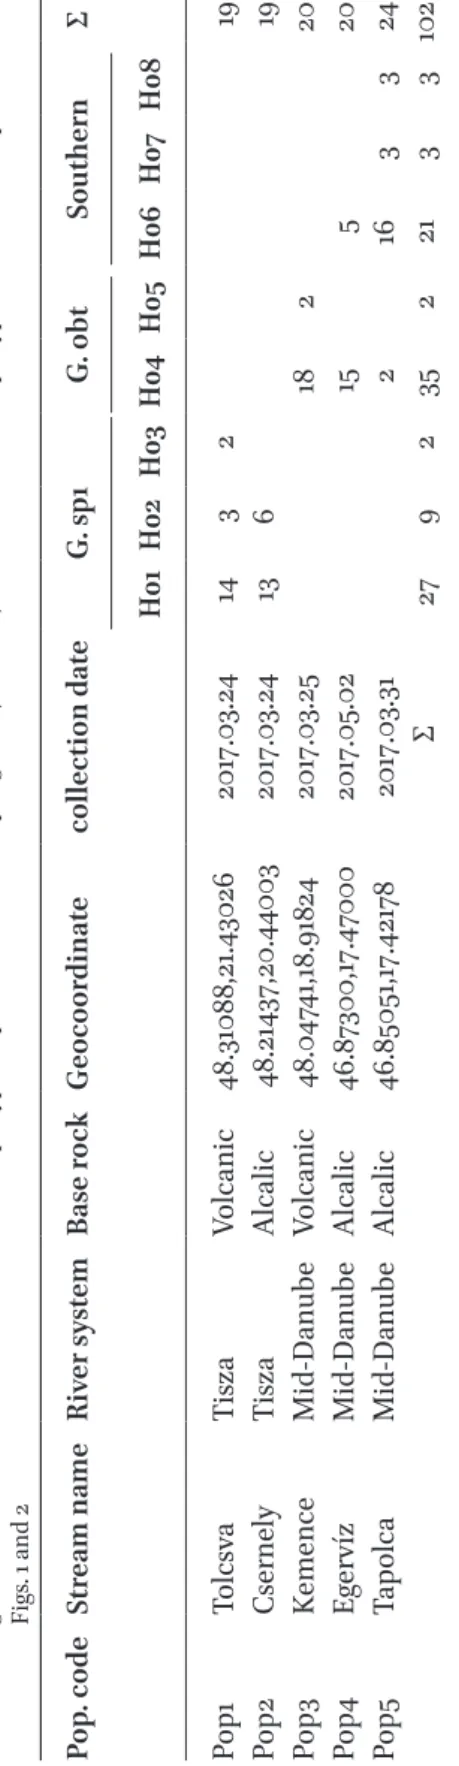
table 1Data of the sampled gudgeon populations. Population codes, names of the sampled streams, name of river system, baserock of the certain watersheds, geocoordinates of sites, collection date and haplotype frequencies in each sampling sites (H01-H08). Site numbers and haplotype codes are correspond with Figs. 1 and 2 Pop. codeStream nameRiver systemBase rockGeocoordinatecollection dateG. sp1G. obtSouthernΣ H01H02H03H04H05H06H07H08 Pop1TolcsvaTiszaVolcanic48.31088,21.430262017.03.24143219 Pop2CsernelyTiszaAlcalic48.21437,20.440032017.03.2413619 Pop3KemenceMid-DanubeVolcanic48.04741,18.918242017.03.2518220 Pop4EgervízMid-DanubeAlcalic46.87300,17.470002017.05.0215520 Pop5TapolcaMid-DanubeAlcalic46.85051,17.421782017.03.31 2 163324 Σ27923522133102
kit. The subsequent determination of the nucleotide sequence of the pcr amplicons were performed using nucleotide sequenc- ing by capillary electrophoresis (abi 3130 Genetic Analyzer Device, abi). This method applied bidirectional sequencing with the BigDye Terminator v3.1 Cycle Sequencing Kit, Performance Optimal Polimer 7 and 50 cm capillary array according to the recommenda- tion of the producer.
Sequences were trimmed manually using FinchTV 1.4.0 (Geospiza) and aligned using MUSCLE (Edgar, 2004) as implemented in mega X software (Kumar et al., 2018).
Calculation of sequence polymorphism and haplotype detachment was performed using FaBox online software (Villesen, 2007). The obtained sequences were compared with the ones uploaded to the GenBank using Blast online software (Morgulis et al., 2008). The evolutionary tree was inferred in mega X (Kumar et al., 2018) applying Neighbor-Join and BioNJ algorithms. Matrix of pairwise distances estimated using the Maximum Composite Likelihood (mcl) approach based on the Tamura-Nei model (Tamura et al., 1993).
All positions containing gaps and missing data were eliminated. The Maximum Likelihood tree was built using a Romanogobio vladyk- ovi (Fang, 1943) haplotype (Gen Bank acc.
Number: mk975878) as an outgroup sequence, with 1000 bootstrap replicates. Sequence divergence was calculated with maximum composite likelihood method also in mega X (Kumar et al., 2018). Pairwise sequence diver- gences were arranged into a semi-matrix, and presented on a PCoA plot using Past 2.17c software (Hammer et al., 2001). The median joining network was constructed in Network 10.2.0.0. software (Bandelt et al., 1999).
Morphometric data analyses
Two morphometrical approaches were applied, including traditional distance based
morphometrics (tm) with a traditional mul- tivariate technique, and a landmark-based geometric morphometric (gm) approach. The morphometric data were obtained from the digital images of the bodies and the scales.
Seven and eleven landmark points (Fig. 1C- D) were recorded for geometric morphomet- ric surveys on scale and body photos using tpsUtil and tpsDig2 digital imaging software (Rohlf, 2005, 2010). In order to standardize the datasets, full Procrustes fit was undertaken on the body (gmb) and scale (gms) landmark coordinates, followed by multivariate regres- sion analysis on the logarithm of Centroid Size (logCS) in MorphoJ (ver. 1.09d) software (Klingenberg, 2011). The statistical analyses were performed on the residuals of the regres- sion analyses to remove variances caused by allometric growth.
In the case of the distance based method (dbm), we recorded 35 inter landmark dis- tances between 25 landmark points (Fig.
1D, Supplementary Table S2) by using the ImageJ software (Rasband, 2012). To eliminate inter-observer variability (Takács et al., 2016), all measurements were conducted by the same person. Measurement data were stand- ardized by the standard length (sl) using the formula of Elliott et al. (1995):
Madj =M L L
(
s / o)
bwhere Madj is the value of the standardized variable, M is the value of the originally meas- ured variable, Ls is the average of the standard body lengths of the subjects, L0 is the stand- ard body length of the subject, parameter ’b’
is the slope of the regression of a given loga- rithm (base e) transformed variable on the logarithmized standard body length (sl). The standardised data (i.e., Madj) were rechecked by correlating against the original sl values.
No significant correlations (Spearman’s D, p < 0.05) were evident between either of the
standardized variable values and the sl. As the number of measured variables highly exceeded the number of individuals per population, we performed a variable selec- tion. We retained the first 22 variables whose the F-ratio was the highest (Supplementary Table S2).
In case of all the three methodologies employed the standardized datasets were statistically analysed by Canonical Variate Analyses (cva) in past (ver. 2.17c) (Hammer et al., 2001) and a three way permutational anova (PERMANOVA) (Anderson, 2001).
In this analysis, the Euclidean distances of the morphometric residuals were analysed against three following explanatory factors.
The phylogenetic group with three levels, the population origin with five levels, and the sex with two levels, and without any interactions acted as explanatory factors. Omitting the interactions was justified by the highly unbal- anced design of the data. The significance of the factors in explaining the morphological variability were tested by marginal tests with 999 random permutation of the data. The marginal test provides information on the pure explanatory power of a factor or term when all other factors or terms are already in the model. PERMANOVA analysis were carried out in R (R Core Team, 2015) by using the ‘adonis2’ function of the vegan package (Oksanen et al., 2013). Geographic distances and morphometric differences of the studied populations were compared using pairwise Mantel tests (Mantel, 1967) in Past 2.17c soft- ware (Hammer et al., 2001).
Results
Phylogenetic investigations
Out of total 608 nucleotide positions in the final dataset, 17 were informative. On the basis
of the results of the phylogenetic analyses, the sequences of the 102 individuals were classi- fied into eight haplotypes (H01-H08), which were deposited in the GenBank with the fol- lowing accession numbers: om222046-53. The revealed haplotypes were classified into three haplogroups. Out of the 102 surveyed indi- viduals, 37 showed G. obt. haplotypes. These specimens originated from three populations (Pop3, Pop4, Pop5). The 38 individuals’ sam- ples belonging to the Pop1 and Pop2 classified as G. sp1 haplotypes. Three haplotypes – 27 individuals’ sequences originated from the Pop4 and Pop5 – were sorted to the ”southern cryptic group” (Table 1, Fig. 2) occupying tran- sitional position between G. obt. and G. sp1.
However, this group were much more similar to the previous one since the mean net nucle- otide distance between G. obt. and southern haplotypes was 0.011%±0.003, (6.547 ± 1.664 bases). On the other hand, the net nucleo- tide distance between the southern group and G. sp1 was 0.019% ± 0.001 (11.539 ± 0.729 bases). The phylogenetic tree with the high- est log likelihood (-951.65) is shown in Fig.
2A. Pairwise sequence divergences were pre- sented on a PCoA plot (Fig. 2B). In this plot, and similarly in the median joining network, the similar haplotypes were classified arbi- trarily into haplogroups (see ’enframings’ in Fig. 2B, C).
Morphometric studies
Results of the morphometric analyses obtained from the three factors (i.e., phyloge- netic, population and sex) using different methodologies (gmb, gms, dbm) are pre- sented on cva plots (Fig. 3). The Bonferroni corrected Hotelling’s p-values, and the squared Mahalanobis distances of each pairwise com- parison in case all the three applied methods are shown in Supplementary Table S3. On the phylogenetic level, the results of gmb and
dbm morphometric analyses showed that the individuals classified into G. sp1 group differed significantly from the G.obt. and the Southern haplotypes, while these two latter groups were not separated from each other.
The gms analysis separated the G. obt. and G.
sp1 groups. Using gmb, and dbm seven and six out of the ten pairwise population level com- parisons were significant, while in the case of gms only one significant pairwise difference was found. From the three morphometric methods only the gmb showed significant differences between the two sexes. Pairwise squared Mahalanobis distances showed that gms provided generally smaller group differ- ences than the other two methods tested. The number and percentages of correctly classi- fied cases (Supplementary Table S4) are in correspondence with this finding. The highest percentage of correctly classified cases were found in the case of gmb for all the three
classification factors (84%, 88%, and 84%). It is followed by the dbm (77%, 75%, and 77%) while the lowest values were found in case of gms (60%, 63%, and 65%) for phylogenetic, population and sex levels, respectively.
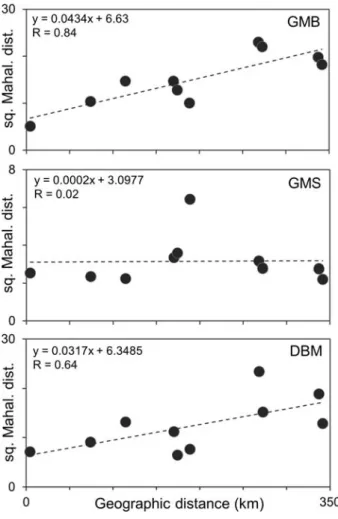
According to the three-way PERMANOVA analysis, population origin proved to be a highly significant factor in the explanation of the morphological variability in all three mor- phometric analyses (i.e., gmb, gms, dbm). Sex explained significant variability only in the gms method. Whereas phylogenetic group- ing was clearly insignificant in describing the morphological heterogeneity of the gudgeons in each morphometric method (Table 2). The comparisons of population level morphomet- ric and straight line geographic differences showed significant correlation solely in the case of gmb, the dbm’s data show marginal significance, while the gms datasets did not show significant correlation (Fig. 4, Table 3).
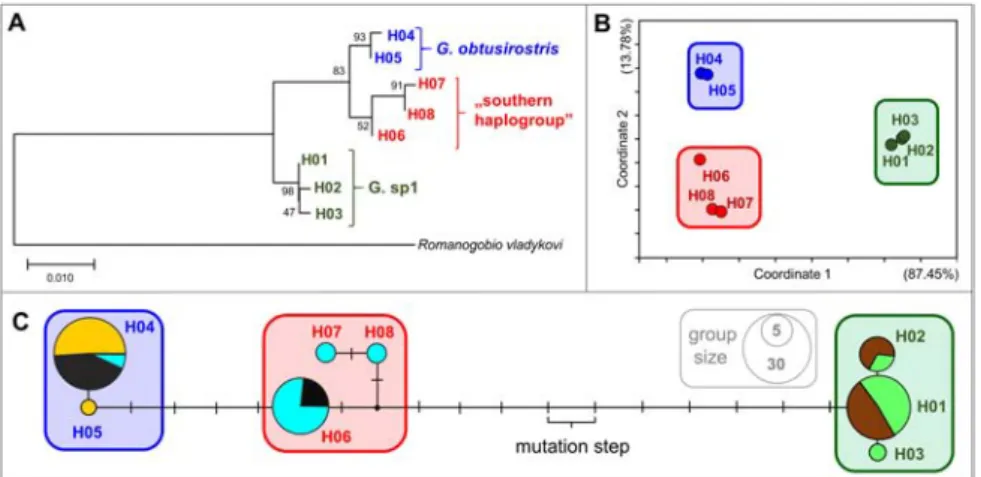
figure 2 Results of phylogenetic analyses using mtCR sequence data of 102 Carpathian gudgeon individuals.
Maximum likelihood tree showing the divergence of the eight haplotypes derived from the 608 bp long sequence data. Outgroup: Romanogobio vladykovi (Fang, 1943) GenBank acc. number: mk975878.
Bootstrap support values are shown next to the branches (A). PCoA plot derived from the pairwise nucleotide differences of haplotypes. The attributed variance in each axis is indicated in parentheses (B). Median-Joining network of mtCR sequence data (C). Circle sizes are relative to the number of individuals carrying the same haplotype. Line length refers to the genetic distances of haplotypes.
Colour codes of cryptic groups on subfigures A, B and C are identical and correspond with Fig 1 and 3 (Blue: G. obtusirostris, red: southern haplogroup, Green: G. sp1). Different colours on subfigure „C”
represents different populations. Light Green: Pop1, Brown: Pop2, Orange: Pop3, Black: Pop4, Light Blue: Pop5). For more details, see Fig. 1 and Table 1.
Discussion
Our results, in correspondence with the available literature data (Takács et al., 2014;
Zangl et al., 2020; Takács et al., 2021) showed remarkable phylogenetic variation of the Middle Danubian stream dwelling gudg- eons. The 102 individuals collected from the five sample sites can be classified into eight haplotypes, which are grouped into three haplogroups (Fig. 2). Note, that only one of these higher groups has been considered as a valid species (Kottelat et al., 2007; Mendel
et al., 2008). The morphometric studies partly reinforced the indicated phylogenetic differ- entiations. Namely, the gms did not showed any congruence with the results of phyloge- netic works, whilst the gmb and dbm verified the phylogenetic subdivisions of individuals.
Therefore, our results are in correspondence with other notes showing that even low level of phylogenetic differences can manifest in morphological (and functional) features (e.g., Adams et al., 2007; Levin et al., 2019). At the same time, we have to note that the results of three-way PERMANOVA showed (Table 2)
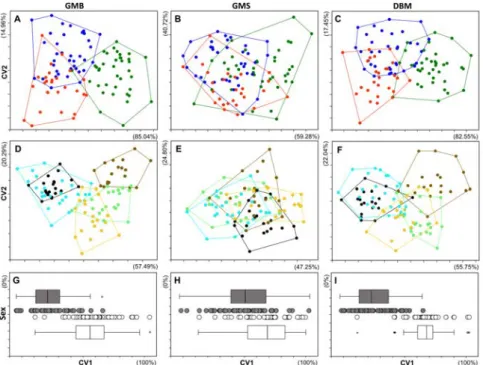
figure 3 cva plots showing the morphometric differentiation of the studied 102 inidviduals using the three different morphometric methods (gmb: Geometric Morphometry of Body, gms: Geometric Morphometry of Scales, dbm: Distance Based Method). The certain groups were established by the phylogenetic features (A, B, C), population origin (D, E, F) and sex (H, I, J) of the studied individuals.
Colours on the subfigures A, B, C: Blue: G. obtusirostris, Red: Southern haplogroup, Green: G. sp1. On subfigures D, E, F: Light Green: Pop1, Brown: Pop2, Orange: Pop3, Black: Pop4, Light Blue: Pop5. On subfigures H, I, J: Grey: male, white: female. For the better visibility individulal data points of the males and females in the H-I-J plots are slightly separated from each other. Moreover, the distibutions of data are shown on boxplots as well. Where each box represents the 25% and 75% quartiles of the dataset, the band in the box is the median. Whiskers show the largest data point <1.5 times higher and lower than the values included in the box (“upper and lower inner fences”) Values outside the inner fences are shown as circles, values >3 times the box height from the box (the “outer fences”) are shown as stars.
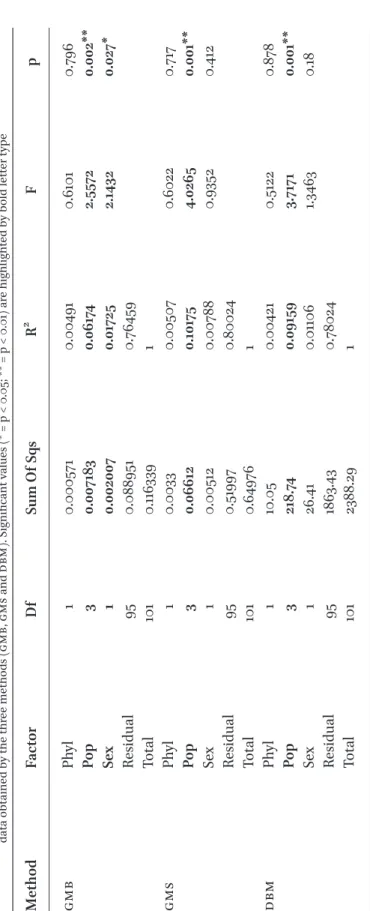
table 2Results of three-way PERMANOVA analyses for the effect of Phylogenetic (Phyl), population (Pop) and sexual (Sex) level detachments on the morphometric data obtained by the three methods (gmb, gms and dbm). Significant values (* = p < 0.05; ** = p < 0.01) are highlighted by bold letter type MethodFactorDfSum Of SqsR2 Fp gmbPhyl10.0005710.004910.61010.796 Pop30.0071830.061742.55720.002** Sex10.0020070.017252.14320.027* Residual950.0889510.76459 Total1010.1163391 gmsPhyl10.00330.005070.60220.717 Pop30.066120.101754.02650.001** Sex10.005120.007880.93520.412 Residual950.519970.80024 Total1010.649761 dbmPhyl110.050.004210.51220.878 Pop3218.740.091593.71710.001** Sex126.410.011061.34630.18 Residual951863.430.78024 Total1012388.291
that phylogenetic subdivision may have less importance in the formulation of morpho- metric differences than sexual dimorphism, although this later feature is not so pro- nounced in this species group (Nowak et al., 2010). Therefore, in our case the population origin is the dominant factor of phenotypic discrepancies. This finding can be explained by the fact that the morphometric attributes of a population level morphology besides the certain intrinsic (phylo-, and population genetic) factors are influenced by extrinsic, environmental effects, such as food avail- ability, habitat type, water current, etc., (Charmantier et al., 2005; Klingenberg, 2010;
figure 4 Relations of pairwise morphometric differences and geographic distances of the studied five populations (results of pairwise Mantel-tests, using 9999 permutations) in case of the three morphometric methods used (gmb: Geometric Morphometry of Body, gms: Geometric Morphometry of Scales, dbm: Distance Based Method). The equations and correlation values refer to the linear trend line.
table 3 Results of pairwise Mantel-tests. using 9999 permutations.gmb: Geometric Method on Body. gms: Geometric Method on Scales. dbm: Distance Based Method.
ssx: sum of suares of the x variable (geographic distances) ssy: sum of suares of y variable (squared Mahalanobis distances of gropuc centroids) Rxy:
Correlation coefficient. p: significance value. Significant (p < 0.05) values are highlighted by bold letter type
Method ssx ssy Rxy p
gmb 111634.477 295.298 0.843 0.046*
gms 111634.477 13.990 0.021 0.463 dbm 111634.477 269.047 0.645 0.055
Landaeta et al., 2019). In our case the envi- ronmental features may have fundamental contribution to the indicated morphometric differences. This assumption is supported by the fact that the Pop1 and Pop3 were highly similar to each other by the results of gmb and dbm (Fig. 3). Notwithstanding the remote phylogenetic and geographic posi- tion of these populations, the catchment basin of both streams can be characterised by volcanic base rock (Dövényi, 2012). This character may affect the environmental cir- cumstances directly and indirectly as well, as it is presented in the relatively low conductiv- ity and tds values (Supplementary Table S1) of these streams.
The finding that the phylogenetic features had a lower effect on the morphometric con- ditions may be additionally explained by the presence of hybrids in certain populations.
Both the H04 and H06 haplotypes appeared in Pop4 and Pop5, corresponding with our previous finding that assumes hybrid zones of G. obt. and southern haplogroups in the middle Transdanubian area of the Carpathian basin (Takács et al., 2021). Therefore, since we used only mitochondrial locus to reveal the phylogenetic features, the presence of hybrids cannot be ruled out in the studied popula- tions. At the same time, the phylogenetic researches have still mostly been done by mitochondrial markers (e.g., Denys et al., 2014, 2021; Marić et al., 2017; Ősz et al., 2018; White et al., 2018; Da et al., 2020, etc.). In our study, we were interested in whether the different levels of phylogenetic differences manifest in morphological differences. More detailed genetic investigations are needed to reveal the importance of hybridisation in the morpho- metric features, but this topic is beyond the scope of the present study.
Results of gmb and dbm methodologies showed strong relations between morpho- metric and geographical distances of the
populations, whereas we did not find any significant correlation between those two types of distances in the result of the gms method (Fig. 4, Table 3). Thus, in contrast to the gmb and dbm methods, the gms method appears to be less powerful for studying pop- ulation segregation of gudgeons. These find- ings are in correspondence with the note of Ibañez et al. (2007) who mentioned that scale morphometry is hardly appropriate to isolate geographicaly closely situated pop- ulations. Moreover, our results suggest that gms is a less appropriate method to reveal the sexual dimorphism or phylogenetic sub- divisions (Fig. 4, Supplementary Table S3).
Moreover this finding correspond well with previous notes (Staszny et al., 2012; Takács et al., 2016) that the usability of gms is highly affected by the studied taxon’s scale shape.
Additionally, our results contrary to other studies (Maderbacher et al., 2008) show that if appropriately selected variables are used, the traditional dbm can be a usable method to indicate such a low level of morphometric differentiation as well.
In our study we dealt with the effect of phylogenetic differences on the morphom- etry of a cryptic fish species complex. The results showed that the gmb and dbm meth- ods derived morphometric differentiation of the studied groups correspond well with their phylogenetic distances. And these methods were appropriate to separate the G. sp1 group reliably from the other two gudgeon groups.
Therefore, the stream dwelling gudgeon group is not only geographically and phylogenet- ically, but morphologically separated, from the other Gobio taxa living in the inner area of the Carpathian Basin. In order to clarify the taxonomic position of this „species in wait- ing” (Mendel et al., 2008), additional investi- gations will be required.
Our results are in correspondence with other findings (e.g., Bostock et al., 2006; Victor,
2015; Thacker, 2017; Li et al., 2019) suggesting phylogenetic separation can remain hidden for a long time. Because it is hardly mani- fest in phenotype, or certain environmen- tal impacts can obscure and overwrite these slight morphologic differences. Therefore, especially in the case of widely distributed species, particular attention should be paid to the conservation of their remote and/or separated stocks. Because by the extinction of these populations unique gene stocks or even entire cryptic species can be disappeared.
Acknowledgement
We would like to thank Ivana Buj and two anonymous reviewers for their helpful com- ments and discussion.
Authors’ contributions
The study was designed by pt. pt, gm, zz, zv, and bn collected the samples and bb made the sample processing. bk and diks con- ducted the phylogenetic works. The statisti- cal analyses were made by pt ás, and ps. pt wrote the first draft of the article with critical feedback from all co-authors. The authors read and edited the later forms of the manu- script, and approved the final manuscript.
Funding
Péter Takács was supported by the otka fk140902 grant and the Bolyai Fellowship of the Hungarian Academy of Sciences. Balázs Kovács has received funding from the efop- 3.6.3-vekop-16-2017-00008 grant, cofinanced by the European Union and the European Social Fund, and the Higher Education Institutional Excellence Program fekut2019:
tudfo/47138/2019-itm awarded by the Ministry of Human Capacities (Hungary).
Gabor Maasz was supported by the Bolyai Fellowship of the Hungarian Academy of Sciences. Ádám Staszny and Gábor Maasz was supported by the Ministry of Innovation and Technology within the framework of the Thematic Excellence Programme 2020, National Challenges Subprogramme (tkp2020-nka-16) and the tkp2020-ika-07 project, respectively. Ádám Staszny was sup- ported by the otka pd138612 grant. The research presented in this article was carried out with the support of the nkfih–872–
3/2020 project. The funders provided only the monetary and material background of our study, they had no rule in study design, data collection, analysis, publication and in writing the manuscript.
Supplementary material
Supplementary material is available online at:
https://doi.org/10.6084/m9.figshare.18706031
References
Adams, C.E., Fraser, D., Wilson, A.J., Alexander, G., Ferguson, M.M. & Skulason, S. (2007) Patterns of phenotypic and genetic variability show hidden diversity in Scottish Arctic charr. Ecol.
Freshw. Fish., 16, 78–86.
Adams, D.C., Rohlf, F.J. & Slice, D.E. (2004) Geometric morphometrics: Ten years of progress following the ‘revolution’. Ital. J. Zool., 71, 5–16.
Anderson, M.J. (2001) A new method for non- parametric multivariate analysis of variance.
Austral Ecol., 26, 32–46.
Andrews, K.R., Williams, A.J., Fernandez-Silva, I., Newman, S.J., Copus, J.M., Wakefield, C.B., Randall, J.E. & Bowen, B.W. (2016) Phylogeny
of deepwater snappers (Genus Etelis) reveals a cryptic species pair in the Indo-Pacific and Pleistocene invasion of the Atlantic. Mol.
Phylogenet. Evol., 100, 361–371.
Banarescu, P.M., Soric, V.M. & Economidis, P.S.
(1999) Gobio gobio (Linnaeus, 1758). Freshw.
fishes Eur., 5, 24–26.
Bandelt, H.J., Forster, P. & Röhl, A. (1999) Median- joining networks for inferring intraspecific phylogenies. Mol. Biol. Evol., 16, 37–48.
Bostock, B. M., Adams, M., Laurenson, L. J. B., &
Austin, C. M. (2006). The molecular systematics of Leiopotherapon unicolor (Günther, 1859):
testing for cryptic speciation in Australia’s most widespread freshwater fish. Biol. J. Linn, 87(4), 537–552.
Bryja, J., Smith, C., Konečný, A. & Reichard, M.
(2010) Range-wide population genetic structure of the European bitterling (Rhodeus amarus) based on microsatellite and mitochondrial dna analysis. Mol. Ecol., 19, 4708–4722.
Charmantier, A. & Garant, D. (2005) Environmental quality and evolutionary potential: Lessons from wild populations. Proc. R. Soc. B Biol. Sci., 272, 1415–1425.
Clabaut, C., Bunje, P.M.E., Salzburger, W. & Meyer, A. (2007) Geometric morphometric analyses provide evidence for the adaptive character of the Tanganyikan cichlid fish radiations.
Evolution (N. Y)., 61, 560–578.
Coyne, J.A. & Allen Orr, H. (1998) The evolutionary genetics of speciation. Philos. Trans. R. Soc. B Biol. Sci., 353, 287–305.
Da, F. & Wen, Z.Y. (2020) Complete mitochondrial genome of broadbanded cardinalfish (Ostorhinchus fasciatus) and phylogenetic analysis. Mitochondrial DNA Part B Resour., 5, 398–399.
Denys, G.P.J., Dettai, A., Persat, H., Hautecoeur, M.
& Keith, P. (2014) Morphological and molecular evidence of three species of pikes Esox spp.
(Actinopterygii, Esocidae) in France, including the description of a new species. Comptes Rendus - Biol., 337, 521–534.
Denys, G.P.J., Perea, S., Dettai, A., Gauliard, C., Persat, H. & Doadrio, I. (2021) Revalidation of the Spanish stone loach Barbatula hispanica (Lelek, 1987) (Teleostei, Nemacheilidae) according to morphological and mitochondrial data. Ann. Limnol., 57.
Des Roches, S., Post, D.M., Turley, N.E., Bailey, J.K., Hendry, A.P., Kinnison, M.T., Schweitzer, J.A. & Palkovacs, E.P. (2018) The ecological importance of intraspecific variation. Nat. Ecol.
Evol., 2, 57–64.
Dövényi, Z. (2012) A Kárpát-medence földrajza.[Geography of the Carpathian Basin].
Akadémiai Kiadó. Budapest.
Edgar, R.C. (2004) MUSCLE: Multiple sequence alignment with high accuracy and high throughput. Nucleic Acids Res., 32, 1792–1797.
Elliott, N.G., Haskard, K. & Koslow, J.A. (1995) Morphometric analysis of orange roughy (Hoplostethus atlanticus) off the continental slope of southern Australia. J. Fish Biol., 46, 202–220.
Erős, T., Sály, P., Takács, P., Higgins, C.L., Bíró, P.
& Schmera, D. (2014) Quantifying temporal variability in the metacommunity structure of stream fishes: The influence of non- native species and environmental drivers.
Hydrobiologia., 722, 31–43.
Hammer, Ø., Harper, D.A.T., Ryan, P.D. (2001) PAST:
paleontological statistics software package education and data analysis. Palaeontologia Electronica 4(1),9.
Ibañez, A.L., Cowx, I.G. & O’Higgins, P. (2007) Geometric morphometric analysis of fish scales for identifying genera, species, and local populations within the Mugilidae. Can. J. Fish.
Aquat. Sci., 64, 1091–1100.
Ibáñez, A.L. (2015) Fish traceability: Guessing the origin of fish from a seafood market using fish scale shape. Fish. Res., 170, 82–88.
Ibáñez, A.L., Hernández-Fraga, K. & Alvarez- Hernández, S. (2017) Discrimination analysis of phenotypic stocks comparing fish otolith and scale shapes. Fish. Res., 185, 6–13.
Keat-Chuan Ng, C., Aun-Chuan Ooi, P., Wong, W.
& Khoo, G. (2017) A Review of Fish Taxonomy Conventions and Species Identification Techniques. J. Surv. Fish. Sci., 4, 54–93.
Kerschbaumer, M. & Sturmbauer, C. (2011) The Utility of Geometric Morphometrics to Elucidate Pathways of Cichlid Fish Evolution.
Int. J. Evol. Biol., 2011, 1–8.
Klingenberg, C.P. (2010) Evolution and development of shape: Integrating quantitative approaches. Nat. Rev. Genet., 11, 623–635.
Klingenberg, C.P. (2011) MorphoJ: An integrated software package for geometric morphometrics.
Mol. Ecol. Resour., 11, 353–357.
Kottelat, M. & Freyhof, J. (2007) Handbook of European freshwater fishes.
Kumar, S., Stecher, G., Li, M., Knyaz, C. & Tamura, K. (2018) mega X: Molecular evolutionary genetics analysis across computing platforms.
Mol. Biol. Evol., 35, 1547–1549.
Landaeta, M.F., Bernal-Durán, V., Castillo, M.I., Díaz- Astudillo, M., Fernández-General, B. & Núñez- Acuña, P. (2019) Nearshore environmental conditions influence larval growth and shape changes for a temperate rocky reef fish.
Hydrobiologia., 839, 159–176.
Lax, P., Gonzalez Ittig, R., Rondan Dueñas, J.C., Andrade, A.J., Gardenal, C.N., Franco, J. & Doucet, M.E. (2021) Decrypting species in the Nacobbus aberrans (Nematoda: Pratylenchidae) complex using integrative taxonomy. Zool. Scr., 1–22.
Levin, B.A., Casal-López, M., Simonov, E., Dgebuadze, Y.Y., Mugue, N.S., Tiunov, A.V. &
Doadrio, I., Golubtsov, A.S. (2019) Adaptive radiation of barbs of the genus Labeobarbus (Cyprinidae) in an East African river. Freshw.
Biol., 64, 1721–1736.
Li, Y., Zhou, Y., Li, P., Gao, T., & Lin, L. (2019) Species identification and cryptic diversity in Pampus species as inferred from morphological and molecular characteristics. Mar. Biodivers, 49(6), 2521–2534.
Maasz, G., Zrínyi, Z., Fodor, I., Boross, N., Vitál, Z., Sipos, D.I.K., Kovács, B., Melegh, S. & Takács, P.
(2020) Testing the applicability of maldi-tof ms as an alternative stock identification method in a cryptic species complex. Molecules., 25.
Maderbacher, M., Bauer, C., Herler, J., Postl, L., Makasa, L. & Sturmbauer, C. (2008) Assessment of traditional versus geometric morphometrics for discriminating populations of the Tropheus moorii species complex (Teleostei: Cichlidae), a Lake Tanganyika model for allopatric speciation. J. Zool. Syst. Evol. Res., 46, 153–161.
Mantel, N. (1967) The detection of disease clustering and a generalized regression approach. Cancer Res., 27, 209–220.
Marić, S., Kalamujić, B., Snoj, A., Razpet, A., Lukić- Bilela, L., Pojskić, N. & Bajec, S.S. (2012) Genetic variation of European grayling (Thymallus thymallus) populations in the Western Balkans.
Hydrobiologia., 691, 225–237.
Marić, S., Stanković, D., Wanzenböck, J., Šanda, R., Erős, T., Takács, P., Specziár, A., Sekulić, N., Bănăduc, D., Ćaleta, M., Trombitsky, I., Galambos, L., Sipos, S. & Snoj, A. (2017) Phylogeography and population genetics of the European mudminnow (Umbra krameri) with a time-calibrated phylogeny for the family Umbridae. Hydrobiologia., 792, 151–168.
Mayr, E. (1948) The bearing of the new systematics on genetical problems the nature of species. In Advances in genetics Academic Press., Vol. 2.
Mendel, J., Lusk, S., Vasil’eva, E.D., Vasil’ev, V.P., Lusková, V., Ekmekci, F.G., Erk’akan, F., Ruchin, A., Koščo, J., Vetešník, L., Halačka, K., Šanda, R., Pashkov, A.N. & Reshetnikov, S.I. (2008) Molecular phylogeny of the genus Gobio Cuvier, 1816 (Teleostei: Cyprinidae) and its contribution to taxonomy. Mol. Phylogenet.
Evol., 47, 1061–1075.
Miller, S.E. (2007) dna barcoding and the renaissance of taxonomy. Proc. Natl. Acad. Sci.
U. S. A., 104, 4775–4776.
Morgulis, A., Coulouris, G., Raytselis, Y., Madden, T.L., Agarwala, R. & Schäffer, A.A. (2008) Database indexing for production MegaBLAST searches. Bioinformatics., 24, 1757–1764.
Nowak, M., Klaczak, A., Szczerbik, P. & Popek, W. (2010) Notes on the sexual diorphism of common gudgeon Gobio gobio (L.). Komunkaty Rybackie., 119, 2–5.
Oksanen, J., Kindt, R., Legendre, P., O’Hara, B., Simpson, G.L., Solymos, P., Henry, M., Stevens, H.
& Wagner, H. (2013) The vegan package.
Community Ecol. Packag., 2, 1–295.
Ősz, Á., Horváth, Á., Hoitsy, G., Sipos, D.K., Keszte, S., Sáfrány, A.J., Marić, S., Palkó, C., Tóth, B., Urbányi, B. & Kovács, B. (2018) The genetic status of the Hungarian brown trout populations: Exploration of a blind spot on the European map of Salmo trutta studies. PeerJ., 2018.
Palandačić, A., Bravničar, J., Zupančič, P., Šanda, R. & Snoj, A. (2015) Molecular data suggest a multispecies complex of Phoxinus (Cyprinidae) in the Western Balkan Peninsula. Mol.
Phylogenet. Evol., 92, 118–123.
Palandačić, A., Kruckenhauser, L., Ahnelt, H.
& Mikschi, E. (2020) European minnows through time: museum collections aid genetic assessment of species introductions in freshwater fishes (Cyprinidae: Phoxinus species complex). Heredity (Edinb)., 124, 410–422.
Pfenninger, M. & Schwenk, K. (2007) Cryptic animal species are homogeneously distributed among taxa and biogeographical regions. BMC Evol. Biol., 7, 1–6.
R Core Team (2015) R: a language and environment for statistical computing. R Foundation for Statistical Computing, Vienna, Austria. ISBN 3-900051-07-0. http://www.R-project.org.
Rasband, W. S. (2012) ImageJ: Image processing and analysis in Java. ascl, ascl-1206.
Rohlf, F. J. (2005) tpsDig, digitize landmarks and outlines, version 2.05. Department of Ecology and Evolution, State University of New York at Stony Brook.
Rohlf, F. J. (2010) tps-UTIL, File Utility Program, version 1.46. Department of Ecology and Evolution, State University of New York at Stony Brook, NJ.
Seberg, O., Humphries, C.J., Knapp, S., Stevenson, D. W., Petersen, G., Scharff, N. & Andersen, N.M.
(2003) Shortcuts in systematics? A commentary on dna-based taxonomy. Trends Ecol. Evol., 18, 63–65.
Šedivá, A., Janko, K., ŠlechtovÁ, V., Kotlík, P., Simonović, P., Delic, A. & Vassilev, M. (2008) Around or across the Carpathians: Colonization model of the Danube basin inferred from genetic diversification of stone loach (Barbatula barbatula) populations. Mol. Ecol., 17, 1277–1292.
Špelić, I., Rezić, A., Kanjuh, T., Marić, A., Maguire, I., Simonović, P., Radočaj, T. &
Piria, M. (2021) Application of the geometric morphometrics approach in the discrimination of morphological traits between brown trout lineages in the Danube Basin of Croatia. Knowl.
Manag. Aquat. Ecosyst., 2020-Janua.
Staszny, Á., Ferincz, Á., Weiperth, A., Havas, E., Urbányi, B. & Paulovits, G. (2012) Scate- morphornetry study to discriminate Gibel Carp(Carassius gibelio) populations in the Balaton-Catchment(Hungary). Acta Zool. Acad.
Sci. Hungaricae., 58, 19–27.
Sun, C., Xuan, Z., Liu, H., Jiang, T. & Yang, J. (2019) Cyt b gene and D-loop sequence analyses of Coilia nasus from the Rokkaku River of Japan.
Reg. Stud. Mar. Sci., 32, 100840.
Takács, P. (2012) Morphometric differentiation of gudgeon species inhabiting the Carpathian Basin. Ann. Limnol., 48, 53–61.
Takács, P., Bihari, P., Eros, T., Specziár, A., Szivák, I., Bíró, P. & Csoma, E. (2014) Genetic heterogeneity reveals on-going speciation and cryptic taxonomic diversity of stream- dwelling gudgeons (Teleostei, Cyprinidae) in the Middle Danubian hydrosystem (Hungary).
PLoS One., 9.
Takács, P., Vitál, Z., Ferincz, Á. & Staszny, Á. (2016) Repeatability, reproducibility, separative power and subjectivity of different fish morphometric analysis methods. PLoS One., 11, 1–16.
Takács, P., Ferincz, Á., Imecs, I., Kovács, B., Nagy, A.A., Ihász, K., Vitál, Z. & Csoma, E. (2021)
Increased spatial resolution of sampling in the Carpathian basin helps to understand the phylogeny of central European stream-dwelling gudgeons. BMC Zool., 6, 1–11.
Tamura, K. & Nei, M. (1993) Estimation of the number of nucleotide substitutions in the control region of mitochondrial dna in humans and chimpanzees. Mol. Biol. Evol., 10, 512–526.
Thacker, C. E. (2017) Patterns of divergence in fish species separated by the Isthmus of Panama.
BMC Evol. Biol., 17(1), 1–14.
Turan, C. (2004) Stock identification of Mediterranean horse mackerel (Trachurus mediterraneus) using morphometric and meristic characters. ICES J. Mar. Sci., 61, 774–781.
Victor, B.C. (2015) How many coral reef fish species are there? Cryptic diversity and the new molecular taxonomy. Ecology of Fishes on Coral Reefs. Cambridge University Press, Cambridge, United Kingdom, 76–87.
Villesen, P. (2007) FaBox: An online toolbox for fasta sequences. Mol. Ecol. Notes., 7, 965–968.
Wakefield, C.B., Williams, A.J., Newman, S.J., Bunel, M., Dowling, C.E., Armstrong, C.A. & Langlois, T.J. (2014) Rapid and reliable multivariate
discrimination for two cryptic Eteline snappers using otolith morphometry. Fish. Res., 151, 100–106.
White, W.T., Corrigan, S., Yang, L., Henderson, A.C., Bazinet, A.L., Swofford, D.L. & Naylor, G.J.P.
(2018) Phylogeny of the manta and devilrays (Chondrichthyes: Mobulidae), with an updated taxonomic arrangement for the family. Zool. J.
Linn. Soc., 182, 50–75.
Winterbottom, R., Hanner, R.H., Burridge, M. &
Zur, M. (2014) A cornucopia of cryptic species - A dna barcode analysis of the gobiid fish genus Trimma (Percomorpha, Gobiiformes). Zookeys., 381, 79–111.
Zangl, L., Daill, D., Gessl, W., Friedrich, T. &
Koblmüller, S. (2020) Austrian gudgeons of the genus Gobio (Teleostei: Gobionidae): A mixture of divergent lineages. J. Zool. Syst. Evol. Res., 58, 327–340.
Zischke, M.T., Litherland, L., Tilyard, B.R., Stratford, N.J., Jones, E.L. & Wang, Y.G. (2016) Otolith morphology of four mackerel species (Scomberomorus spp.) in Australia: Species differentiation and prediction for fisheries monitoring and assessment. Fish. Res., 176, 39–47.