Full Terms & Conditions of access and use can be found at
https://www.tandfonline.com/action/journalInformation?journalCode=rpst20
Population Studies
A Journal of Demography
ISSN: (Print) (Online) Journal homepage: https://www.tandfonline.com/loi/rpst20
Life expectancy inequalities in Hungary over 25 years: The role of avoidable deaths
Anikó Bíró , Tamás Hajdu , Gábor Kertesi & Dániel Prinz
To cite this article: Anikó Bíró , Tamás Hajdu , Gábor Kertesi & Dániel Prinz (2021): Life expectancy inequalities in Hungary over 25 years: The role of avoidable deaths, Population Studies, DOI: 10.1080/00324728.2021.1877332
To link to this article: https://doi.org/10.1080/00324728.2021.1877332
© 2021 The Author(s). Published by Informa UK Limited, trading as Taylor & Francis Group
View supplementary material
Published online: 02 Feb 2021.
Submit your article to this journal
View related articles
View Crossmark data
Life expectancy inequalities in Hungary over 25 years:
The role of avoidable deaths
Anikó Bíró
1, Tamás Hajdu
1, Gábor Kertesi
1and Dániel Prinz
21Centre for Economic and Regional Studies,2Harvard University
Using mortality registers and administrative data on income and population, we develop new evidence on the magnitude of life expectancy inequality in Hungary and the scope for health policy in mitigating this. We document considerable inequalities in life expectancy at age 45 across settlement-level income groups, and show that these inequalities have increased between 1991–96 and 2011–16 for both men and women. We show that avoidable deaths play a large role in life expectancy inequality. Income-related inequalities in health behaviours, access to care, and healthcare use are all closely linked to the inequality in life expectancy.
Supplementary material for this article is available at:https://doi.org/10.1080/00324728.2021.1877332
Keywords: life expectancy; income inequality; administrative data; avoidable death; health behaviours;
healthcare access; healthcare use; Hungary
[Submitted April 2020; Final version accepted September 2020]
Introduction
Lower-income individuals experience higher mor- tality and lower life expectancy, even in developed countries with universal or near-universal access to high-quality healthcare. Is there scope for health policy interventions to mitigate these inequalities?
In this paper, we use detailed mortality register data, census data, and administrative data from Hungary to shed light on this question. We begin by constructing life expectancy measures at age 45 by sex and age for each settlement in Hungary using a national mortality register and population data spanning the period 1991–2016. By settlement we mean a village or town, or a district of the capital city. Using data on the causes of mortality, we are able to estimate life expectancy separately based on avoidable deaths and unavoidable deaths, as well as for all-cause mortality. To track changes in life expectancy and inequality, we estimate life expectancy measures for three different periods, 1991–96, 2001–06, and 2011–16. We provide evidence on inequalities in a rich set of health-related indi- cators linked to life expectancy, covering health behaviours, access to healthcare, and healthcare spending.
Our work contributes to the literature on inequal- ities in health and in life expectancy. The inter- national literature has found that socio-economic status is positively correlated with health and life expectancy. This association is statistically strong and substantively large, and has been documented across a variety of developed countries and time periods. Among many others, see Chetty et al.
(2016) for the United States (US), Case and Deaton (2020) also for the US but with a historical perspective, Currie et al. (2020) for France, Kinge et al. (2019) for Norway, Stanistreet et al. (1999) for the United Kingdom, Tarkiainen et al. (2013) for Finland, Marmot (2005) for a worldwide com- parison, and Mackenbach et al. (2008, 2018, 2019) for European comparisons.
In this paper, we focus on Hungary: an interesting case because the country went through major econ- omic and social changes during the last 30 years, but access to healthcare remained universal. The finding that despite major economic restructuring and changes in the ways the country’s welfare state operates, inequalities in life expectancy have per- sisted and even widened is not an obvious one. It highlights that structural transformations that lead to overall improvements in average well-being may https://doi.org/10.1080/00324728.2021.1877332
© 2021 The Author(s). Published by Informa UK Limited, trading as Taylor & Francis Group. This is an Open Access article distributed under the terms of the Creative Commons Attribution-NonCommercial-NoDerivatives License (http://creativecommons.org/licenses/by- nc-nd/4.0/), which permits non-commercial re-use, distribution, and reproduction in any medium, provided the original work is properly cited, and is not altered, transformed, or built upon in any way.
be accompanied by widening inequalities in impor- tant outcomes.
The related literature in Hungary has focused largely on educational level as a proxy for socio- economic status, mortality as a measure of health, and broader geographic regions, and has found similar patterns as seen in other developed countries (Klinger2001,2003; Kovács and Bálint2014; Bálint and Németh 2018; Kovács and Bálint 2018). For a systematic review of the literature on the socio-econ- omic determinants of mortality in Hungary, see Scheiring, Irdam, et al. (2018). Unemployment, regional labour market shocks, regional differences in privatization, and foreign investment have all been associated with mortality inequality (Juhász et al. 2010; Uzzoli 2011; Nagy et al. 2012, 2014;
Azarova et al.2017; Scheiring, Stefler, et al. 2018).
It is also important to note that inequality in life expectancy by educational level in Hungary is among the highest in the European Union member states (Mackenbach et al.2008,2018). However, in the Central and Eastern European region, the inequality in mortality is not unique to Hungary.
For a review of the Eastern European context, see Scheiring et al. (2019), who found based on a review of the literature that inequality and unem- ployment were among the leading factors contribut- ing to the post-socialist mortality crisis. Case and Deaton (2020, p. 108) compared the‘long-standing misery’of the Eastern European countries with the deaths of despair due to suicide, alcohol, and drug abuse among less educated, white Americans.
Our contributions to the established literature are empirical. First, we document patterns over a 25- year period and show that while life expectancy at age 45 increased overall, socio-economic inequalities also increased (particularly among women), despite large shifts in Hungary’s economy and society.
Second, owing to our detailed data, we are able to estimate life expectancy at the settlement level and to group settlements according to average income.
This is important because income is a good compo- site indicator of social differences; in addition, it is comparable across space and time. Third, using detailed mortality registers, we separately study the contributions of avoidable and non-avoidable deaths to inequality and show that at least half of the inequality is due to avoidable causes of death.
Fourth, we study the relationships between inequal- ity in life expectancy and 27 measures of health behaviours, access to healthcare, and healthcare use. These health-related indicators mediate the relationship between income and life expectancy.
While it is not possible to identify the causal
relationships between each of the 27 indicators and life expectancy, we show in a unified framework how much these wide-ranging health-related indi- cators vary with income. By doing so, we highlight the scope for health policy in reducing life expect- ancy inequality. Health policy could mitigate the inequalities in life expectancy by encouraging improvements in health behaviours (e.g. via edu- cation and information campaigns), ensuring better access to care (e.g. filling vacant general practitioner (GP) posts; providing better transport to healthcare units), and ensuring timely use of diagnostic and curative healthcare services among the poor.
An important and unresolved question in the lit- erature is what can explain the persistent inequalities in health and life expectancy in countries with uni- versal access to healthcare (Mackenbach et al.
2008; Bambra 2011). While health inequalities are generally high in Eastern Europe, there are also per- sistent and substantial inequalities in mortality in the Nordic countries and other European countries with advanced welfare states (Mackenbach 2017). Our empirical findings suggest that inequalities in health behaviours, access to care, and healthcare use all contribute to these puzzling patterns, which cannot be explained by a single underlying mechan- ism. Our results are in line with the predictions and findings of Phelan et al. (2004) that for more preven- table causes of death, socio-economic status is more strongly associated with mortality than for less pre- ventable ones. The increasing inequality in life expectancy suggests that poorer individuals lag further and further behind when both the economy and healthcare technology improve. According to Wise (2003), differential risk and access are the two central mechanisms of disparity creation; and when interventions are of high efficacy then differences in access dominate the differences in outcomes.
Deaton (2002) argued that new techniques and knowledge can generate a gradient, even when none previously existed. He pointed out the possi- bility that widening gradients may be ‘related to life-saving bursts of technical progress’ (p. 18).
Phelan and Link (2005) provided evidence that social disparities emerge when new health-enhan- cing information or technology is developed. They documented how social gradients have increased in those diseases that have become more preventable or treatable. Glied and Lleras-Muney (2008) demon- strated that improvements in health technologies tend to increase disparities in health across edu- cational groups because education enhances the ability to exploit technological advances. Our empirical findings on disparities in healthcare
access and use are in line with the observations of Deaton (2002), Wise (2003), Phelan and Link (2005), and Glied and Lleras-Muney (2008).
The remainder of this paper proceeds as follows.
The ‘Methods’ section describes the data used in this study and summarizes our analysis. We then present our results, and finally, discuss our findings and limitations, before concluding the paper.
Methods
Data and sample
Mortality, income, and population data. We use unique mortality register data from the Hungarian Central Statistical Office (HCSO); these cover all deaths in Hungary between 1991 and 2016, pro- viding information on the age, sex, and settlement of residence of the deceased, as well as cause of death. Based on the cause of death, we can separ- ate non-avoidable and avoidable (preventable and amenable) mortality. A death can be considered as amenable if it could have been avoided through optimal quality healthcare. The concept of preventable deaths is broader and includes deaths that could have been avoided by public health interventions focusing on wider determi- nants of public health (European Statistical Office 2019).
Age- and sex-specific population data at the settle- ment level also come from the HCSO. We use these data to calculate life expectancy and settlement-level per capita income. We define income as the settle- ment-level average annual taxable domestic income per capita, and use this measure as a proxy for the household-level per capita income. To calculate the per capita measure, we divide the total settlement- level current annual taxable income (measured in the HCSO’s‘T-STAR’ municipal statistical system) by the settlement-level population. We measure all income in 2016 terms.
Health-related indicators. We use a rich set of additional health-related data to understand which indicators of health behaviours, healthcare access, and healthcare use are associated with life expect- ancy inequalities. Our focus on health-related indi- cators is motivated by the goal of understanding whether health and social policy interventions could mitigate income inequalities in life expectancy.
The list of general practices with and without vacant GP posts comes from the National Health Insurance Fund Administration (NHIFA) of
Hungary. Using 2016 data, we calculate the share of general practices with vacant GP posts for each settlement.
We use measures of annual social security health spending on inpatient care, outpatient care, and pre- scription drugs, and a measure of out-of-pocket spending on prescription drugs, from an administra- tive data set that covers 2003–11 based on a 50 per cent random sample of the 2003 population of indi- viduals aged 5–74. We use health spending measures for 2011, and restrict the sample to individuals aged 25 or older. For more details on the availability of healthcare spending information linked to adminis- trative data, see Bíró and Prinz (2020).
To describe access to care, we use the HCSO’s T-STAR municipal statistical system. For each settle- ment, we know if there was a pharmacy and an out- patient specialist care unit in 2014. Based on this information, and using the road distance measures included in the ‘GEO’ database of the Centre for Economic and Regional Studies, for each settlement we calculate the distance (in kilometres) to the nearest pharmacy and nearest outpatient specialist care unit. We set the distance to zero for settlements with a facility.
We measure ambulance response time in minutes, for all settlements in 2009, using the road distance measure from Kemkers et al. (2010).
The share of households using solid fuel for heating comes from the 2011 Census of Hungary.
The census dwelling questionnaire asks respondents about the energy used for heating. In this analysis, solid fuel heating is defined as heating with wood or coal.
To understand health-related behaviours, we use measures of the average daily amount of time spent watching TV and participating in sports from the 2009–10 Hungarian Time Use Survey (HTUS) administered by the HCSO. The HTUS covers a one-year period and follows an open diary design.
The sampling units are households, but only one person per household completes a diary for the pre- vious day (starting at 4 a.m. and covering 24 hours) in the course of a face-to-face interview, providing detailed information on their time allocation. For these measures, we use data from individuals aged 25 or older.
We also obtain a rich set of health-related indi- cators from the Hungarian edition of the European Health Interview Survey (EHIS) for 2014. We use binary indicators of preventive care use during the previous year: specifically, indicators for whether an individual had a cholesterol test, a glucose test, and/or a mammography. We also use binary
indicators of unmet need for drugs and medical care due to: (1) financial difficulties; (2) having to wait too long for treatment; and (3) distance to a treat- ment unit. Finally, we also use the following indi- cators of consumption of healthy and unhealthy goods: daily or almost daily consumption of fruit, vegetables, sugary drinks, pre-packed sweets, salty snacks, and wholemeal food at least weekly con- sumption of fish; daily smoking; and alcohol con- sumption categorized as high or medium risk. For these indicators, the sample is restricted to individ- uals aged 25 or older.
Table A1 in the supplementary material provides an overview of all variables used and their source;
Table B2 provides descriptive statistics. Tables of all variables by settlement-level income groups are available at the authors’website (Bíró et al.2020).
Analytic approach
For each time period (1991–96, 2001–06, and 2011– 16), we group Hungarian settlements based on their per capita taxable income, dividing the income distribution of settlements into ventiles (20 equally sized bins). Each group represents approxi- mately 5 per cent of the Hungarian population, that is, around 500 thousand individuals out of the total population of around 10 million. As the largest towns and the districts in the capital city each contain about 100–250 thousand inhabitants, using ventiles implies that a group is about two or three times the size of the population of a large town. We analyse six-year periods to reduce the noise in the data. The first period thus starts right after the end of communism in Hungary; the last period ends at the end of our observation period (2016 is the latest year for which income and mor- tality data were available).
Figure B1 in the supplementary material shows that although the top income ventiles are concen- trated mainly in Budapest (the capital city) and north-west Hungary, there is spatial variation in settlement-level income in all regions of the country.
We calculate life expectancy at age 45. We choose age 45 because our focus is on the life expectancy of adults. Life expectancy at age 45 is also used as a key health indicator by the World Health Organization (2018). For each time period (1991–96, 2001–06, and 2011–16) and income group, we construct sex- age–specific mortality rates. Specifically, mortality rates are calculated as the number of deaths in a period-sex-age-income cell divided by the popu- lation count in that period-sex-age-income cell. For
each period, we use the average yearly number of deaths and population size. We then follow a stan- dard procedure to calculate sex-specific life expect- ancy for each income group (for more details, see Appendix A1).
To examine the role of avoidable deaths in life expectancy differences across income groups, we cal- culate an adjusted version of life expectancy. In this exercise, we assume that the avoidable mortality rate of each income ventile is equal to the avoidable mortality rate observed in the richest income ventile, whereas the non-avoidable mortality rate is unchanged (for more details, see Appendix A2).
We also calculate life expectancy adjusted for pre- ventable mortality and for amenable mortality in a similar way. As the definitions of avoidable, preven- table, and amenable deaths change over time, adjusted life expectancy is only calculated for the period 2011–16. Our definitions of avoidable, pre- ventable, and amenable mortality are based on the definition used by the Office for National Statistics (2011).
We group the health-related indicators listed earlier into three categories: health behaviours, access to care, and healthcare use. For each indicator within a category, we calculate the mean value for each income ventile. In the main text, we report a normalized measure for each indicator (the mean- standardized difference): the difference between the mean of the richest (top) and poorest (bottom) settlement ventiles, divided by the overall mean of the indicator. In addition, we calculate the corre- lation coefficient between income ventile and the ventile-specific mean of each health-related indi- cator. Thus, we obtain comparable inequality indi- cators for the 27 indicators we use in our analysis.
Results
Relationship between income and life expectancy
We start by focusing on our results for the overall relationship between income and life expectancy in the period 2011–16.Figure 1suggests that there are large inequalities in life expectancy at age 45 across settlement-level income ventiles (i.e. approximately 5 per cent bins of the Hungarian population ordered by settlement-level income). These inequal- ities are larger among males than among females.
Among females, the difference in life expectancy at age 45 between the top and bottom ventiles is 4.6 years (37.4 years vs 32.8 years). In relative terms,
this is a 14 per cent difference. Among males, this difference is even larger, both in absolute terms (6.9 years; 32.7 years vs 25.8 years) and relative terms (27 per cent). Interestingly, whereas there are large differences between the top three ventiles and the bottom three ventiles, life expectancy averages do not differ too much in the middle part of the income distribution. For example, the differ- ence between the 5th and 15th ventiles is only 0.8 years (2 per cent) among females and 1.8 years (7 per cent) among males.
Evolution of inequality over time
Figure 1 also presents life expectancy at age 45 for the periods 1991–96 and 2001–06. While average life expectancy at age 45 increased by around 3–4.5 years between 1991–96 and 2011–16, life expectancy also increased in all settlement-level income ventiles.
Among females, the difference in life expectancy at age 45 between the top and bottom ventiles increased substantially: it was 2.4 years (8 per cent) in 1991–96 and 4.6 years (14 per cent) in 2011–16, an approximate doubling in both absolute and rela- tive terms. Among males, the difference was 5.8 years (26 per cent) in 1991–96 and 6.9 (27 per cent) in 2011–16. Importantly, among both females and males, the life expectancy of the bottom ventile in 2011–16 was lower than the life expectancy of the top ventile 20 years earlier. Figure 1 also shows
that both the level of life expectancy and the magni- tude of income inequalities in life expectancy in 2001–06 were between the levels and inequalities seen in 1991–96 and 2011–16. Thus, the increase in inequalities happened gradually over the observed 25 years.
Role of avoidable vs unavoidable deaths
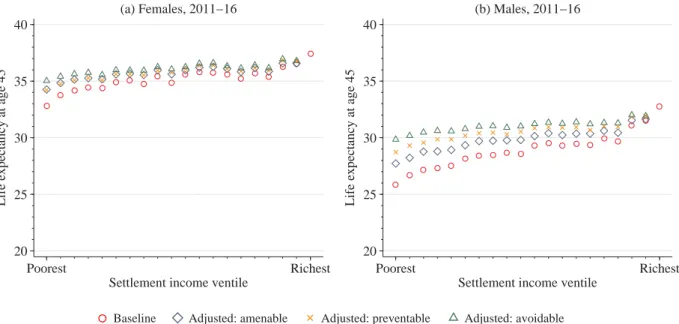
What fraction of the observed inequality in mortality is due to avoidable causes of death?Figure 2shows estimates of adjusted life expectancies at age 45, which are calculated based on the assumption that mortality due to avoidable causes of death (and, sep- arately, preventable or amenable causes of death) is the same in each settlement-level income ventile as in the richest ventile. Thus, the remaining inequal- ities will show mortality inequalities due to unavoid- able causes of death.
Among females, the baseline (unadjusted) differ- ence in life expectancy between the top and bottom ventiles in 2011–16 is 4.6 years (14 per cent). This difference reduces to 2.4 years (7 per cent) if income inequalities in avoidable causes of death are eliminated. The roles of preventable and amenable causes of death in mortality inequalities are similar to each other.
Among males, avoidable causes of death contrib- ute even more to the income inequalities in mor- tality. The baseline (unadjusted) difference in life
20 25 30 35 40
Life expectancy at age 45
Poorest Richest
Settlement income ventile (a) Females
20 25 30 35 40
Life expectancy at age 45
Poorest Richest
Settlement income ventile (b) Males
1991−96 2001−06 2011−16
Figure 1 Life expectancy at age 45 in Hungary by settlement income ventile for (a) females and (b) males, 1991–96, 2001–06, and 2011–16
Notes: For more details on how settlement income ventiles are defined and life expectancies are calculated, see the‘Analytic approach’subsection and theAppendix.
Source: Authors’calculations based on data from the Hungarian Central Statistical Office.
expectancy between the top and bottom ventiles is 6.9 years (27 per cent). This reduces to 2.9 years (10 per cent) if income inequalities in avoidable causes of death are eliminated. Thus, among males, more than half of the income inequality in mortality can be attributed to avoidable causes of death. As Figure 2 shows, the role of preventable causes of death is somewhat larger among males than the role of amenable causes. This may be due mainly to deaths related to excess consumption of alcohol and to smoking, but note that accidents and suicide are also considered to be preventable rather than amenable causes of death.
Health-related indicators
To analyse which factors might contribute to income inequalities in life expectancy, we look at income inequalities in health-related indicators.
We select indicators of health behaviours, access to care, and healthcare use known to be linked to life expectancy. For example, Prentice and Pizer (2007) have shown the impact of timely access to healthcare on mortality, and Aakvik and Holmås
(2006) investigated the link between primary care access and mortality. There is also evidence on the impact of preventative healthcare use on mortality (see e.g. Moss et al. (2006) for the effect of mammo- graphy), and some evidence for the causal effects of health behaviours on mortality (see e.g. Cesur et al.
(2017) for the effect of air pollution due to heating and Stallings-Smith et al. (2013) for the effect of smoking).
The following analysis uncovers associations rather than causal relationships. Our aim is not to establish a causal relationship between a selected health-related indicator and life expectancy, but to show in a unified framework how much wide- ranging health-related indicators can vary with income. As Figure B2 in the supplementary material illustrates, many of the health-related indicators we analyse are strongly correlated, making it difficult to separate the causal impact of each indicator on life expectancy.
Our results provide evidence suggesting that certain economic, social, and health policies may reduce inequalities in life expectancy by decreas- ing inequalities in the health-related indicators that are strongly associated with life expectancy.
20 25 30 35 40
Life expectancy at age 45
Poorest Richest
Settlement income ventile (a) Females, 2011−16
20 25 30 35 40
Life expectancy at age 45
Poorest Richest
Settlement income ventile (b) Males, 2011−16
Baseline Adjusted: amenable Adjusted: preventable Adjusted: avoidable
Figure 2 Adjusted life expectancy at age 45 in Hungary by settlement income ventile for (a) females and (b) males, 2011–16
Notes: Figures show life expectancy at age 45 based on overall mortality (shown by circles; same as inFigure 1) and counter- factual (adjusted) life expectancy estimates if preventable, amenable, or avoidable mortality were eliminated. In each panel, diamonds show counterfactual life expectancy at age 45 if income inequality in amenable mortality were eliminated, squares show counterfactual life expectancy at age 45 if income inequality in preventable mortality were eliminated, and triangles show counterfactual life expectancy at age 45 if income inequality in avoidable mortality were eliminated. For more details on how settlement income ventiles are defined and life expectancies are calculated and adjusted by type of mortality, see the
‘Analytic approach’subsection and theAppendix.
Source:As forFigure 1.
These health-related indicators act as mediating variables in the linkage between income and life expectancy.
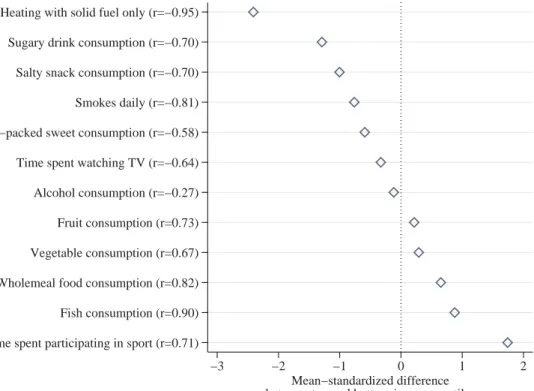
Health behaviours. Figure 3 shows, for various indicators of health behaviours, the difference between the top and bottom income ventiles, stan- dardized by the overall mean, in addition to their correlation coefficient with income ventile.
(Figure B3 in the supplementary material shows the distribution of each of the indicators across all income ventiles.) The two health behaviours showing the most difference between the top and bottom ventiles are heating with solid fuel only (where the difference between the top and bottom ventiles is 2.5 times the overall mean) and time spent participating in sport (where the difference between the top and bottom ventiles is 1.8 times the overall mean). All other health behaviours show the expected signs: health behaviours that are known to be harmful for health are more
prevalent among people living in poorer settle- ments. Specifically, the mean-standardized differ- ence between the poorest and richest settlements in the consumption of sweets and sugary drinks, salty snacks, and daily smoking is around 0.5–1.5.
We see moderate income differences in time spent watching TV and the consumption of alcohol, veg- etables, and fruit, partly due to the high overall means (for consumption of vegetables, fruit, and time spent watching TV), and partly due to a weaker relationship with income (for consumption of alcohol). Indeed, the consumption of vegetables and fruit both show strong positive correlations with income ventile (correlation coefficients of +0.67 and +0.73), whereas the correlation between the alcohol consumption indicator and income ventile is a moderate−0.27. The mean-standardized differences in the consumption of food generally considered healthy (wholemeal food and fish) and time spent participating in sports activities are between 0.5 and 1.8, with higher prevalence in the richer settlements.
Time spent participating in sport (r=0.71) Fish consumption (r=0.90) Wholemeal food consumption (r=0.82) Vegetable consumption (r=0.67) Fruit consumption (r=0.73) Alcohol consumption (r=−0.27) Time spent watching TV (r=−0.64) Pre−packed sweet consumption (r=−0.58) Smokes daily (r=−0.81) Salty snack consumption (r=−0.70) Sugary drink consumption (r=−0.70) Heating with solid fuel only (r=−0.95)
−3 −2 −1 0 1 2
Mean−standardized difference between top and bottom income ventiles
Figure 3 Income inequalities in health behaviours in Hungary
Notes: Standardized measures of income inequality for measures of health behaviour are calculated by taking the difference between the top and bottom income ventiles and dividing by the mean. The correlation coefficient between income ventile and the ventile-specific mean of each indicator is shown in parentheses. For the full distribution of each of the indicators, see Figure B2 in the supplementary material. For more details on how these standardized measures are defined, see the‘Ana- lytic approach’subsection.
Source:Hungarian Time Use Survey 2009; European Health Interview Survey 2014; Census of Hungary 2011. For more details on the definition and sources of the indicators, see the‘Health-related indicators’subsection and Table A1 in the supplementary material.
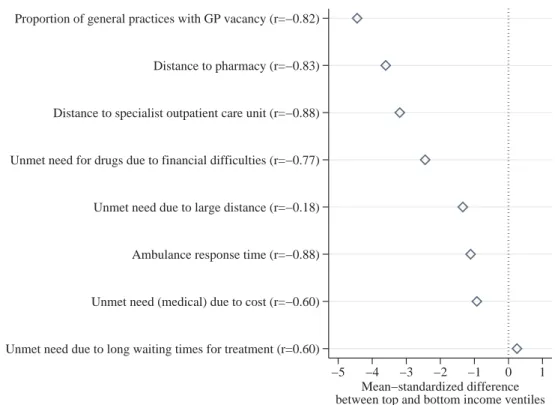
Access to care. Figure 4 shows, for various indi- cators of healthcare access, the mean-standardized difference between the top and bottom income ven- tiles, and their correlation coefficient with income ventile. (Figure B4 in the supplementary material shows the distribution of each of the indicators across all income ventiles.) There are large inequal- ities in access to care across income groups. In poorer settlements, general practices with vacant GP posts are more widespread (mean-standardized difference −4.4), distances to pharmacies and specialist outpatient care units are larger (mean- standardized differences −3.6 and −3.2), and waiting times for ambulances are longer (mean-stan- dardized difference −1.1). Among the four indi- cators of unmet need, the income gradient is the strongest for unmet need for drugs due to financial difficulties: the mean-standardized difference in the prevalence of unmet need between the poorest and richest settlements is around 2.5. Unmet need due to distance to treatment facilities and unmet need
due to cost of medical care are also more widespread in poorer areas, although the correlation coefficient of −0.18 indicates a weak relationship between income ventile and unmet need due to distance.
We do not see clear evidence of an income gradient in unmet need due to long waiting times for treat- ment—while the correlation coefficient with income ventile is 0.60, the mean-standardized differ- ence between the poorest and richest settlements is close to zero. Overall, these results reveal that in remote settlements, limited access to medical care (such as greater distance to a pharmacy and to specialist outpatient care) is coupled with low average incomes.
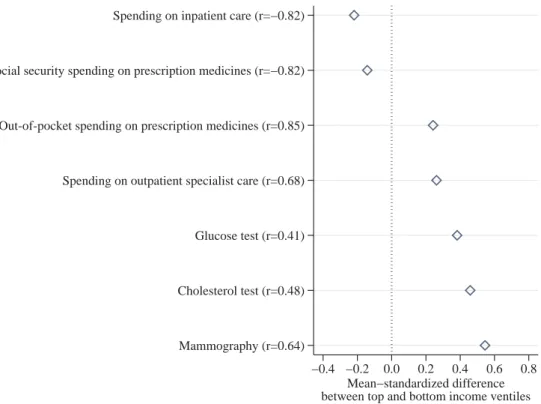
Healthcare use. Figure 5 shows the same two measures for various indicators of healthcare use.
(Figure B5 in the supplementary material shows the distribution of each of the indicators across all income ventiles.) The use of preventive care is
Unmet need due to long waiting times for treatment (r=0.60) Unmet need (medical) due to cost (r=−0.60) Ambulance response time (r=−0.88) Unmet need due to large distance (r=−0.18) Unmet need for drugs due to financial difficulties (r=−0.77) Distance to specialist outpatient care unit (r=−0.88) Distance to pharmacy (r=−0.83) Proportion of general practices with GP vacancy (r=−0.82)
−5 −4 −3 −2 −1 0 1
Mean−standardized difference between top and bottom income ventiles
Figure 4 Income inequalities in access to care in Hungary
Notes: Standardized measures of income inequality for measures of access to care are calculated by taking the difference between the top and bottom income ventiles and dividing by the mean. The correlation coefficient between income ventile and the ventile-specific mean of each indicator is shown in parentheses. For the full distribution of each of the indi- cators, see Figure B3 in the supplementary material. For more details on how these standardized measures are defined, see the‘Analytic approach’subsection.
Source:National Health Insurance Fund Administration of Hungary 2016; Kemkers et al. (2010); Hungarian Central Stat- istical Office T-STAR Municipal Statistical System 2014, European Health Interview Survey 2014. For more details on the definition and sources of the indicators, see the‘Health-related indicators’subsection and Table A1 in the supplementary material.
more widespread in richer settlements: the mean- standardized difference between the top and bottom income ventile is around 0.4–0.6 for the three indicators of screening. We also see that out- of-pocket spending on prescription medicines and on outpatient specialist care is higher in the richer settlements, probably due to income effects and better access to care. However, social security spend- ing on prescription medicines and on inpatient care is slightly higher in the poorest settlements than in the richest, seen in their strong negative correlation coefficients with income ventile. This is likely to be because inpatient care use and social security spend- ing on drugs reflect the worse health status of indi- viduals living in poorer areas.
Conclusion
We have presented evidence on life expectancy inequality in Hungary. To our knowledge, this is the first paper documenting life expectancy inequalities by income and type of death over a
long time period in Hungary. We also contribute to an established international literature by examin- ing the experience of a country that has gone through tectonic shifts in its economy and society.
During the 25-year period between 1991 and 2016 that we examined, Hungary made the transition from planned socialist economy to market economy. The country experienced a 19 per cent increase in its Human Development Index, includ- ing a seven-year increase in life expectancy at birth, a four-year increase in expected years of schooling, and a $9,000 (55 per cent) increase in its per capita Gross National Income (United Nations Development Programme2019). It is strik- ing that despite this significant progress, inequality in life expectancy also increased. Our result that life expectancy inequalities increased more among females than males is in line with other findings in the literature (Fodor and Horn 2015; Scheiring, Stefler et al.2018).
Despite methodological differences, we can compare our results on life expectancy inequality with related results from other countries. We
Mammography (r=0.64) Cholesterol test (r=0.48) Glucose test (r=0.41) Spending on outpatient specialist care (r=0.68) Out-of-pocket spending on prescription medicines (r=0.85) Social security spending on prescription medicines (r=−0.82) Spending on inpatient care (r=−0.82)
−0.4 −0.2 0.0 0.2 0.4 0.6 0.8 Mean−standardized difference between top and bottom income ventiles
Figure 5 Income inequalities in healthcare use in Hungary
Notes: Standardized measures of income inequality for measures of healthcare use are calculated by taking the difference between the top and bottom income ventiles and dividing by the mean. The correlation coefficient between income ventile and the ventile-specific mean of each indicator is shown in parentheses. For the full distribution of each of the indicators, see Figure B4 in the supplementary material. For more details on how these standardized measures are defined, see the‘Ana- lytic approach’subsection.
Source:Centre for Economic and Regional Studies administrative data set 2011; European Health Interview Survey 2014.
For more details on the definition and sources of the indicators, see the‘Health-related indicators’subsection and Table A1 in the supplementary material.
estimated that the gap in life expectancy at age 45 between the top and bottom settlement-level income ventiles was 4.6 years for females and 6.9 years for males (in 2011–16). Using household-level income data from the US, Chetty et al. (2016) estimated that the gap in life expectancy at age 40 between the richest 1 per cent and poorest 1 per cent of individuals was 10.1 years for females and 14.6 years for males.
According to estimates by Kinge et al. (2019), inequal- ities in life expectancy in Norway are very similar to those in the US. Since our results are based on settle- ment-level income and we used ventiles instead of per- centiles, our estimated gaps being about half the size of the estimates from the US and Norway suggests that individual-level inequalities are likely to be of similar magnitudes.
Our paper is subject to some limitations. We studied inequalities in life expectancy by income at the settlement level and not at the individual (or household) level. Thus, our estimated inequalities underestimate individual-level (or household-level) inequalities. Second, when looking at the health- related indicators, we documented associations with income and thus with life expectancy, not causal effects. Finally, while Hungary’s economy and its healthcare system are similar to those of other countries in the region, we could not compare our findings with those from other Central and Eastern European countries due to the lack of comparable data.
The most important result of this paper is the major role of avoidable causes of death (both pre- ventable and amenable) in overall inequality in life expectancy. Life expectancy inequality between the top and bottom income groups could be cut in half by reducing avoidable mortality to the level seen in the richest settlements. The evidence on the role of avoidable deaths and the association of mortality inequality with health behaviours, access to care, and healthcare use suggests that there remains sub- stantial scope for policymakers to increase the life expectancy of individuals in poorer areas and to decrease existing inequalities. Specifically, incenti- vizing dietary improvements and cuts in smoking;
reducing solid fuel heating to improve air quality;
ensuring better access to healthcare; and helping poorer individuals attend standard healthcare screening could all result in reduced life expectancy inequalities.
Notes and acknowledgements
1 Anikó Bíró, Tamás Hajdu, and Gábor Kertesi are all based in the Health and Population Lendület Research
Group, Centre for Economic and Regional Studies, Institute of Economics, Hungary. Dániel Prinz is based at Harvard University. Please direct all correspondence to Anikó Bíró, Tóth Kálmán utca 4, 1097 Budapest, Hungary; or by Email: biro.aniko@krtk.hu
2 Anikó Bíró, Tamás Hajdu, and Gábor Kertesi were sup- ported by the Lendület programme of the Hungarian Academy of Sciences (grant number: LP2018-2/2018).
We thank Robert Kemkers, Gábor Pirisi, and András Trócsányi for sharing their data on ambulance response times. The mortality register, population and census data sets, and the Hungarian edition of the European Health Interview Survey used in this paper were accessed through a secure research facility of the Hun- garian Central Statistical Office and the Centre for Economic and Regional Studies. The administrative data used in this paper are under the ownership of the Central Administration of National Pension Insurance, the National Health Insurance Fund Administration, the Educational Authority, the National Tax and Customs Administration, the National Labour Office, and the Pension Payment Directorate of Hungary. The data were processed by the Institute of Economics, Centre for Economic and Regional Studies. The linkage of individual-level health spending measures to settlement information was performed in a secure research facility at the Centre for Economic and Regional Studies. Data on general practices with and without GP vacancies were provided by the National Health Insurance Fund Administration free of charge through the framework of secondary use of public data. The findings and conclusions expressed are solely those of the authors.
ORCID
Anikó Bíró http://orcid.org/0000-0002-4833-4224 Tamás Hajdu http://orcid.org/0000-0002-9533- 7727
Gábor Kertesi http://orcid.org/0000-0001-9127- 8099
Dániel Prinz http://orcid.org/0000-0002-9409-1964
References
Aakvik, Arild, and Tor Helge Holmås. 2006. Access to primary health care and health outcomes: The relation- ships between GP characteristics and mortality rates, Journal of Health Economics25(6): 1139–1153. doi:10.
1016/j.jhealeco.2006.04.001
Arias, Elizabeth, Jiaquan Xu, and Kenneth D. Kochanek.
2019. United States life tables, 2016, National Vital Statistics Reports68(4): 1–65.
Azarova, Aytalina, Darja Irdam, Alexi Gugushvili, Mihaly Fazekas, Gábor Scheiring, Pia Horvat, Denes Stefler, Irina Kolesnikova, Vladimir Popov, Ivan Szelenyi, David Stuckler, Michael Marmot, Michael Murphy, Martin McKee, Martin Bobak, and Lawrence King.
2017. The effect of rapid privatisation on mortality in mono-industrial towns in post-Soviet Russia: A retro- spective cohort study,The Lancet Public Health2(5):
e231–e238. doi:10.1016/S2468-2667(17)30072-5 Bálint, Lajos, and László Németh. 2018. The role of
alcohol-related mortality in life expectancy inequalities by educational level, Magyar Tudomány (Hungarian Science) 179(11): 1666–1679. doi:10.1556/2065.179.
2018.11.8.
Bambra, Clare.2011. Health inequalities and welfare state regimes: Theoretical insights on a public health
‘puzzle’, Journal of Epidemiology & Community Health65(9): 740–745. doi:10.1136/jech.2011.136333 Bíró, Anikó, and Dániel Prinz.2020. Healthcare spending
inequality: Evidence from Hungarian administrative data, Health Policy 124(3): 282–290. doi:10.1016/j.
healthpol.2020.01.006
Bíró, Anikó, Tamás Hajdu, Gábor Kertesi, and Dániel Prinz.2020. The role of place and income in life expect- ancy inequality: Evidence from Hungary. Available:
http://healthpop.krtk.mta.hu/inequality/the-role-of-place- and-income-in-life-expectancy-inequality-evidence-from- hungary/.
Case, Anne, and Angus Deaton. 2020.Deaths of Despair and the Future of Capitalism. Princeton: Princeton University Press.
Cesur, Resul, Erdal Tekin, and Aydogan Ulker.2017. Air pollution and infant mortality: Evidence from the expansion of natural gas infrastructure,The Economic Journal127(600): 330–362. doi:10.1111/ecoj.12285 Chetty, Raj, Michael Stepner, Sarah Abraham, Shelby Lin,
Benjamin Scuderi, Nicholas Turner, Augustin Bergeron, and David Cutler. 2016. The association between income and life expectancy in the United States, 2001-2014, JAMA 315(16): 1750–1766. doi:10.
1001/jama.2016.4226
Currie, Janet, Hannes Schwandt, and Josselin Thuilliez.
2020. Pauvreté, Egalité, Mortalité: Mortality (in) equal- ity in France and the United States, Journal of Population Economics 33(1): 197–231. doi:10.1007/
s00148-019-00736-7
Deaton, Angus.2002. Policy implications of the gradient of health and wealth,Health Affairs21(2): 13–30. doi:10.
1377/hlthaff.21.2.13
European Statistical Office.2019. Amenable and preven- table death statistics. Available: https://ec.europa.eu/
eurostat/statistics-explained/pdfscache/41683.pdf.
Fodor, Eva, and Daniel Horn.2015.“Economic develop- ment” and gender equality: Explaining variations in
the gender poverty gap after socialism, Social Problems62(2): 286–308. doi:10.1093/socpro/spv007 Glied, Sherry, and Adriana Lleras-Muney. 2008.
Technological innovation and inequality in health, Demography45(3): 741–761. doi:10.1353/dem.0.0017 Juhász, Attila, Csilla Nagy, Anna Páldy, and Linda Beale.
2010. Development of a deprivation index and its relation to premature mortality due to diseases of the circulatory system in Hungary, 1998–2004, Social Science & Medicine 70(9): 1342–1349. doi:10.1016/j.
socscimed.2010.01.024
Kemkers, Róbert, Gábor Pirisi, and András Trócsányi.
2010. A mentőállomás területi jellemzői Magyarországon [Regional characteristics of ambu- lance stations in Hungary], Területi Statisztika 50(4):
420–437.
Kinge, Jonas Minet, Jørgen Heibø Modalsli, Simon Øverland, Håkon Kristian Gjessing, Mette Christophersen Tollånes, Ann Kristin Knudsen, Vegard Skirbekk, Bjørn Heine Strand, Siri Eldevik Håberg, and Stein Emil Vollset.2019. Association of household income with life expectancy and cause- specific mortality in Norway, 2005-2015, JAMA 321(19): 1916–1925. doi:10.1001/jama.2019.4329 Klinger, András. 2001. Halandósági különbségek
Magyarországon iskolai végzettség szerint [Mortality differences in Hungary by education level], Demográfia44(3-4): 227–258.
Klinger, András.2003. Mortality differences between the subregions of Hungary, Demográfia English Edition 48(5): 21–53.
Kovács, Katalin, and Lajos Bálint. 2014. Education, income, material deprivation and mortality in Hungary between 2001 and 2008,Demográfia English Edition57(5): 73–89.
Kovács, Katalin, and Lajos Bálint. 2018. Halandóság [Mortality], in Judit Monostori, Péter Őri and Zsolt Spéder (eds). Demográfiai Portré 2018. Jelentés a Magyar Népesség Helyzetéről. KSH Népességtudományi Kutatóintézet.
Mackenbach, Johan P. 2017. Nordic paradox, Southern miracle, Eastern disaster: Persistence of inequalities in mortality in Europe, European Journal of Public Health27(suppl4): 14–17. doi:10.1093/eurpub/ckx160 Mackenbach, Johan P., Irina Stirbu, Albert-Jan R.
Roskam, Maartje M. Schaap, Gwenn Menvielle, Mall Leinsalu, and Anton E. Kunst. 2008. Socioeconomic inequalities in health in 22 European countries,New England Journal of Medicine 358(23): 2468–2481.
doi:10.1056/NEJMsa0707519
Mackenbach, Johan P., José Rubio Valverde, Barbara Artnik, Matthias Bopp, Henrik Brønnum-Hansen, Patrick Deboosere, Ramune Kalediene, Katalin Kovács, Mall Leinsalu, Pekka Martikainen, Gwenn
Menvielle, Enrique Regidor, Jitka Rychtaříková, Maica Rodriguez-Sanz, Paolo Vineis, Chris White, Bogdan Wojtyniak, Yannan Hu, and Wilma J. Nusselder.2018.
Trends in health inequalities in 27 European countries, Proceedings of the National Academy of Sciences115 (25): 6440–6445. doi:10.1073/pnas.1800028115
Mackenbach, Johan P., José Rubio Valverde, Matthias Bopp, Henrik Brønnum-Hansen, Giuseppe Costa, Patrick Deboosere, Ramune Kalediene, Katalin Kovács, Mall Leinsalu, Pekka Martikainen, Gwenn Menvielle, Maica Rodriguez-Sanz, and Wilma J.
Nusselder.2019. Progress against inequalities in mor- tality: Register-based study of 15 European countries between 1990 and 2015, European Journal of Epidemiology 34(12): 1131–1142. doi:10.1007/s10654- 019-00580-9
Marmot, Michael. 2005. Social determinants of health inequalities,The Lancet 365(9464): 1099–1104. doi:10.
1016/S0140-6736(05)71146-6
Moss, Sue M., Howard Cuckle, Andy Evans, Louise Johns, Michael Waller, and Lynda Bobrow. 2006. Effect of mammographic screening from age 40 years on breast cancer mortality at 10 years’follow-up: A randomised controlled trial, The Lancet 368(9552): 2053–2060.
doi:10.1016/S0140-6736(06)69834-6
Nagy, Csilla, Attila Juhász, Linda Beale, and Anna Páldy.
2012. Mortality amenable to health care and its relation to socio-economic status in Hungary, 2004–08, The European Journal of Public Health 22(5): 620–624.
doi:10.1093/eurpub/ckr143
Nagy, Csilla, Attila Juhász, Zoltán Papp, and Linda Beale.
2014. Hierarchical spatio-temporal mapping of prema- ture mortality due to alcoholic liver disease in Hungary, 2005–2010, The European Journal of Public Health24(5): 827–833. doi:10.1093/eurpub/ckt169 Office for National Statistics.2011. Definition of avoidable
mortality. Available: http://www.ons.gov.uk/ons/about- ons/get-involved/consultations/archived-consultations/
2011/definitions-of-avoidable-mortality/definition-of- avoidable-mortality.pdf.
Phelan, Jo C., and Bruce G. Link.2005. Controlling disease and creating disparities: A fundamental cause perspec- tive, The Journals of Gerontology Series B:
Psychological Sciences and Social Sciences 60(Special Issue 2): S27–S33. doi:10.1093/geronb/60.Special_
Issue_2.S27
Phelan, Jo C., Bruce G. Link, Ana Diez-Roux, Ichiro Kawachi, and Bruce Levin. 2004. “Fundamental causes” of social inequalities in mortality: A test of the theory, Journal of Health and Social Behavior45 (3): 265–285. doi:10.1177/002214650404500303
Prentice, Julia C., and Steven D. Pizer. 2007. Delayed access to health care and mortality, Health Services
Research42(2): 644–662. doi:10.1111/j.1475-6773.2006.
00626.x
Scheiring, Gábor, Darja Irdam, and Lawrence King.2018.
The wounds of post-socialism: A systematic review of the social determinants of mortality in Hungary, Journal of Contemporary Central and Eastern Europe 26(1): 1–31. doi:10.1080/25739638.2017.1401285 Scheiring, Gabor, Darja Irdam, and Lawrence P. King.
2019. Cross-country evidence on the social determi- nants of the post-socialist mortality crisis in Europe:
A review and performance-based hierarchy of vari- ables, Sociology of Health & Illness 41(4): 673–691.
doi:10.1111/1467-9566.12846
Scheiring, Gábor, Dénes Stefler, Darja Irdam, Mihaly Fazekas, Aytalina Azarova, Irina Kolesnikova, János Köllő, Vladimir Popov, Ivan Szelenyi, Michael Marmot, Michael Murphy, Martin McKee, Martin Bobak, and Lawrence King. 2018. The gendered effects of foreign investment and prolonged state owner- ship on mortality in Hungary: An indirect demographic, retrospective cohort study,The Lancet Global Health6 (1): e95–e102. doi:10.1016/S2214-109X(17)30391-1 Stallings-Smith, Sericea, Ariana Zeka, Pat Goodman,
Zubair Kabir, and Luke Clancy. 2013. Reductions in cardiovascular, cerebrovascular, and respiratory mor- tality following the national Irish smoking ban:
Interrupted time-series analysis, PloS One 8(4):
e62063. doi:10.1371/journal.pone.0062063
Stanistreet, Debbie, Alex Scott-Samuel, and Mark A.
Bellis. 1999. Income inequality and mortality in England, Journal of Public Health 21(2): 205–207.
doi:10.1093/pubmed/21.2.205
Tarkiainen, Lasse, Pekka Martikainen, and Mikko Laaksonen.2013. The changing relationship between income and mortality in Finland, 1988–2007, Journal of Epidemiology & Community Health 67(1): 21–27.
doi:10.1136/jech-2012-201097
United Nations Development Programme.2019.Human Development Report 2019. Inequalities in Human Development in the 21st Century. Briefing note for countries on the 2019 Human Development Report.
Hungary. Available: http://hdr.undp.org/sites/all/
themes/hdr_theme/country-notes/HUN.pdf.
Uzzoli, Annamária. 2011. The role of unemployment in the run of life chances in Hungary, International Journal of Population Research 2011: 130318. doi:10.
1155/2011/130318.
Wise, Paul H.2003. The anatomy of a disparity in infant mortality,Annual Review of Public Health24(1): 341– 362. doi:10.1146/annurev.publhealth.24.100901.140816 World Health Organization. 2018. The European health
report 2018. Copenhagen: World Health Organization.
Regional Office for Europe.
Appendix: Life expectancy calculation
A1 Baseline
The calculation of baseline life expectancy is based on Arias et al. (2019).
(1) Mortality rate (m):
msia=Dsia
Psia
(1) wheresdenotes sex,adenotes age (45,46…90),i denotes the income ventiles, D is the number of deaths, and P is the population. We note that deaths and population at ages over 90 are included in the age 90 category.
(2) Age-specific probability of death (q):
qsia=
msia
1+0.5msia
ifa=45, 46. . .89
1 ifa=90
(2)
(3) The (hypothetical) number of people alive at start of interval (l):
lsia= 1, 000 ifa=45
lsi(a−1)×(1−qsi(a−1)) ifa=46, 47. . .90
(3) (4) The number of deaths (d) occurring between agesa
anda+ 1:
dsia=lsia×qsia (4) (5) Person-years lived between agesaanda+ 1 (L):
Lsia= lsia−0.5dsia ifa=45, 46. . .89 lsia
msia
ifa=90
⎧⎨
⎩ (5)
(6) Person-years lived beyond agea(T):
Tsia=90
a
Lsia (6)
(7) Life expectancy (e):
esia=Tsia
lsia
(7)
A2 Adjusted
In calculating adjusted life expectancy, we assume that the avoidable mortality rate in each income ventile is equal to the avoidable mortality rate observed in the richest income ventile. At the same time, all non-avoidable mortality rates remain unchanged.
The overall mortality rate can be defined as the sum of the number of avoidable and non-avoidable deaths divided by the total population:
msia=Dsia
Psia =DAsia+DNsia
Psia =mAsia+mNsia (8) wheresdenotes sex,adenotes age,idenotes the income ventiles,D is the number of deaths,Pis the population, andmis the mortality rate.AandN, respectively, denote avoidable and non-avoidable deaths and mortality rates.
The adjusted mortality rate (m*) is calculated as follows:
m∗sia=mAs(i=20)a+mNsia (9)
that is, the avoidable mortality rate of all income groups set to be equal to the avoidable mortality rate of the richest group (i= 20). We note that due to this definition, the adjusted and non-adjusted mortality rates of the richest group are identical.
Next, the calculation of adjusted life expectancy follows steps 2 to 7 of the baseline procedure (section A1) using m* instead ofm.
Adjusted life expectancy is also calculated for preventa- ble and amenable mortality in a similar way by applying the adjustment for differences in preventable and amen- able mortality rates.