CERS-IE WORKING PAPERS | KRTK-KTI MŰHELYTANULMÁNYOK
INSTITUTE OF ECONOMICS, CENTRE FOR ECONOMIC AND REGIONAL STUDIES, BUDAPEST, 2020
The Role of Place and Income in Life Expectancy Inequality:
Evidence from Hungary
ANIKÓ BÍRÓ – TAMÁS HAJDU-GÁBOR KERTESI-DÁNIEL PRINZ
CERS-IE WP – 2020/19
April 2020
https://www.mtakti.hu/wp-content/uploads/2020/04/CERSIEWP202019.pdf
CERS-IE Working Papers are circulated to promote discussion and provoque comments, they have not been peer-reviewed.
Any references to discussion papers should clearly state that the paper is preliminary.
Materials published in this series may be subject to further publication.
ABSTRACT
Using mortality registers and administrative data on incomes and population, we develop new evidence on the magnitudes and sources of life expectancy inequality in Hungary. We document considerable inequality across geographies and income groups, and show that inequality has increased between 1991-2016. We show that avoidable deaths play a large role in life expectancy inequality. Income-related geographic inequalities in health behaviors, access to care, and healthcare use are all strongly correlated with the inequality in life expectancy.
JEL codes: I14, I12, J10
Keywords: life expectancy; income inequality; administrative data; time trend
Anikó Bíró
Health and Population Lendület Research Group (Institute of Economics, Centre for Economic and Regional Studies)
e-mail: biro.aniko@krtk.mta.hu
Tamás Hajdu
Health and Population Lendület Research Group (Institute of Economics, Centre for Economic and Regional Studies)
e-mail: hajdu.tamas@krtk.mta.hu
Gábor Kertesi
Health and Population Lendület Research Group (Institute of Economics, Centre for Economic and Regional Studies)
e-mail: kertesi.gabor@krtk.mta.hu
Dániel Prinz
Harvard University
e-mail: dprinz@g.harvard.edu
Várható élettartam szerinti területi egyenlőtlenségek Magyarországon: a lakhely és a jövedelem szerepe
BÍRÓ ANIKÓ – HAJDU TAMÁS- KERTESI GÁBOR-PRINZ DÁNIEL
ÖSSZEFOGLALÓ
Az országos halálozási regiszter, valamint jövedelemre és népességszámra vonatkozó adminisztratív adatok alapján vizsgáljuk a várható élettartamban mérhető egyenlőtlenségek mértékét és eredetét Magyarországon. Eredményeink jelentős területi és jövedelem szerinti szóródást mutatnak. Az egyenlőtlenség mértéke 1991- 2016 között növekedett. Az elkerülhető (megelőzhető, illetve kezelhető betegségekkel összefüggő) halálokok jelentős szerepet játszanak a várható élettartam szerinti egyenlőtlenségekben. Jövedelemmel összefüggő területi egyenlőtlenségeket találtunk számos fontos egészségi indikátorban, melyek az egyének egészségmagatartását, egészségi ellátórendszerhez való hozzáférési esélyeit, illetve az ellátórendszer tényleges igénybevételét jellemzik. Ezek a különbségek szoros összefüggésben állhatnak a várható élettartam-egyenlőtlenségekkel.
JEL: I14, I12, J10
Kulcsszavak: várható élettartam; jövedelmi egyenlőtlenség; adminisztratív adatok;
időbeli változás
The Role of Place and Income in Life Expectancy Inequality: Evidence from Hungary ∗
Anik´ o B´ır´ o Tam´ as Hajdu G´ abor Kertesi
D´ aniel Prinz April 2020
Abstract
Using mortality registers and administrative data on incomes and population, we develop new evidence on the magnitudes and sources of life expectancy inequality in Hungary. We document considerable inequality across geographies and income groups, and show that inequality has increased between 1991-2016. We show that avoidable deaths play a large role in life expectancy inequality. Income-related geographic in- equalities in health behaviors, access to care, and healthcare use are all strongly cor- related with the inequality in life expectancy.
∗B´ır´o: Centre for Economic and Regional Studies, Health and Population Lend¨ulet Research Group, biro.aniko@krtk.mta.hu. Hajdu: Centre for Economic and Regional Studies, Health and Population Lend¨ulet Research Group,hajdu.tamas@krtk.mta.hu. Kertesi: Centre for Economic and Regional Studies, Health and Population Lend¨ulet Research Group, kertesi.gabor@krtk.mta.hu. Prinz: Harvard University, dprinz@g.harvard.edu. B´ır´o, Hajdu and Kertesi were supported by the Lend¨ulet programme of the Hun- garian Academy of Sciences (grant number: LP2018-2/2018). We thank Robert Kemkers, G´abor Pirisi and Andr´as Tr´ocs´anyi for sharing their data on ambulance response time. The mortality register, population and census datasets, and the Hungarian edition of the European Health Interview Survey used in this paper were accessed through a secure research facility of the Hungarian Central Statistical Office and the Centre for Economic and Regional Studies. The administrative data used in this paper is under the ownership of the Central Administration of National Pension Insurance, the National Health Insurance Fund Administra- tion, the Educational Authority, the National Tax and Customs Administration, the National Labor Office, and the Pension Payment Directorate of Hungary. The data was processed by the Institute of Economics, Centre for Economic and Regional Studies. The linkage of individual-level health spending measures to settlement information was performed in a secure research facility at the Centre for Economic and Regional Studies. Data on filled and unfilled general practices was provided by the National Health Insurance Fund Administration free of charge in the framework of secondary use of public data. The findings and conclusions expressed are solely those of the authors.
1 Introduction
Higher-income individuals have lower mortality and higher life expectancy, even in devel- oped countries with universal or near-universal access to high-quality healthcare. However, the specific sources and nature of this inequality and its evolution over time are not well- understood. In this paper, we use detailed mortality register data, census data, and ad- ministrative data from Hungary to shed light on these questions. We begin by constructing life expectancy measures at age 45 by gender and age for each settlement in Hungary using a national mortality register and population data spanning 1991 to 2016. Using data on the causes of mortality, we are able to separately estimate life expectancy based on all-cause mortality, avoidable deaths, and unavoidable deaths. To track changes in life expectancy and inequality, we estimate life expectancy measures for three different periods, 1991-1996, 2001- 2006, and 2011-2016. We provide evidence on the correlates of life expectancy inequality, including health behaviors, access to healthcare, and healthcare spending.
This paper documents four important patterns. First, we find that there is considerable inequality across geographic areas with different average incomes. Second, we find that this inequality has increased over time. Third, we show that this inequality exists for both avoid- able and unavoidable deaths, with avoidable deaths playing a large role in life expectancy inequality. Fourth, we show that inequality across geographic areas is strongly correlated with various measures of health behaviors, access to use, and healthcare use.
Our work contributes to the literature on health and life expectancy inequality. The in- ternational literature has found that socioeconomic status is positively correlated with health and life expectancy. This association is statistically strong, substantively large, and has been documented across a variety of developed countries and time periods (McDonough, Duncan, Williams and House, 1997; Stanistreet, Scott-Samuel and Bellis, 1999; Marmot, 2005; Cut- ler, Deaton and Lleras-Muney, 2006; Mackenbach et al., 2008;Tarkiainen, Martikainen and Laaksonen, 2013; Case and Deaton, 2015; Chetty et al., 2016; Currie and Schwandt, 2016;
Deaton,2016;Case and Deaton,2017;Mackenbach et al.,2018;Baker, Currie and Schwandt,
2019; European Statistical Office, 2019;Kinge et al.,2019; Mackenbach et al., 2019;Currie, Schwandt and Thuilliez,2020). The literature in Hungary has found similar patterns, largely focusing on levels of education as proxies for socioeconomic status, mortality as a measure of health, and broader geographic regions (Klinger,2001,2003;Kov´acs and B´alint,2014;B´alint and N´emeth, 2018; Kov´acs and B´alint, 2018).1 Importantly, inequality in life expectancy by level of education is among the highest in Hungary relative to other European Union members (Mackenbach et al.,2008, 2018).
Our work contributes in several ways to this established literature. First, we document patterns over a 25-year period and show that while life expectancy at age 45 increased overall, socioeconomic inequality also increased (particularly among women), despite large shifts in Hungary’s economy and society. Second, owing to our detailed data, we are able to estimate life expectancy at the level of income ventiles of settlements. Third, using detailed mortality registers, we separately study the contribution of avoidable and non-avoidable deaths to this inequality and show that at least half of this inequality is due to avoidable causes of death.2 Fourth, we study the relationship between life expectancy inequality and 27 measures of health behaviors, healthcare use, and healthcare access.
The remainder of this paper proceeds as follows. Section 2 describes the data used in this study and summarizes our analysis. Section 3presents our results. Section 4 discusses our findings, limitations and open questions. Section5briefly summarizes and concludes the paper.
1For a systematic review of the literature on the socioeconomic determinants of mortality in Hungary, seeScheiring, Irdam and King(2018). For a review of the regional context, seeScheiring, Irdam and King (2019).
2For a similar decomposition for Sweden, seeHederos, J¨antti, Lindahl and Torssander(2018).
2 Methods
2.1 Data and sample
2.1.1 Mortality, income, and population data
We use unique mortality register data from the Hungarian Central Statistical Office (HCSO) that covers all deaths in Hungary between 1991 and 2016, providing information on the age, gender, and settlement of the deceased, as well as the cause of death. Based on the cause of death, we can separate avoidable (amenable and preventable) and non-avoidable mortality.
Settlement level age- and gender-specific population data also comes from the HCSO.
We use these data to calculate life expectancy and settlement level per capita income. We define income as the settlement-level average per capita annual taxable domestic income.
To calculate the per capita measure, we divide the settlement-level total amount of current annual taxable income (measured in the T-STAR municipal statistical system of the HCSO) with the settlement-level population. We measure all income in 2016 terms.
For international context, we use life expectancy data from European Statistical Office (2020). We include countries for which life expectancy at age 45 is available for all years 2011-2016.
2.1.2 Correlates
We use a rich set of additional data to understand what indicators of health behaviors, healthcare access, and healthcare use are associated with life expectancy inequalities.
We obtained the list of filled and unfilled general practices from the National Health Insurance Fund Administration (NHIFA) of Hungary. Using 2016 data, we calculated the share of unfilled general practices for each settlement.
We use measures of annual social security health spending on inpatient care, outpatient care and prescription drugs, and out-of-pocket spending on prescription drugs using an administrative dataset that covers 2003-2011 and includes a 50% random sample of the 2003
population of individuals aged 5-74. We use the health spending measures for 2011, and restrict the sample to individuals aged 25 or older.3
To describe access to care, we use the T-STAR municipal statistical system of the HCSO.
For each settlement, we know if there is a pharmacy and an outpatient specialist care unit in 2014. Based on this information, and using the road distance measures included in the GEO database of the Centre for Economic and Regional Studies, we calculate the distance (in kilometers) to the nearest pharmacy and nearest outpatient specialist care unit for each settlement. We set the distance to zero if a settlement has a facility.
We measure ambulance response time in minutes in 2009 using the road distance mea- sure of Kemkers, Pirisi and Tr´ocs´anyi (2010), estimating ambulance response times for all settlements.
The share of households using solid fuel for heating comes from the 2011 Census. The dwelling questionnaire of the Census asks respondents about the energy used for heating. In this analysis solid fuel heating is defined as heating with wood or coal.
To understand health-related behaviors, we use measures of the average daily amount of time spent watching TV and with sports from the 2009/2010 Hungarian Time Use Survey (HTUS) administered by the HCSO. The HTUS spreads over a one-year period and follows an open diary design. The sampling units are households, but only one person per household completes a diary for the previous day (starting at 4 a.m. and covering 24 hours) in the course of a face-to-face interview, providing detailed information on their time allocation.
For these measures, we use individuals aged 25 or older.
We also obtain a rich set of health-related indicators from the Hungarian edition of the European Health Interview Survey (EHIS) for 2014. We use binary indicators of preventive care use during the previous year. Specifically, we use indicators for whether an individual had a cholesterol test, a glucose test, and/or a mammography. We also use binary indicators of unmet need for drugs and medical care due to financial difficulties, due to having to wait
3For more details on the availability of healthcare spending information linked to administrative data, seeB´ır´o and Prinz(2020).
too much for a treatment, and due to distance to a treatment unit. Finally, we also use the following indicators of consumption of healthy and unhealthy goods: daily or almost daily consumption of fruits, vegetables, sugary drinks, salty snacks, wholemeal; at least weekly consumption of fish; smoking daily; and alcohol consumption categorized as high or medium risk. For these indicators, the sample is restricted to individuals aged 25 or older.
Appendix Table A1 provides an overview of all variables used and their source. Tables of all variables by settlement-level income ventiles are available at the authors’ website.4
2.2 Analytic approach
For each time period, 1991-1996, 2001-2006, and 2011-2016, we group Hungarian settlements based on their per capita taxable income and divide settlements into ventiles (20 equal-sized bins). Each group represents approximately 5% of the Hungarian population.
We calculate life expectancy at age 45. We pick age 45 because our focus is on the life expectancy of adults. Life expectancy at age 45 is also used as a key health indicator by the WHO (2018). For each time period (1991-1996, 2001-2006 and 2011-2016) and income group we construct gender- and age-specific mortality rates. Specifically, mortality rates are calculated as the number of deaths in a period-gender-age-income cell divided by the population count in that period-gender-age-income cell. For each period, we use the average yearly number of deaths and population. Then, we follow a standard procedure to calculate gender-specific life expectancy for each income group (for more details, see Appendix B.1).
To examine the role of avoidable (preventable and amenable) deaths in the life expectancy difference across income groups, we calculate an adjusted version of life expectancy. In this exercise, we assume that the avoidable (preventable and amenable) mortality rate of each income ventile is equal to the avoidable mortality rate observed in the richest income ventile, whereas the non-avoidable (non-preventable and non-amenable) mortality rate is unchanged (for more details, see Appendix B.2). As the definition of avoidable (preventable
4http://healthpop.krtk.mta.hu/inequality/the-role-of-place-and-income-in-life-expectancy-inequality- evidence-from-hungary/.
and amenable) deaths changes over time, adjusted life expectancy is only calculated for the period of 2011-2016. Our definitions of avoidable, preventable and amenable mortality are based on the definition of the Office for National Statistics (2011). We then plot life expectancy by income ventile.
We group the correlates listed in Section 2.1.2 into three categories: health behaviors, access to care, and healthcare use. For each indicator within each category we calculate the mean value for each income ventile. In the main text, we report a normalized measure for each correlate: the difference between the mean at the richest (top) and poorest (bottom) settlement ventile, divided by the overall mean of the indicator. Thus we obtain comparable inequality indicators for the 27 correlates we use in our analysis.
3 Results
3.1 Relationship between income and life expectancy
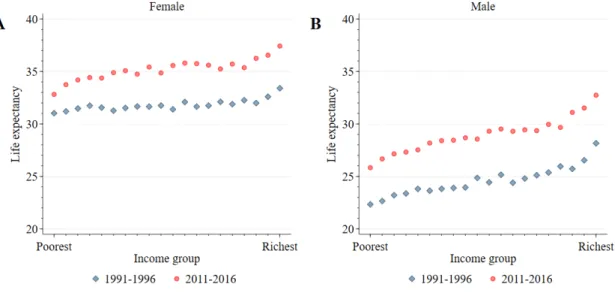
We start by presenting our results for the overall relationship between income and life ex- pectancy for the period of 2011-2016. Figure 1 suggests that there are large inequalities in life expectancy at age 45 across settlement-level income ventiles. These inequalities are larger among males than among females. Among females, the difference in life expectancy at age 45 between the top and bottom ventiles is 4.6 years (37.4 years vs. 32.8 years). In relative terms, this is a 14% difference. Among males, this difference is even larger, both in absolute (6.9 years, 32.7 years vs. 25.8 years) and relative terms (27%). Interestingly, while there are large differences between the top three ventiles and the bottom three ventiles, the relationship between settlement-level income ventile and life expectancy appears much flatter for the middle part of the distribution. For example the difference between the 5th and the 15th ventiles is only 0.8 years (2%) among females and 1.8 years (7%) among males.
Figure 1: Income Inequalities in Life Expectancy
Note: Figure shows life expectancy at age 45 by settlement income ventile, gender, and time period. Panel A shows life expectancy at age 45 for women and Panel B shows life expectancy at age 45 for men. In each panel, blue diamonds show life expectancy at age 45 for the 1991-1996 time period and red circles show life expectancy at age 45 for the 2011-2016 time period. For more details on how settlement income ventiles are defined and life expectancies are calculated, see Section2.2and AppendixB.
3.2 Evolution of inequality over time
Figure 1 also presents the life expectancy at age 45 for years 1991-1996. Average life ex- pectancy at age 45 increased by around 3-4.5 years between 1991-1996 and 2011-2016. Life expectancy increased in all settlement-level income ventiles. Among females, the difference in life expectancy at age 45 between the top and bottom ventiles increased substantially: it was 2.4 years (8%) in 1991-1996 and 4.6 years (14%) in 2011-2016, an approximate doubling both in absolute and relative terms. Among males, the difference was 5.8 years (26%) in 1991-1996 and 6.9 (27%) in 2011-2016. Importantly, among both females and males, the life expectancy of the bottom ventile in 2011-2016 is lower than the life expectancy of the top ventile 20 years earlier. In addition, Appendix Figure C2 shows the same results for an additional time period, 2001-2006.
3.3 Role of avoidable versus unavoidable deaths
What fraction of the observed inequalities in mortality is due to avoidable (preventable or amenable) causes of death?5 Figure 2shows the estimated adjusted life expectancies at age 45, which are calculated based on the assumption that mortality due to avoidable causes of death is the same in each settlement-level income ventile as in the highest ventile. Thus, the remaining inequalities show mortality inequalities due to unavoidable causes of death.
Figure 2: Income Inequalities in Adjusted Life Expectancy
Note: Figure shows life expectancy at age 45 by settlement income ventile and gender for the 2011-2016 time period, based on overall mortality and counterfactual life expectancy estimates if amenable, preventable, or avoidable mortality were eliminated.
Panel A shows life expectancy at age 45 for women and Panel B shows life expectancy at age 45 for men. In each panel, red circles show life expectancy at age 45 based on overall mortality (same as Figure1), blue diamonds show counterfactual life expectancy at age 45 if income inequality in amenable mortality were eliminated, yellow squares show counterfactual life expectancy at age 45 if income inequality in preventable mortality were eliminated, and green triangles show counterfactual life expectancy at age 45 if income inequality in avoidable mortality were eliminated. For more details on how settlement income ventiles are defined and life expectancies are calculated and adjusted by type of mortality, see Section2.2and AppendixB.
Among females, the baseline (unadjusted) difference in life expectancy between the top and bottom ventiles is 4.6 years (14%). This difference reduces to 2.4 years (7%) if income inequalities in avoidable causes of death are eliminated. The role of preventable and amenable causes of death in mortality inequalities is similar.
5A death can be considered as amenable if it could have been avoided through optimal quality health care. The concept of preventable deaths is broader and includes deaths which could have been avoided by public health interventions focusing on wider determinants of public health. (European Statistical Office, 2019).
Among males, avoidable causes of death contribute even more to the income inequalities in mortality. The baseline (unadjusted) difference in life expectancy between the top and bottom ventiles is 6.9 years (27%). This reduces to 2.9 years (10%) if income inequalities in avoidable causes of death are eliminated. Thus, more than half of the income inequality in mortality can be attributed to avoidable causes of death among males. As Figure 2 shows, the role of preventable causes of death is somewhat larger among males than the role of amenable causes of death. This can be mostly due to deaths related to excess consumption of alcohol, smoking but accidents and suicides are also causes of death considered preventable but not amenable.
3.4 Correlates
To analyze which factors might contribute to income inequalities in life expectancy, we look at income inequalities in health related indicators. This analysis uncovers associations rather than a causal relationship. Nevertheless, we believe that our results provide sugges- tive evidence that certain economic, social, and health policies may reduce inequalities in life expectancy by decreasing inequalities in the health related indicators that are strongly associated with inequalities in life expectancy. In the main text, we present figures that show the difference for each of the indicators between the top and bottom income ventiles, divided by the overall mean. In AppendixC.3 we present figures that show the distribution of each of the indicators over all income ventiles.
3.4.1 Health behaviors
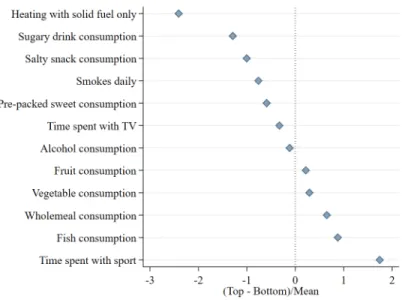
Figure3shows, for various indicators of health behaviors, the difference between the top and the bottom income ventile, standardized by the overall mean. (Appendix Figure C3 shows the distribution of each of the indicators over all income ventiles.) The two health behaviors that are the most different between the top and bottom ventiles are heating with solid fuel
only6 (the difference between the top and the bottom ventile is 2.5 times the overall mean) and time spent with sport (the difference between the top and the bottom ventile is 1.8 times the overall mean). All other health behaviors show the expected sign but appear to be associated with income to varying degrees. Mean-standardized difference in the consumption of sugary food and drinks, salty snacks and smoking is around 0.5-1.5 between the poorest and richest settlements. We see moderate income differences in time spent with watching TV and the consumption of alcohol, vegetables, and fruits. The mean-standardized difference in the consumption of food generally considered healthy (wholemeal and fish) and time spent with sports activities are between 0.5-1.8, with higher prevalence in the richest settlements.
Figure 3: Income Inequalities in Health Behaviors
Note:Figure shows standardized measures of income inequality for measures of health behavior. For each measure, we calculate the difference between the top and the bottom income ventile and divide by the mean. For the full distribution of each of the correlates, see Appendix FigureC3. For more details on how these standardized measures are defined, see Section2.2. For more details on the definition and sources of the indicators, see Section2.1.2and AppendixA.
3.4.2 Access to care
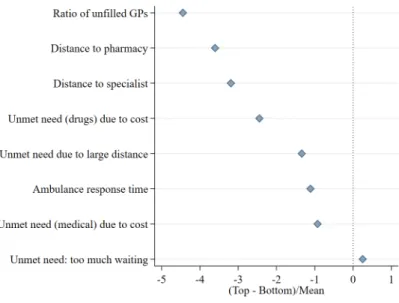
Figure 4 shows, for various indicators of healthcare access, the difference between the top and the bottom income ventile, standardized by the overall mean. (Appendix Figure C4
6This can substantially increase the risk of a variety of diseases (including respiratory diseases and cancer) in poor settlements (P´erez-Padilla, Schilmann and Riojas-Rodriguez,2010).
shows the distribution of each of the indicators over all income ventiles.) There are large inequalities in the access to care across income groups. Unfilled general practices are more widespread (mean standardized difference of -4.4), the distance to pharmacies and specialist outpatient care units is larger (mean standardized difference of -3.6 and -3.2), and wait times for ambulance are larger (mean standardized difference of -1.1) in poorer settlements.
Among four indicators of unmet need, the income gradient is the strongest for unmet need for drugs due to financial difficulties. The mean-standardized difference in the prevalence of unmet need is around 2.5 between the poorest and richest settlements. Unmet need due to distance to treatment facilities and due to cost of medical care are also more widespread in poorer areas. On the other hand, we do not see evidence of an income gradient in unmet need due to long waiting times.
Figure 4: Income Inequalities in Access to Care
Note: Figure shows standardized measures of income inequality for measures of access to care. For each measure, we calculate the difference between the top and the bottom income ventile and divide by the mean. For the full distribution of each of the correlates, see Appendix FigureC4. For more details on how these standardized measures are defined, see Section2.2. For more details on the definition and sources of the indicators, see Section2.1.2and AppendixA.
3.4.3 Healthcare use
Figure 5shows, for various indicators of healthcare use, the difference between the top and the bottom income ventile, standardized by the overall mean. (Appendix Figure C5 shows
the distribution of each of the indicators over all income ventiles.) The use of preventive care (screening) is more widespread in richer settlements, the mean-standardized difference between the top and bottom income ventile is around 0.4-0.6. We also see that out-of- pocket spending on prescription medicines and on outpatient specialist care is higher in the richer settlements, probably due to income effects and better access to care. However, social security spending on prescription medicines and on inpatient care is slightly higher in the poorest settlements than in the richest. This is likely because inpatient care use and social security spending on drugs reflect the worse health status of individuals living in poorer areas.
Figure 5: Income Inequalities in Healthcare Use
Note: Figure shows standardized measures of income inequality for measures of healthcare use. For each measure, we calculate the difference between the top and the bottom income ventile and divide by the mean. For the full distribution of each of the correlates, see Appendix FigureC5. For more details on how these standardized measures are defined, see Section2.2. For more details on the definition and sources of the indicators, see Section2.1.2and AppendixA.
4 Discussion
In this paper, we presented evidence on life expectancy inequality in Hungary. We docu- mented four key facts. First, there are large inequalities across settlements with different average incomes. Second, this inequality has increased over time. Third, considerable in-
equality is present for both avoidable and unavoidable deaths. Fourth, this inequality is strongly correlated with various measures of health behaviors, healthcare use, and health- care access.
To our knowledge, this is the first paper documenting life expectancy inequality by in- come, type of death, and especially over a long time period in Hungary. We also contribute to an established international literature by examining the experience of a country that has gone through tectonic shifts in its economy and society. During the 25-year period between 1991 and 2016 that we examine, Hungary made the transition from a planned socialist economy to a market economy. The country experienced a 19% increase in its Human De- velopment Index, including a 7-year increase in life expectancy at birth, a 4-year increase in expected years of schooling, and a $9,000 (55%) increase in its per capita Gross National Income (United Nations Development Programme, 2019). It is striking that despite these economic and social changes inequality in life expectancy has also increased.
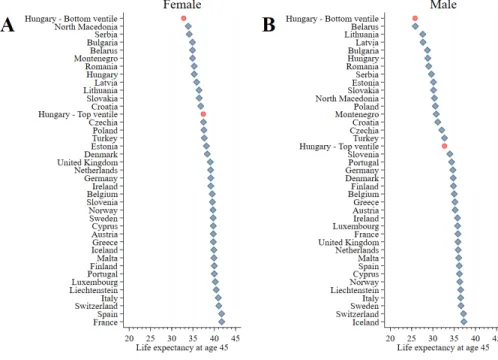
Figure 6 shows how life expectancy at age 45 in the bottom and top income ventiles in Hungary compares to life expectancy in other European countries during the 2011-2016 period. Among women (Panel A), the average life expectancy at age 45 in Hungary is between the level of Latvia and Romania. Life expectancy at age 45 in the bottom income ventile is just under North Macedonia’s average, while life expectancy at age 45 in the top income ventile is between Croatia’s average and Czechia’s average. Among men (Panel B), the average life expectancy at age 45 in Hungary is between the level of Bulgaria and Romania.
Life expectancy at age 45 in the bottom income ventile is just under Belarus’s average. Life expectancy at age 45 in the top income ventile is between Turkey’s and Slovenia’s average.
Figure 6: Hungarian Life Expectancy in European Context
Note: Figure shows life expectancy at age 45 for the 2011-2016 period for European countries. Panel A shows life expectancy at age 45 for women and Panel B shows life expectancy at age 45 for men. In each panel, the red dots represent the bottom and top income ventile in Hungary. For more details on how country life expectancy measures are defined, see Section2.1.1.
Despite methodological differences, we can compare our results on life expectancy in- equality to related results from other countries. We estimate that the gap in life expectancy at age 45 between the top and bottom settlement-level income ventiles is 4.6 years for females and 6.9 years for males. Using individual level income data, Chetty et al. (2016) estimate that the gap in life expectancy at age 40 between the richest 1% and poorest 1% of individ- uals is 10.1 years for females and 14.6 years for males. According to the estimates of Kinge et al. (2019), the inequalities in life expectancy in Norway are very similar to those in the US. Since our results are based on settlement-level incomes and we use ventiles instead of percentiles, our estimated gaps being about half of the estimates from the US and Norway suggest that individual-level inequalities are likely of similar magnitudes.
A novel contribution of this paper is an analysis of the role of amenable, preventable, and avoidable causes of death in overall inequality. Our finding that life expectancy inequality
between the top and the bottom could be cut in half by reducing avoidable mortality to the level of the richest settlements seems quite important for policy. By addressing these specific sources of mortality, policy-makers could have a large impact on the well-being of poorer individuals and reduce inequality significantly.
An important and unsettled question in the literature is what can explain the stable relationship even in countries with universal access to healthcare. In Hungary, we have found in other work that despite universal access, healthcare utilization remains unequal, with higher-income individuals using more healthcare services (B´ır´o and Prinz,2020). In this paper we find that not only is healthcare utilization unequal by income but various measures of access, as well as behavioral factors are much more unequal across the income distribution.
This suggests another lesson for policy: by equalizing access and improving health behaviors, policy-makers could achieve significant gains in life expectancy among poorer individuals and reduce inequality.
5 Conclusions
We have documented considerable inequality in life expectancy at age 45 across geographic areas with different incomes in Hungary. We also showed that over time, inequality has increased, particularly among women. We provided a novel decomposition of this inequality by type of mortality, highlighting the contribution of amenable, preventable, and avoidable causes of death to overall inequality, showing that at least half of life expectancy inequality can be attributed to avoidable causes of death. In the final part of the paper, we presented suggestive evidence on the association of this inequality with measures of health behav- iors, healthcare use, and healthcare access. Overall, this evidence on the role of avoidable deaths and the association of mortality inequality with health behaviors, access to care, and healthcare use suggests that there remains substantial scope for policymakers to increase life expectancy in the poorer areas of the country and to decrease existing inequality.
References
Arias, Elizabeth, Jiaquan Xu, and Kenneth Kochanek. 2019. “United States Life Tables, 2016.”National Vital Statistics Reports, 68(4): 1–65.
Baker, Michael, Janet Currie, and Hannes Schwandt. 2019. “Mortality Inequality in Canada and the United States: Divergent or Convergent Trends?” Journal of Labor Economics, 37(S2): S325–S353.
B´ır´o, Anik´o, and D´aniel Prinz. 2020. “Healthcare Spending Inequality: Evidence from Hungarian Administrative Data.” Health Policy, 124(3): 282–290.
B´alint, Lajos, and L´aszl´o N´emeth.2018. “The Role of Alcohol-Related Mortality in Life Expectancy Inequalities by Educational Level.” Magyar Tudom´any, 179(11): 1666–1679.
Case, Anne, and Angus Deaton. 2015. “Rising Morbidity and Mortality in Midlife Among White Non-Hispanic Americans in the 21st Century.”Proceedings of the National Academy of Sciences, 112(49): 15078–15083.
Case, Anne, and Angus Deaton. 2017. “Mortality and Morbidity in the 21st Century.”
Brookings Papers on Economic Activity, 48(1): 397–476.
Chetty, Raj, Michael Stepner, Sarah Abraham, Shelby Lin, Benjamin Scuderi, Nicholas Turner, Augustin Bergeron, and David Cutler. 2016. “The Association Between Income and Life Expectancy in the United States, 2001-2014.” Journal of the Americal Medical Association, 315(16): 1750–1766.
Currie, Janet, and Hannes Schwandt.2016. “Inequality in Mortality Decreased Among the Young While Increasing for Older Adults, 1990–2010.”Science, 352(19): 708–712.
Currie, Janet, Hannes Schwandt, and Josselin Thuilliez. 2020. “Pauvret´e, Egalit´e, Mortalit´e: Mortality (In)equality in France and the United States.” Journal of Population Economics, 33(1): 197–231.
Cutler, David, Angus Deaton, and Adriana Lleras-Muney.2006. “The Determinants of Mortality.”Journal of Economic Perspectives, 20(3): 97–120.
Deaton, Angust.2016. “On Death and Money: History, Facts, and Explanations.”Journal of the Americal Medical Association, 315(16): 1703–1705.
European Statistical Office.2019. “Amenable and Preventable Death Statistics.”https:
// ec. europa. eu/ eurostat/ statistics-explained/ pdfscache/ 41683. pdf. European Statistical Office. 2020. “Life Expectancy by Age and Sex.” https:
// appsso. eurostat. ec. europa. eu/ nui/ show. do? dataset= demo_ mlexpec&
lang= en.
Hederos, Karin, Markus J¨antti, Lena Lindahl, and Jenny Torssander. 2018.
“Trends in Life Expectancy by Income and the Role of Specific Causes of Death.” Eco- nomica, 85(339): 606–625.
Kemkers, Robert, G´abor Pirisi, and Andr´as Tr´ocs´anyi. 2010. “A ment˝oell´at´as ter¨uleti jellemz˝oi Magyarorsz´agon.” Ter¨uleti Statisztika, 50(4): 420–437.
Kinge, Jonas Minet, Jørgen Heibø Modalsli, Simon Øverland, H˚akon Kristian Gjessing, Mette Christophersen Toll˚anes, Ann Kristin Toll˚anes, Vegard Skir- bekk, Bjørn Heine Strand, Siri Eldevik H˚aberg, and Stein Emil Vollset. 2019.
“Association of Household Income With Life Expectancy and Cause-Specific Mortality in Norway, 2005-2015.”Journal of the Americal Medical Association, 321(19): 1916–1925.
Klinger, Andr´as. 2001. “Haland´os´agi K¨ul¨onbs´egek Magyarorsz´agon Iskolai V´egzetts´eg Sz- erint.” Demogr´afia, 44(3-4): 227–258.
Klinger, Andr´as. 2003. “Mortality differences between the subregions of Hungary.” De- mogr´afia English Edition, 48(5): 21–53.
Kov´acs, Katalin, and Lajos B´alint. 2014. “Education, Income, Material Deprivation and Mortality in Hungary Between 2001 and 2008.” Demogr´afia, 57(5): 73–89.
Kov´acs, Katalin, and Lajos B´alint. 2018. “Haland´os´ag.” In Demogr´afiai Portr´e 2018.
Jelent´es a Magyar N´epess´eg Helyzet´er˝ol. , ed. Judit Monostori, P´eter ˝Ori and Zsolt Sp´eder.
KSH N´epess´egtudom´anyi Kutat´oint´ezet.
Mackenbach, Johan P., Irina Stirbu, Albert-Jan R. Roskam, Maartje M. Schaap, Gwenn Menvielle, Mall Leinsalu, and Anton E. Kunst. 2008. “Socioeconomic Inequalities in Health in 22 European Countries.” New England Journal of Medicine, 358(23): 2468–2481.
Mackenbach, Johan P., Jos´e Rubio Valverde, Barbara Artnik, Matthias Bopp, Henrik Brønnum-Hansen, Patrick Deboosere, Ramune Kalediene, Katalin Kov´acs, Mall Leinsalu, Pekka Martikainen, Gwenn Menvielle, Enrique Regi- dor, Jitka Rychtaˇr´ıkov´a, Maica Rodriguez-Sanz, Paolo Vineis, Chris White, Bogdan Wojtyniak, Yannan Hu, and Wilma J. Nusselder.2018. “Trends in Health Inequalities in 27 European Countries.”Proceedings of the National Academy of Sciences, 115(25): 6440–6445.
Mackenbach, Johan P., Jos´e Rubio Valverde, Matthias Bopp, Henrik Brønnum- Hansen, Giuseppe Costa, Patrick Deboosere, Ramune Kalediene, Katalin Kov´acs, Mall Leinsalu, Pekka Martikainen, Gwenn Menvielle, Maica Rodriguez-Sanz, and Wilma J. Nusselder. 2019. “Progress Against Inequalities in Mortality: Register-Based Study of 15 European Countries Between 1990 and 2015.”Eu- ropean Journal of Epidemiology, 34: 1131–1142.
Marmot, Michael. 2005. “Social Determinants of Health Inequalities.” Lancet, 365(9464): 1099–1104.
McDonough, Peggy, Greg J. Duncan, David Williams, and James House. 1997.
“Income Dynamics and Adult Mortality in the United States, 1972 and 1989.”American Journal of Public Health, 87(9): 1476–1483.
Office for National Statistics. 2011. “Definition of avoidable mortality.”
http: // www. ons. gov. uk/ ons/ about-ons/ get-involved/ consultations/
archived-consultations/ 2011/ definitions-of-avoidable-mortality/
definition-of-avoidable-mortality. pdf.
P´erez-Padilla, Rogelio, Astrid Schilmann, and Horacio Riojas-Rodriguez. 2010.
“Respiratory health effects of indoor air pollution.” The International Journal of Tuber- culosis and Lung Disease, 14(9): 1079–1086.
Scheiring, G´abor, Darja Irdam, and Lawrence King. 2018. “The Wounds of Post- Socialism: A Systematic Review of the Social Determinants of Mortality in Hungary.”
Journal of Contemporary Central and Eastern Europe, 26(1): 1–31.
Scheiring, G´abor, Darja Irdam, and Lawrence King. 2019. “Cross-Country Evidence on the Social Determinants of the Post-Socialist Mortality Crisis in Europe: A Review and Performance-Based Hierarchy of Variables.”Sociology of Health & Illness, 41(4): 673–691.
Stanistreet, Debbie, Alex Scott-Samuel, and Mark A. Bellis. 1999. “Income in Inequality and Mortality in England.” Journal of Public Health, 21(2): 205–207.
Tarkiainen, Lasse, Pekka Martikainen, and Mikko Laaksonen.2013. “The Changing Relationship Between Income and Mortality in Finland, 1988–2007.”Journal of Epidemi- ology & Community Health, 67(1): 21–27.
United Nations Development Programme. 2019. “Human Development Report 2019.
Inequalities in Human Development in the 21st Century. Briefing Note for Countries on the 2019 Human Development Report. Hungary.”http: // hdr. undp. org/ sites/ all/
themes/ hdr_ theme/ country-notes/ HUN. pdf.
WHO. 2018.The European health report 2018. World Health Organization. Regional Office for Europe.
A Data Sources
Appendix Table A1: Data Sources
Data Element Source
Mortality Hungarian Central Statistical Office Mortality Register
Age at Death of the Deceased Hungarian Central Statistical Office Mortality Register Gender of the Deceased Hungarian Central Statistical Office Mortality Register Settlement of the Deceased Hungarian Central Statistical Office Mortality Register Population by Age and Gender at the Settlement Level Hungarian Central Statistical Office
Total Taxable Income at the Settlement Level Hungarian Central Statistical Office T-STAR Municipal Statistical System Life Expectancy for European Countries European Statistical Office(2020)
Road Distance Measures Centre for Economic and Regional Studies Geo Database Annual Social Security Healthcare Expenditures, Specialist Outpatient Care Centre for Economic and Regional Studies Administrative Data
Annual Social Security Healthcare Expenditures, Inpatient Care Centre for Economic and Regional Studies Administrative Data Annual Social Security Healthcare Expenditures, Prescription Drugs Centre for Economic and Regional Studies Administrative Data Annual Out-of-Pocket Healthcare Expenditures, Prescription Drugs Centre for Economic and Regional Studies Administrative Data
Filled and Unfilled General Practices by Settlement National Health Insurance Fund Administration
Availability of Pharmacy by Settlement Hungarian Central Statistical Office T-STAR Municipal Statistical System Availability of Outpatient Specialist Care Unit by Settlement Hungarian Central Statistical Office T-STAR Municipal Statistical System
Ambulance Response Time in Minutes Kemkers, Pirisi and Tr´ocs´anyi(2010)
Households Using Solid Fuel Census
Average Daily Amount of Time Spent Watching TV Hungarian Central Statistical Office Time Use Survey Average Daily Amount of Time Spent With Sports Hungarian Central Statistical Office Time Use Survey
Indicator for Cholesterol Test European Health Interview Survey
Indicator for Glucose Test European Health Interview Survey
Indicator for Mammography European Health Interview Survey
Indicator for Unmet Need for Drugs and Medical Care Due to Cost European Health Interview Survey Indicator for Unmet Need for Medical Care Due to Wait European Health Interview Survey Indicator for Unmet Need for Medical Care Due to Distance European Health Interview Survey Indicator for Daily or Almost Daily Consumption of Fruits European Health Interview Survey Indicator for Daily or Almost Daily Consumption of Vegetables European Health Interview Survey Indicator for Daily or Almost Daily Consumption of Sugary Drinks European Health Interview Survey Indicator for Daily or Almost Daily Consumption of Salty Snacks European Health Interview Survey Indicator for Daily or Almost Daily Consumption of Wholemeal European Health Interview Survey Indicator for At Least Weekly Consumption of Fish European Health Interview Survey
Indicator for Smoking Daily European Health Interview Survey
Indicator for High or Medium Risk Alcohol Consumption European Health Interview Survey
Note: Table shows the source of each data element used in this paper. For more details on our data, see Section2.1.
21
B Life expectancy calculation
B.1 Baseline
The calculation of baseline life expectancy is based on Arias, Xu and Kochanek (2019).
1. Mortality rate (m)
mgia = Dgia
Pgia (1)
whereg denotes gender,a denotes age (45,46,. . . ,90) andi denotes the income ventiles.
D is the number of deaths, P is the population. We note that deaths and population over age 90 is included into the age 90 category.
2. Age-specific probability of death (q)
qgia=
mgia
1+0.5mgia if a= 45,46, . . . ,89 1 if a= 90
(2)
3. The (hypothetical) number of people alive at start of interval (l)
lgia=
1000 if a= 45
lgi(a−1)×(1−qgi(a−1)) ifa = 46,47, . . . ,90
(3)
4. The number of deaths occurring between ages a and a+ 1 (d)
dgia=lgia×qgia (4)
5. Person-years lived between ages a and a+ 1 (L)
Lgia =
lgia−0.5dgia if a = 45,46, . . . ,89
lgia
mgia if a= 90
(5)
6. Person-years lived beyond age a (T)
Tgia=
90+
X
a
Lgia (6)
7. Life expectancy (e)
egia= Tgia lgia
(7)
B.2 Adjusted
Calculating adjusted life expectancy we assume that avoidable mortality rate of each income ventile is equal to the avoidable mortality rate observed in the richest income ventile. At the same time, non-avoidable mortality rates remain unchanged.
Overall mortality rate can be defined as the sum of the number of avoidable and non- avoidable deaths divided by the number of population:
mgia= Dgia Pgia
= DgiaA +DNgia Pgia
=mAgia+mNgia (8)
where g denotes gender, a denotes age, and i denotes the income ventiles. D is the number of deaths, P is the number of population, m is mortality rate. A and N denote avoidable and non-avoidable deaths/mortality rates, respectively.
The adjusted mortality rate (m∗) is calculated as follows:
m∗gia=mAg(i=20)a+mNgia (9)
That is, the avoidable mortality rate of all income groups set to be equal to the avoidable mortality rate of the richest group. We note that due to this definition adjusted and non- adjusted mortality rates of the richest group are identical.
Next, the calculation of adjusted life expectancy follows steps 2 to 7 of the baseline procedure usingm∗ instead ofm (see the previous subsection).
Adjusted life expectancy is calculated applying adjustment for differences in preventable and amenable mortality rates also.
C Additional Figures and Tables
C.1 Geographic distribution of income ventiles
Appendix Figure C1: Geographic Distribution of Income Ventiles
Note:Figure shows the geographic distribution of income ventiles. The first panel shows the distribution for the entire country, while the second panel divides Budapest into its 23 districts. For more details on how settlement income ventiles are defined, see Section2.2.
C.2 Additional time period
Appendix Figure C2: Income Inequalities in Life Expectancy
Note: Figure shows life expectancy at age 45 by settlement income ventile, gender, and time period. Panel A shows life expectancy at age 45 for women and Panel B shows life expectancy at age 45 for men. In each panel, blue diamonds show life expectancy at age 45 for the 1991-1996 time period, yellow squares show life expectancy at age 45 for the 2001-2006 time period, and red circles show life expectancy at age 45 for the 2011-2016 time period. For more details on how settlement income ventiles are defined and life expectancies are calculated, see Section2.2and AppendixB.
C.3 Correlates
Appendix Figure C3: Income Inequalities in Health Behaviors
Note: Figure shows the distribution of measures of health behavior over income ventiles. The grey line provides a quadratic fit. For more details on how the the definition of income ventiles, see Section2.2. For more details on the definition and sources of the indicators, see Section2.1.2and AppendixA.
Appendix Figure C4: Income Inequalities in Access to Care
Note: Figure shows the distribution of measures of access to care over income ventiles. The grey line provides a quadratic fit.
For more details on how the the definition of income ventiles, see Section2.2. For more details on the definition and sources of the indicators, see Section2.1.2and AppendixA.
Appendix Figure C5: Income Inequalities in Healthcare Use
Note: Figure shows the distribution of measures of healthcare use over income ventiles. The grey line provides a quadratic fit.
For more details on how the the definition of income ventiles, see Section2.2. For more details on the definition and sources of the indicators, see Section2.1.2and AppendixA.