Received 19 Jun 2015|Accepted 14 Sep 2015|Published 9 Nov 2015
Atomic and vibrational origins of mechanical toughness in bioactive cement during setting
Kun V. Tian1, Bin Yang2,3, Yuanzheng Yue4,5, Daniel T. Bowron6, Jerry Mayers6, Robert S. Donnan3, Csaba Dobo´-Nagy1, John W. Nicholson7, De-Cai Fang8, A. Lindsay Greer9, Gregory A. Chass10
& G. Neville Greaves4,9,11
Bioactive glass ionomer cements (GICs) have been in widespread use for B40 years in dentistry and medicine. However, these composites fall short of the toughness needed for permanent implants. Significant impediment to improvement has been the requisite use of conventional destructive mechanical testing, which is necessarily retrospective. Here we show quantitatively, through the novel use of calorimetry, terahertz (THz) spectroscopy and neutron scattering, how GIC’s developing fracture toughness during setting is related to interfacial THz dynamics, changing atomic cohesion and fluctuating interfacial configurations.
Contrary to convention, we find setting is non-monotonic, characterized by abrupt features not previously detected, including a glass–polymer coupling point, an early setting point, where decreasing toughness unexpectedly recovers, followed by stress-induced weakening of interfaces. Subsequently, toughness declines asymptotically to long-term fracture test values.
We expect the insight afforded by these in situ non-destructive techniques will assist in raising understanding of the setting mechanisms and associated dynamics of cementitious materials.
DOI: 10.1038/ncomms9631 OPEN
1Department of Oral Diagnostics, Faculty of Dentistry, Semmelweis University, Budapest 1088, Hungary.2Department of Electronic and Electrical Engineering, University of Chester, Thornton Science Park, Chester CH2 4NU, UK.3School of Electronic Engineering and Computer Science, Queen Mary University of London, London E1 4NS, UK.4Laboratory of Extreme Glassy State, State Key Laboratory of Silicate Materials for Architectures, Wuhan University of Technology, Wuhan 430070, China.5Department of Chemistry and Bioscience, Aalborg University, DK-9220 Aalborg, Denmark.6ISIS Facility, STFC Rutherford Appleton Laboratory, Chilton, Didcot, Oxon OX11 0QX, UK.7School of Sport, Health and Applied Science, St Mary’s University, London TW1 4SX, UK.8College of Chemistry, Beijing Normal University, Beijing 100875, China.9Department of Materials Science and Metallurgy, University of Cambridge, 27 Charles Babbage Road, Cambridge CB3 0FS, UK.10School of Biological and Chemical Sciences, Queen Mary University of London, London E1 4NS, UK.11Department of Physics, Institute of Mathematics, Physics and Computer Science, Aberystwyth University, Aberystwyth SY23 3BZ, UK.
Correspondence and requests for materials should be addressed to G.A.C. (email: g.chass@qmul.ac.uk) or to G.N.G. (email: gng25@cam.ac.uk).
W
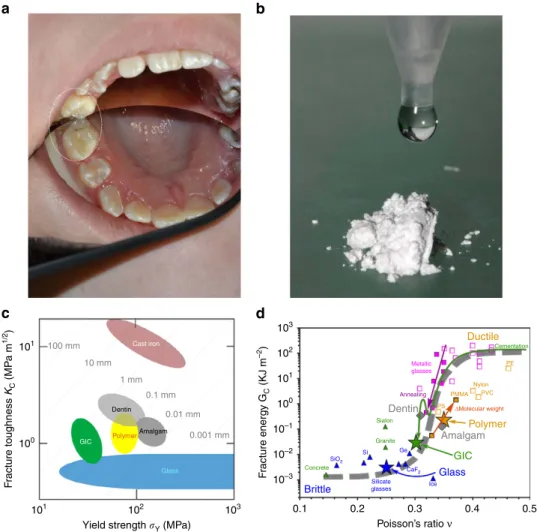
orldwide demand for durable biomaterials emanates from population ageing and from emergent developing countries. Historically, the implantation of foreign materials into the body has been dentistry led. However, the optimisation of tooth replacements remains incomplete, problems stemming from conflicts between mechanical tough- ness, biocompatibility, adhesion and appearance. For commonly used mercury–silver amalgams, this is compounded by toxicity and disposal. The United Nations Environment Programme assesses mercury to be ‘a global threat to human and environmental health,’ listing amalgams as a source1. With 125 million amalgam restorations carried out annually in Europe, the European Commission advocates atraumatic restorative treatment using mercury-free alternatives2, highlighting glass ionomer cements (GICs) (Fig. 1a) as an excellent option.Developed over 40 years3–8, GICs are the product of a basic fluoro-phospho-alumino-silicate glass powder and an aqueous poly(acrylic) acid (PAA) solution (Fig. 1b; Methods)—also known as glass polyalkenoate cements9. Although cost-effective and environmentally friendly2, caries-resistant and bioactively mineralizing dentine10,11, GICs remain too brittle for permanent implants12,13. With exceptional bonding to the apatite phase of bone, GICs have also been considered for other aspects of surgery14–16, but necessarily confined to non-load-bearing applications with moderate durability requirements17.
Damage tolerance is assessed through fracture toughnessKC
and yield strengthsY, both traditionally measured by destructive methods18. Average values for dental materials and their components have been collated to create Fig. 1c. This log KC
versus log sY plot follows the Ashby scheme19 widely used elsewhere in mechanics to categorize conflicts between strength and toughness in composite materials20. Polymers and ceramics lie in the lower half with KC values greater than 1 MPa m1/2; brittle materials such as glasses have KC values less than this.
Indeed the yield strength sY of glassy materials covers many decades21fromB10 GPa (glass fibres) toB1 MPa (pre-damaged glass). RespectiveKCandsYvalues of GICs cluster around those of dentine and amalgam, but clearly have less toughness and strength than either.
For composites in general, and GICs in particular,KCandsY develop during setting, starting out as highly deformable and incompressible slurries that subsequently harden to form rigid, inflexible cements. The compressibility k relates directly to the shape of the interatomic potentials of a given system22. The narrower and deeper the potential is, the stronger and more rigid the atomic cohesion and vice versa. More rigid materials have a higher shear modulusGand lowerk, but most importantly tend to have a higherGk, and to be brittle. In particular, Poisson’s ration(ref. 22), a function ofGk, sharply differentiates between brittleness and ductility. If toughness is converted to fracture
101
a
100 mm 10 mm
1 mm
Dentin
Amalgam
0.1 mm 0.01 mm
0.001 mm
Cast iron
GIC
Glass Polymer
100
101 102
Yield strength Y (MPa) 103
102 103
10–3 10–2 10–1 100 101
0.1 0.2
Brittle
Glass GIC
Ductile
Polymer Amalgam Dentin
PE
Nylon PMMA PVC
Sialon Granite
Concrete Si Ge SiO2
CaF2 Silicate Ice glasses
Metallic glasses
Annealing
PS ΔMolecular weight Cementation
0.3 Poisson’s ratio ν Fracture energy GC (KJ m–2)
Fracture toughness KC (MPa m1/2)
0.4 0.5
b
c d
Figure 1 | GICs properties and glass nanoscopic structure.(a) GIC restorative, including occlusal view. (b) G338 fluoro-alumino-silicate glass powder and dangling aqueous polymer (acrylic acid). (c) Fracture toughnessKCversus strengthsYfor dental materials compiled as an Ashby plot19: dentin, glass and polymers20,21,45, GICs46,47and amalgam60. (d) Fracture energyGcversus Poisson’s rationand the brittle–ductile transition22,23, expanded for a wide range of materials;nvalues for dental materials24,25,61,62combined withGCvalues20–23,45–47,60,61; toughness decline during setting indicated by the dashed arrow; trends for annealing and polymerization (solid arrows).aandbcourtesy Faculty of Dentistry, Semmelweis University.
energyGC(fracture energyGCis related to fracture toughnessKC
by GC¼KC2ð1n2Þ=E, where E is Young’s modulus and n is Poisson’s ratio), as a function of n, this forms a clear sigmoid, with an inflection point (at nE0.33)23 separating ductile (n4B0.33) from brittle (noB0.33) materials (Fig. 1d).
Originally discovered for metals23, this important empirical relationship also holds for inorganic glasses and polymers, the ingredients of GICs and other non-metals. All these materials have been incorporated into Fig. 1d to create a guide for assessing the extent of brittleness of dental materials. In particular, as setting advances,nmust decrease significantly, fromnE0.5, when the cement is a virtually incompressible liquid tonoB0.33, as it solidifies into a brittle solid. This is illustrated by the dashed arrow for GICs, which finally become too brittle, with nE0.30 (ref. 24) compared with amalgam withnE0.34 (refs 22,25). The ultimate aim is to modify GICs so that they are closer in toughness to amalgam and dentin.
The initial setting mechanism of GICs is an acid–base reaction between the aqueous PAA and the glass component (Fig. 1b;
Methods)3,4. As with alumina-silicate glasses, water corrosion ruptures bridging oxygens (BOs) to form SiOH (ref. 26) and AlOH (ref. 27) groups, initially creating an aqueous gel at the glass surface. For the G338 glass used in GICs, PO4and Fwill also be released, along with Naþcations, freeing Al3þand Ca2þ cations to crosslink the polymer to form a strong polysalt matrix4,5. Aluminium chelation by the polymer drives the conversion of Al(IV) tetrahedra to higher-coordinated sites28 at the interfaces between glass and the matrix, as well as those between crosslinked polymer chains within the matrix.
Higher-coordinated sites include both pyramidal Al(V) as well as octahedral Al(VI) geometries. Similar changes in interfacial configuration in proteins, for example, are manifested by variations of orientation-dependent dynamics in the sub-THz range29. These low-frequency modes are known to modulate mechanical30, optical31and biophysical properties32of macromolecular systems.
We have therefore turned to non-destructive techniques that record changing atomic structures, associated collective sub-THz dynamics and atomic cohesion during the first 3 days of setting, uncovering highly nonlinear behaviour over various stages, and providing indications of the sources of eventual brittleness and low strength.
Results
Heterogeneous glass. To make our extendedin situexperiments relevant to current dental practice, we have chosen the commercial G338 ionomer glass (Fig. 1b), in regular use since the early 1980s. To ensure practical relevance, we employed standard clinical preparatory mixing to examine setting from the polymer–
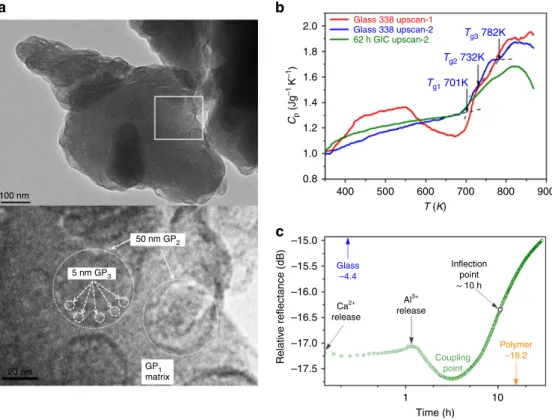
glass mixture to the hardened cement. The glass powder has been imaged by transmission electron microscopy (TEM) and exhibits significant heterogeneity, with three glass phases (GPs) identifi- able on the scale of 5–50 nm (Fig. 2a). Figure 2b and Supplementary Fig. 1 show the isobaric heat capacityCpof both G338 and GIC samples as a function of temperature determined by differential scanning calorimetry (DSC). TheCpof fresh G338 sample (red curve) exhibits the effects of water loss, after which (blue curve) three sharp glass transitions can be deciphered.
2.0
a b
c
1.8
62 h GIC upscan-2
Glass 338 upscan-2 Tg3 782K
Tg2 732K
Tg1 701K Glass 338 upscan-1
1.6
Cp (Jg–1 K–1) 1.4 1.2 1.0 0.8
400 500 600
T (K)
Time (h) 10 GP1
matrix 5 nm GP3
100 nm
20 nm
50 nm GP2
1 –17.5
–17.0 –16.5
Ca2+
release
Al3+
release
Inflection point
~ 10 h
Polymer –18.2 Coupling
point Glass
–4.4 –16.0 –15.5 –15.0
Relative reflectance (dB)
700 800 900
Figure 2 | GIC characterization.(a) TEM image of individual glass particle (above, scale bar, 100 nm) with three distinguishable glass phases:
GP1, GP2 and GP3 seen on an expansion of the white frame area (below, scale bar, 20 nm, see text for details). (b) Three DSC upscan curves for the fresh G338 glass (red), the G338 glass subjected to the first up- and downscans (blue), and the GIC sample (green) subjected to 62 h setting and the subsequent up- and downscans, respectively. The red curve exhibits a water-loss endothermic response, followed by an exothermic enthalpy-release response; the blue upscan-2 curve reveals three sharp glass transitionsTg1,Tg2andTg3, which we associate with the glass phases GP1, GP2 and GP3, respectively; the green curve reveals how glass transitions are modified by setting. Both up- and downscan rates are 20 K min1. (c) Coherent terahertz spectroscopy: changing sub-THz relative reflectance during setting, differentiating gel formation (Caþ2and Al3þrelease) from chelation (Alþ3release);
minimum (CP) identifies the point where glass and polymer couple dynamically.
Following 62 h of setting, the Cp of the GIC (green curve) demonstrates the evolution of the glass-transition regions of the remaining glass.
Coherent terahertz spectroscopy (CTS)33has been employed to track changes in inter-particle binding at the interfaces through variations in collective low-frequency atomic dynamics during setting. Non-monotonic behaviour is clearly evident, revealing several large swings in the magnitude of THz dynamics (Fig. 2c).
For observing mechanical toughness KC atomically, we have turned to in situ neutron Compton scattering (NCS)34, where neutron momentum recoilDpmeasures the atomic cohesion. The development of Dpduring setting at 300 K is clearly oscillatory (Fig. 3a; Supplementary Fig. 2). Using a new empirical relationship between the momentum recoil Dp values and published fracture toughness values (Fig. 3b), changes in atomic
KChave been analysed both for the total systemKCav (Fig. 3c,d) and for separate elementsKCH,F,O,Al(Fig. 3e,f).
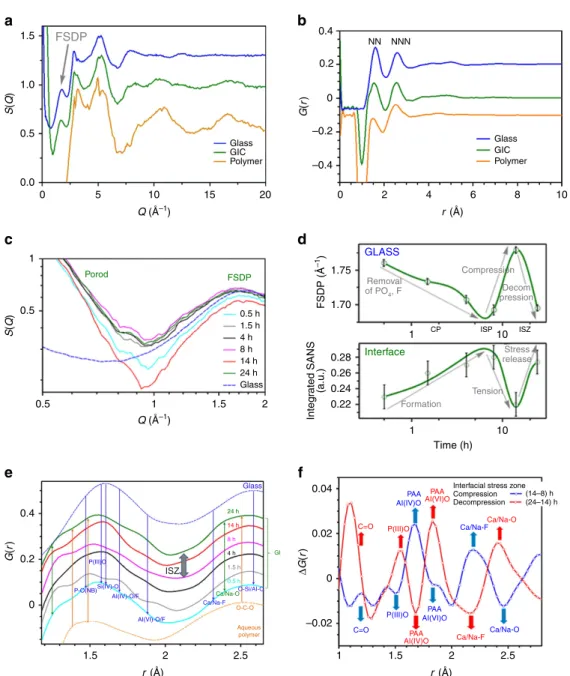
In situneutron scattering measurements also reveal comple- mentary variations in the structure factorS(Q)35associated with nanoscopic structure changes taking place during setting (Fig. 4a,c), and in the real-space transform G(r) (Fig. 4b,d,e).
This extensive set ofin situexperiments has been used to quantify mechanical, structural and dynamical parameters during the setting of GICs, previously unobtainable atomistically7.
The G338 glass is chemically complex, containing ingredients for cementation (calcium, phosphate and alumino-silicate), mineralization (phosphate and fluoride), dental caries resistance (fluoride) and opal appearance (CaþF-rich particles). The network-forming ions are Si4þ, P5þ, with the majority being Al3þ. Al3þ can be charge-compensated for tetrahedral
12
a
11 ISP
Baseline NCS width of starting GIC mixture
Baseline of starting GIC mixture CP ISZ
ISP
ISP
CP
ISP ISZ CP
ISZ
O 300 K
14.0 h
300 K
14.4 h
280 K
9.3 h 8.0 h 6.9 h
13.2 h
320 K
O 300K Polymer 8 A–1
Polymer 1.0 MPa.m1/2 Glass 14 A–1
Glass 0.5 MPa.m1/2
NCS width Δp (Å–1) NCS width Δpav (Å–1)
10
9
0.9
0.8
0.7
Fracture toughness KCav (MPa m1/2) Fracture toughness KCav (MPa m1/2)Fracture toughness KCi (MPa m1/2)
Fracture toughness KCi (MPa m1/2) 0.6
0 10 20 30
Time (h) Time (h)
Time (h) Time (h)
40 50 60
0.9
0.8
0.7 0
0 10 20 30 40 50 60
0 1.27 1.28 1.29 1.30 1.31 1.32 H
2O COO– + H3O+
H
F
F– release F-Ca
AlO4Ca AlO3F
OH– COOH
10 20 30 40 50 60
0.2 0.3 0.4 0.5 0.6 0.7 0.8
AI
AI(VI)-O AI(VI)-O
AI(IV)-O AI(IV)-O/F
ISP ISZ CP
0.8 1.1
1.0
0.9
0.8
0.7
0.6 O
0.5 0.4 0.3 0.2 0.1
10 20
0.8 0.9
ISP
ISZ
0 10 20 30
Time (h)
40 50 60 0.4 0.6 0.8 1.0 1.2 1.4 1.6
8 10 12
14 GIC glass
GIC composite
Polymer 16
SiO2 CaF2 SilicatePhosphate
Resin-modified (vitremer)
Mn 5,000 Mn 22,000 Mn 60,000 Conventional
(fuji II, IX)
Fracture toughness KC (MPa m1/2)
b
c d
e f
Figure 3 | Non-monotonic advancement in atom cohesion and fracture toughness during GIC solidification.(a) Overall GIC NCS peak widthDpav variations with setting time, measuring different stages in atomic cohesion during setting: CP, ISP and ISZ (see text for details). (b) Inverse relationship between atomic cohesionDpavand fracture toughnessKCavof GIC, polymer and glass (asterisks) and associated materials (see text for details).
(c) Non-monotonic fall in overallKCavwith setting time at 300 K obtained from overallDpavausingb, identifying CP and reaction points ISP and ISZ.
(d)KCav(280 K),KCav(300 K) andKCav(320 K), showing shifts in ISP and ISZ with setting temperature. (e) Fluctuations inKCi for H and F, showing evidence for hydration and fluorination. (f)KCi for O and Al through the various setting stages. Elemental fracture toughnessKCi were derived fromDpivalues (Supplementary Fig. 3a), withKCav(280, 300 and 320 K) obtained fromDpav(280, 300 and 320 K) values (Supplementary Fig. 3b), in each case usingb.
configuration by P5þ, and also by Naþ and Ca2þ, which, as network-modifiers, can promote the formation of non-BOs within the BO alumina-silicate network4,36. Considerable fluorine content further depolymerizes the glass melt, leading to low liquidus temperatures28. In the glass, Al3þ coordinates both to BOs and F–(ref. 36), while F–complexes with Ca2þand Naþ as well as with Al3þ. SiO4and PO4tetrahedra principally link via BOs to Al polyhedra, and, while these are mainly tetrahedral, Al(V) and Al(VI) configurations also occur, particularly at the developing interfaces, with the proportions changing during cement setting28,36.
The as-received G338 glass powder (Methods) comprises micron-sized particles (Fig. 2a) exhibiting extensive amorphous phase separation, as others have reported17,37. Our high- resolution TEM image includes a continuous matrix (GP1), in
which are embedded 30–50-nm spherical rosette domains (GP2), decorated by 5–10-nm droplets (GP3). GP2 and GP3 are highlighted by large and small dashed circles, respectively, and are generally seen throughout this image and those of other particles. All three GPs are neutron amorphous (Fig. 4a) and the three glassy states can be verified by DSC traces (Fig. 2b). These reveal three glass transitions: Tg1 (701 K), Tg2 (732 K) and Tg3
(782 K). The small size of GPs and overlaying within TEM images prevents measurement of phase compositions to correlate with Tgs. However, as amorphous phase separation is the primary source for bulk crystalline nucleation in glass ceramics38, crystallographic studies of dental ceramics and devitrified GIC glasses37identify possible glass-phase compositions. In particular, G338 glass, which is a typical phosphate-containing fluoro- alumino-silicate glass, exhibits amorphous phase separation
1.5
a
1.0
S(Q)S(Q)G(r) ΔG(r)G(r)
r (Å) r (Å)
r (Å) Q (Å–1)
Q (Å–1) 0.5
0.0
0.5
0.5
0.4
0.2
0
1.5 2 2.5 1 1.5
–0.02 0 0.02 0.04
0.22
1 10
Time (h)
Interfacial stress zone Compression (14–8) h
(24–14) h
Ca/Na-F PAA
AI(IV)O
PAA AI(VI)O
Ca/Na-F PAA
AI(IV)O PAA AI(VI)O
P(III)O
Ca/Na-O C=O
P(III)O
Ca/Na-O C=O
Decompression
0.24 0.26 0.28 1.70
1 10
1.75
Removal of PO
4, F GLASS
Interface
Compression Decom pression
Stress release
Tension Formation
ISZ ISP CP
Integrated SANS (a.u.)FSDP (Å–1)
2 2.5
1.5 2
Glass 24 h
Glass
24 h 14 h 8 h 4 h 1.5 h 0.5 h
O-C-O
Aqueous polymer Ca/Na-F AI(VI)-O/F
AI(IV)-O/F Si(IV)-O P-O(NB)
P(III)O
ISZ
Ca/Na-O GI
O-Si/AI-O
14 h 8 h 4 h 1.5 h 0.5 h Porod FSDP
1
1
0 5 10 15 20 0
0.4 0.2
0 –0.2
–0.4
2 4 6 8 10
Glass GIC Polymer
Glass NN NNN
GIC Polymer
FSDP
b
c d
e f
Figure 4 | Neutron scattering measurements.Time-averaged (a)S(Q) and (b)G(r), including FSDP and expected locations for nearest- and next-nearest- neighbour pair correlations NN and NNN, respectively. (c)In situtime-resolvedS(Q) over 24 h revealing changes in small-angle Porod scattering (SANS) at interfaces, and in the position of FSDP for the glass. (d) Fluctuations with setting in the FSDP position and the integrated SANS fromc(Methods).
Abrupt changes around 15 h coincide with theDpavminimum andKCavmaximum (Fig. 4a,c). (e)In situtime-resolvedG(r) with NN distances for GIC related to glass (upper) and aqueous polymer (lower). (f) Trends inDG(r) obtained by differencingG(r) across the ISZ (fromd)—splines for guiding the eye.a,bandedata are all offset vertically for clarity of presentation.
resembling the morphology in Fig. 2a and at least two glass transitions at similar temperatures to those appearing in Fig. 2b37. Further annealing drives crystallization by bulk nucleation to a fluoro-phosphate phase and an alumino-silicate phase, the former emanating from amorphous phase-separated droplets and the latter from the surrounding matrix37,39. Accordingly, we attribute the surrounding matrix seen in our TEM images to an alumino-silicate GP (GP1Tg1) and the nanophase droplets to a Ca-F-P-rich GP (GP3 Tg3). From the glass composition (see Materials in the Methods section) the remaining 30–50-nm spherical domains suggest a Ca-F-rich GP (GP2 Tg2). These attributions to the phase-separated components have been confirmed in a recent parallel study40.
Thermodynamically, the as-received G338 glass is far from equilibrium, as evidenced by the broad exothermic peak around 720 K that precedes the glass transitions (Fig. 2b red curve). This shows the release of the enthalpy trapped during the very rapid quenching of the G338 melt41and is absent on reheating (Fig. 2b blue curve). Accordingly, we expect each of the three separated amorphous phases GP1, GP2and GP3(Fig. 2a) to be structurally and energetically heterogeneous in the as-received glass, as discovered in other hyperquenched glasses41. Unstable phases will help drive the hydration process when PAA and glass are mixed.
By heating the GIC cement above room temperature, DSC reveals, first the release of water and any organic impurities and then the decomposition of the polymer, which coincides with the three Tgs in the annealed glass (Supplementary Fig. 1a). The physical consequences of GIC setting are reflected in the altered glass-transition pattern of the residual glass (Fig. 2b green curve) compared with the annealed G388 glass (Fig. 2b blue curve). Most obviously, the boundaries between all three glass transitions in the GIC cement are less distinct, suggesting that all the phases have reacted with PAA. This is most pronounced for GP2Tg2and GP3 Tg3, where the jump from glass to liquid is reduced, which will be partly due to their large surface area. Reactions with PAA might promote a disorder–order transition41, or even partial mineralization, both of which would lower the glass-transition peaks. By contrast, the onset temperature of GP1 Tg1 is least affected by setting, indicating that the primary alumino-silicate network remains largely intact during setting.
Cooperative interfacial dynamics. We observe time-dependent changes in the sub-THz range using CTS33in the early stages as GIC cementation advances (Fig. 2c). These occur between the separate CTS values of the glass and polymer. Since bulk values will not vary, the changes that we see must relate directly to the low-frequency dynamics developing at the interfaces between glass and polymer, as well as those between crosslinked polymer chains within the matrix during setting. The vibrational modes in the sub-THz energy are centred around 0.5 THz and mainly involve collective motions of constituent atoms. These will be increasingly added to, during setting, by inter-component librational changes such as twisting, bending and flexing, with interfacial links serving as pivot points. As these encompassing motions modulate macroscopic interfacial and mechanical properties29,30,32, such as plasticity and elasticity31, the initial dip in CTS signal coincides with Ca2þ release from the glass.
This would appear to be due to the cationic effusion. Governed by the Ca2þrattling frequency in the glass (B12 THz)42, this would initially outpace the polymer’s ability to deform rapidly enough to bind the excess ions, being limited by the polymer’s intrinsic low-frequency dynamics (B0.5 THz). Once Ca2þ is released from the glass, however, subsequent signal recovery over the first 1 h traces the polymer’s progressive chelation of Ca2þ at the interface, until Al3þ emerges from the glass network atB1.5 h,
initiated by a sharp drop in reflectance continuing toB5 h. As the polymer is increasingly localized into a percolating matrix around the glass powder13 and, with gel formation on the glass-particle surfaces4,5, we would expect an associated dampening of the CTS signal, approaching the values of the isolated polymer component (Fig. 2c). This drop, however, is then followed by a sharp increase in THz reflectance, signalling increased activation of interfacial collective modes, and thus of increased coupling between polymer and alumino-silicate glass components. Accordingly, the minimum at 3 h, we propose, defines a coupling point (CP) in the reaction-setting mechanism, after the cement has lost its initial plasticity (Fig. 1d), but before it has started to establish its mechanical strength. More generally, modulation of fluctuations in the sub-THz-regime generally has been linked to elasticity and shear-induced phase transitions43 and has also been associated with the stability of zeolite structures44, proteins32 and in general is typical of the librational dynamics of two-level systems in network structures42.
Atomic cohesion and fracture toughness changes. The momentum peak widthsDpiof individual atom typesi, measured by NCS (Supplementary Fig. 3), quantify the depths of interatomic potentials, and these relate directly to atomic cohesion34. Marked oscillatory changes inDpioccur during GIC setting (Supplementary Fig. 3a), particularly over the first day. To obtain the average momentum width Dpav representative of all elements in the setting cement, Dpi are combined as SiciDpi, where ciis the element fraction. Note that Dpav is bounded by Dppolymer and Dpglass widths for respective polymer and glass components, measured separately (Fig. 3a). As setting advances, Dpavstarts close to theDppolymerwidth, and increases over 62 h, levelling off below the width of the starting mixture, which is dominated by glassDpglass. During this time there is an inflection point atB5 h, which we have identified from CTS THz spectra as the CP between glass and polymer. This is followed by a clear maximum at B8 h, where the atomic cohesion is greatest. We define this as the initial setting point (ISP). This might be the desirable point for cementation to halt. However, there is then a minimum atB15 h, where atomic cohesion momentarily drops before recovering. We later identify this, from changes in S(Q) (Fig. 4d), as an interfacial stress zone (ISZ). Thereafter, the average momentum width Dpavstarts to level out.
Since NCS probes atomic cohesion34, when Dpav is lower, average atomic cohesion is also lower, interatomic potentials shallower and wider and thus the material is tougher, and vice versa. Accordingly, we expect that Dpav and fracture toughness KC might be inversely related for groups of materials. This is demonstrated in Fig. 3b for the GIC system studied, whereDpav values for this GIC composite measured at 24 h are plotted, together with Dppolymer, Dpglass measured separately, as well as those of related compounds (see Supplementary Materials). All are plotted directly as a function of values of fracture toughness KC reported in the literature21,45–47. These extend from single values for specific materials, such as SiO2 or CaF2, to ranges of values ofKCfor different systems such as glasses and polymers, which span different compositions and material treatments.
The asterisked values relate to the particular components, compositions and preparation protocol used in this study (Methods). The spread of theKCvalues around these asterisked points for other glasses, GICs and polymer systems extend to smaller or larger values. These are smallest for oxide glasses and largest for phosphate glasses. Fracture toughness of the GIC glass falls midrange defining the value used in Fig. 3b. Compared with glasses, the span ofKCis much larger for polymers, whereKCis strongly governed by molecular weight Mn(ref. 45), which, for
the polymer used for the present GIC, lies close to 22,000 (refs 7,9) and determines the asterisked value in Fig. 3b. The value of Mn in turn influences the mechanical properties not just of polymers but also of GICs48,49. In particular, KC is greater for resin-modified GICs than for conventional GICs where the current GIC system falls midway, which determines the final asterisked value. Taken together, these well-defined points result in our empirical relationship between Dpav and KC being also well-defined. This is not a reciprocal relationship, as the negative slope, dDpav/dKC, decreases with increasing KC. Figure 3b provides a practical look-up table to calibrate Dpav widths in Å–1 measured with NCS with fracture toughness in MPa m1/2, and is used to convert Dpav from Fig. 3a into average fracture toughness valuesKCavat 300 K during setting (Fig. 3c).
Both atomic cohesion measured from Dpav using NCS and fracture toughness KCavare opposite sides of the same coin and reveal the same CP, ISP and ISZ features in monotonic setting observed early on (Fig. 3a,c). Moreover,KCavobtained from NCS observations offers a way to continuously access mechanical toughness in situ, otherwise complicated by the statistical averaging of multiple specimens inherent in retrospective destructive fracture testing18. In particular, KCav drops sharply with setting time (Fig. 3c), in line with the anticipated fall in n (Fig. 1d), followed by the coupling (CP), setting (ISP) and stress (ISZ) points. Thereafter, KC levels out over the next 2 days, significantly above the baseline toughness—derived using the mixing ratio of the glass and polymer components’ KC values (Fig. 3c). We observe similar progression in KCav at different setting temperatures over the first day (Fig. 3d; Supplementary Fig. 3b). These reveal expected upward shifts in temperature with time for the features CP, ISP and ISZ, as the setting temperature increases.
The elemental momentum widthsDpi(Supplementary Fig. 3a) analysed from the single-particle momentum distribution (Supplementary Fig. 2b) can be converted into elemental fracture toughness values KCi using the same empirical relationship (Fig. 3b). These are shown for H, F, O and Al (Fig. 3e,f) and share the same overall scale asKCav(Fig. 3c), ranging from H with the highest fracture toughness values (B1.3 MPa m1/2) to Al with the lowest (B0.3 MPa m1/2). Elemental values can be interpreted as imparting different degrees of fracture toughness at the atomistic level, with H and Al, for example, possibly contributing toughness and brittleness, respectively. The reaction points CP, ISP and ISZ are again evident. However, H, F and Al exhibit oscillatory changes in KCi (and Dpi) with setting time (Fig. 3e,f;
Supplementary Fig. 3a), which are averaged out inKCav. These may be associated with developments in hydration (KCH), fluorination (KCF) and chelation (KCAl), respectively. This sensitivity to differing chemical bonding is illustrated by hydrogen (Supplementary Fig. 3a). Eventual DpH for GICs reported here is 4.81 Å1, similar to water (4.84 Å1), but greater than ZrH2(4.15 Å1) or NaH (3.32 Å1)34,50,51.
We consider that variable H cohesion during setting has two principal staggered sources: (A) hydration of the alumino-silicate GP GP1 (H2Oþ Si/Al–O–Si/Al-Si/Al–OH–þ OH–Si/
Al) binding OH–; (B) PAA carboxylation at the interfaces (COOH2COO–þHþ) freeing Hþ or H3Oþ. (A) is likely to be linked with gelation at CP, and (B) with subsequent chelation of Al at the ISP that follows at the interfaces. This is consistent with the first minima (binding of OH–) and maxima (release of H3Oþ) in KCH with setting time (Fig. 3e). Likewise, the subsequent maximum inKCFcorresponds to low atomic cohesion, which can be associated with release of F–. The considerable quantity of F–in the glass substantiates reports of AlO3F centres charge balanced by F–Ca and F–Na (ref. 36), which in G338 probably originate from both GP2 and GP3 GPs (Fig. 2a).
Accordingly, we interpret oscillatory changes inKCF with setting time principally with the transformation of oxyfluorides into oxides at the interfaces, accompanied by the release of F–when the atomic cohesion is least (Fig. 3e). Indeed, the similarity ofKCF
to KCAl (Fig. 3e,f) points to F–and Al3þ being partners in the same process, AlO3F converting to AlO4at the ISP. The leaching of F–during early setting provides caries resistance while actively stimulating tooth tissue remineralization, as is often claimed in the literature7,11,37. It seems likely, too, that the compositional species from the Ca, FþP-rich GP (GP3), which assists tooth mineralization10, will be released during the corrosion of the glass at CP. Finally, because oxygen is involved in hydration, fluorination and chelation, we expect setting variations inKCOwill closely follow the overall fracture toughness KCav, which indeed appears to be the case, including the ISZ maximum close to B15 h (Fig. 3c,f).
Atomic structure and interfacial stress. Time-averaged structure factorsS(Q) (whereQis the neutron scattering vector) and total radial distribution functions G(r) (where r is the interatomic distance, with nearest-neighbour (NN) and next NN (NNN)) for the GIC, glass and polymer components measured separately are compared in Fig. 4a,b. S(Q) for the GIC and polymer include artefacts in amplitude, relating to the featureless, but substantial, incoherent scattering of hydrogen (Methods). The peak positions on Q axis in S(Q) and in G(r), though are reliable.
Deuteration was avoided in this study, because this would have adversely affected diffusion and cement-setting processes.
Both GIC and glass S(Q)s exhibit an initial peak—known as the first sharp diffraction peak (FSDP). This directly reflects the average length of intermediate-range order domain rIRO in oxide glasses42. The position of the FSDP QFSDP (2p/rIRO) is composition- and pressure dependent. The fluctuating position of the FSDP (Fig. 4c,d) therefore indicates changes in composition and internal stress. QFSDP for G338 glass is located between 1.5 Å1 for silica and alumina-silicate glasses and 1.9 Å–1 for phosphate glasses42. We therefore attribute the initial decrease in QFSDPfor GIC (Fig. 4d) to the release of phosphate from the Ca, FþP-rich GP (GP3 Fig. 2a). Beyond the ISP there is a sharp increase consistent with compression developing in the remaining glass, followed by decompression, defining the start and end of ISZ. The internal pressure in the glass can be estimated by comparing the shift in QFSDP for silica with the permanent density change under pressure52, and points to B1 GPa being generated in the glass after the ISP at B8 h, then released by B24 h (Fig. 4d).
The integrated small-angle neutron scattering (SANS) from 0.5 to 1 Å–1 (RQmax
Qmin SðQÞQ2dQ) from Fig. 4c is also shown in Fig. 4d. SANS, which measures differential density at the nano- level, is dominated here (B0.5 Å–1) by Porod scattering from interfaces42, which in this case will be principally between the polymer and glass components (Fig. 4c). As the major amorphous phase separation structure in the glass (GP2) isB50 nm in size (Fig. 2a), equivalent to B0.002 Å–1, it is out of range for the present SANS experiments. Instead SANS intensity, which is proportional to interfacial density within the GIC, increases towards the ISZ and then drops sharply before recovering at B24 h; this indicates initial tension at the hybrid interfaces when the density is lowest, then stress release over the ISZ when the original density recovers (Fig. 4d).
Taken together, these variations in nanoscopic structure start with decreased density contrast pointing to tension at the interfaces (SANS) as the glass compresses (increase in FSDP QFSDP) constrained by the increasingly rigid surrounding matrix.
This is followed by overall stress release, where density contrast at
the interfaces observed from SANS and pressure from the decrease in QFSDP is restored, and suggests interfacial failure develops over the later stages of the ISZ. Indeed, indentation studies have shown that macroscopic cracks occur at GIC hybrid interfaces13. Potential failure should occur via Al3þ linkages, as an alternative to fracture propagation at ionic sites within the polysalt complex, which has also been suggested48, where Al3þ bonding may also play an important role.
To ascertain whether complementary changes in real-space structure occur, we have turned to time-dependent total radial distribution functions, G(r)s (Fig. 4e). Because the hydrogen content of the polymer and GIC distorts amplitudes, conventional pair-distribution analysis was replaced by differencing out the effects of hydrogen in the setting of GIC by usingDG(r)s (Fig. 4f).
Furthermore,DG(r)s also masks the unreacted glass and polymer components, highlighting changes in local atomic structure at the interfacial regions during cementation.
Separately measuredG(r)s for GIC, glass and polymer exhibit two well-resolved peaks, due to NN and NNN interatomic distances, respectively (Fig. 4b). This complex multicomponent composite includes numerous interatomic distances within the NN and NNN envelopes, related both to the polymer and glass, as well as to the organic–inorganic interfaces. Figure 4e is therefore annotated with the principal atomic pair correlations in the polymer, such as C¼O and C–C, and Al–O4, Al–O6and O–[Si/
Al]–O in the G338 glass; as well as fluorinated environments identified spectroscopically36, including F–Ca and F–Na. None of these can be unequivocally identified.
Measurable changes occur in G(r) with setting, however, enhanced with differencing, which effectively removes unreacted components in the bulk (Fig. 4e,f). Notably, the coordination of interfacial Al(IV)O transforms to Al(VI)O over the ISZ, with complementary fluctuations in the carboxylate (C¼O) correla- tions, coinciding with generation and then release of internal interfacial stress (Fig. 4d,f). In addition, the switch between Ca/Na–F and Ca/Na–O is consistent with discharge of F (Fig. 3e).
Both swings in nanoscopic structure–SANS and FSDP (Fig. 4d) and in atomic structure—DG(r) (Fig. 4f), coincide with the rise and fall of toughness KCav around 15 h (Fig. 3c) and the complementary minimum in atomic cohesion (Fig. 3a).
Discussion
Comparatively few materials have been measured to date using NCS—GICs being the first complex and dynamic system to be studied. Necessarily, there are differences in NCS profiles with temperature, pressure and interatomic bonding, the latter having provided the avenue to track changing atomic cohesion and dynamic interfacial configurations during cementation.
Comparisons between elemental NCS peak widths Dpi
(Supplementary Fig. 3a) and overall Dp (Supplementary Fig. 3b) and fracture toughness therefore need to relate to the specific materials studied—glass, GIC or polymer—and for them to be measured under the same conditions.
Such geometric switching, mainly dynamic configurations of Al ranging from four-coordinate tetrahedra originating in the glass to a five-coordinate pyramidal, is the likely initial GIC-setting sequence between CP and the ISP. The coherent THz frequencies detected at the developing hybrid interface are in the collective mode range, comprised of twisting, rocking, flexing and compressing modes—potentially at flexural Al pivots.
Importantly, these fall among the collective modes reported for SiO2 (ref. 44), inorganic glasses and zeolite structures44, and typical of the dynamics of two-level systems42.
The successful juxtaposition of in situ sub-THz spectroscopy and neutron methods with DSC herein has enabled the complex
setting-reaction processes of GIC dental composites to be unravelled structurally, energetically and dynamically at the atomic level for the first time. Our methods are equally applicable to studying fracture-toughness development in modified bioactive cement compositions53, where setting may be faster or slower, or in resin-modified GICs before and after curing, including the collective THz dynamics, which, in turn, are linked to inter- particle and interfacial dynamics. We expect that this battery of techniques will also offer advantages more generally for studying mechanical toughness microscopically and non-destructively in other types of mercury-free cements during setting.
Methods
Materials.The composition of the G338 glass powder (First Scientific Dental GmbH, Elmsohm, Germany) was Na6.3Ca6.6P6.2Al16.9Si11.8O32.5F19.7(ref. 7) and was hand-mixed with Chemflex liquid (Dentsply DeTrey GmbH, Germany) of 40%
polyacrylic acid solution, in a respective 2.5:1 ratio for all experiments (Fig. 1b), the proportions leaving the aqueous polymer fraction above the percolation threshold (16%), ensuring that glass particles were fully enveloped. Fresh cement was promptly loaded into measurement canisters. Setting time was recorded from the start of mixing. In each case, the powder and polymer were similarly measured separately, the 2.5:1 ratio providing the baselinet¼0 values (Fig. 3a,c).
Transmission electron microscopy.TEM was performed at the NanoVision Centre at QMUL using scanning electron microscopy and TEM facilities. The G338 glass powder was dried before mounting. With an average particle size range ofB4mm (Supplementary Fig. 4), many smaller fragments ofB1mm were also imaged, revealing phase separation of 50-nm rosette globules within a matrix (Fig. 2a).
Differential scanning calorimetry.The isobaric heat capacity (Cp) data for both G338 and the GIC sample subjected to the 62 h setting and subsequent first DSC up- and downscans (Fig. 2b) were collected in an argon atmosphere using a Netzsche STA449C; reproducibility being checked for baseline drift. G338 underwent two runs of up- and downscan (see glass 338 upscan-1 and upscan-2 curves). For scan 1, the sample was held for 5 min at 323 K, heated at 20 K min1 to 873 K and then cooled back to 523 K at 20 K min1. Scan 2 followed the same procedure.Cpwas determined using a sapphire reference.
Supplementary Fig. 1 shows two upscan curves for both the DSC output (isobaric heat capacityCp) and the mass change of the GIC sample, which was subjected to a 62-h setting. The sample was upscanned in argon at 20 K min1. The first upscan curve in Supplementary Fig. 1a displays two endothermic responses indicating the water evaporation between 340 and 600 K, and the PAA decomposition between 600 and 800 K. These two thermal responses are reflected in the two-stage drop in mass as shown in Supplementary Fig. 1b.
Coherent terahertz spectroscopy.Spectra of G338, Chemflex and the setting cement (Fig. 2c) were obtained using a unique coherent THz transceiver33 incorporating vector-network-analyser-driven quasi-optical circuitry (Supplementary Fig. 5). The cement was loaded into a THz-transparent (polyethylene) vessel (Supplementary Fig. 6) and set at the focal point of fast mirrors, F2 and sealed to maintain water content. The sample absorbance was recorded as spectral reflectance response relative to a standard flat aluminium reflector.
Neutron Compton scattering.NCS spectra were obtained using VESUVIO spectrometer at the ISIS neutron source, with sample sizes of 55 g glass, 20 g polymer and 14 g cements (10 g glassþ4 g polymer—to give 2.5:1 mix ratios), and repeated at differing temperatures (280, 300 and 320 K). Under the conditions of high neutron energy transfer, 1–30 eV, and wavevector transfer, 30–200 Å1, the impulse approximation is valid34. This treats the neutron scattering event as involving a single atom, with conservation of the total kinetic energy and momentum of the neutron plus the atom. NCS therefore probes the momentum distributionni(p) of each elementipresent in the sample.
Calibration was first done by measuring the empty beam and the empty sample holder. The empty sample holder spectrum and the multiple scattering were always subtracted before any data analyses. Multiple scattering was calculated using the assessed Monte Carlo code DINSMS54, which is routinely used for multiple- scattering determinations for NCS experiments. In particular, the code calculates the time-of-flight spectrum of multiply scattered neutrons from samples of known geometry and compositions in DINS experiments. Such a contribution can be isolated in the simulation and subtracted from the experimental data; a detailed description can be found in ref. 54. The raw time-of-flight data for each single- detector spectrum were fitted using the known stoichiometry of the sample. The fitting was carried out after correction for multiple scattering and subtraction of the sample canister signal. Examples are shown in Supplementary Fig. 2 for forward