Full Terms & Conditions of access and use can be found at
http://www.tandfonline.com/action/journalInformation?journalCode=iddi20
Drug Development and Industrial Pharmacy
ISSN: 0363-9045 (Print) 1520-5762 (Online) Journal homepage: http://www.tandfonline.com/loi/iddi20
High-shear granulation of high-molecular weight hypromellose: effects of scale-up and process parameters on flow and compaction properties
Peter Grdešič, Tamás Sovány & Ilija German Ilić
To cite this article: Peter Grdešič, Tamás Sovány & Ilija German Ilić (2018) High-shear granulation of high-molecular weight hypromellose: effects of scale-up and process parameters on flow and compaction properties, Drug Development and Industrial Pharmacy, 44:11, 1770-1782, DOI:
10.1080/03639045.2018.1496447
To link to this article: https://doi.org/10.1080/03639045.2018.1496447
Accepted author version posted online: 03 Jul 2018.
Published online: 07 Sep 2018.
Submit your article to this journal
Article views: 80
View Crossmark data
RESEARCH ARTICLE
High-shear granulation of high-molecular weight hypromellose: effects of scale-up and process parameters on flow and compaction properties
Peter Grdesica, Tamas Sovanyband Ilija German Ilicc
aKrka, d.d., Novo mesto,Smarjeska cesta 6, Novo mesto, Slovenia;bInstitute of Pharmaceutical Technology and Regulatory Affairs, University of Szeged, E€otv€os u. 6, Szeged, Hungary;cDepartment of Pharmaceutical Technology, Faculty of Pharmacy, University of Ljubljana, Askerceva 7, Ljubljana, 1000, Slovenia
ABSTRACT
Context: Knowledge of the effects of high-shear granulation process parameters and scale-up on the properties of the produced granules is essential for formulators who face challenges regarding poor flow and compaction during development of modified release tablets based on high-molecular weight hypro- mellose (hydroxypropylmethylcellulose (HPMC)) polymers. Almost none of the existing studies deal with realistic industrial formulation.
Objective: The aim was to investigate the effects of scale-up and critical process parameters (CPPs) of high-shear granulation on the quality attributes of the granules, particularly in terms of the flow and com- paction, using a realistic industrial formulation based on HPMC K100M polymer.
Methods: The flow properties were determined using flow time, Carr index, tablet mass, and crushing strength variations. The compaction properties were quantified using the‘out-of-die’Heckel and modified Walker models, as well as the tensile strength profile and elastic recovery. High-shear granulation was per- formed at different scales: 4 L, 300 L, and 600 L.
Results and conclusion:The scale itself had larger effects on the granule properties than the CPPs, which demonstrated high robustness of formulation on the individual scale level. Nevertheless, to achieve the desired flow and compaction, the values of the CPPs need to be precisely selected to fine-tune the pro- cess conditions. The best flow was achieved at high volumes of water addition, where larger and more spherical granules were obtained. The CPPs showed negligible influence on the compaction with no prac- tical implications, however, the volume of water addition volume was identified as having the largest effects on compaction.
ARTICLE HISTORY Received 1 March 2018 Revised 6 June 2018 Accepted 15 June 2018 KEYWORDS
Wet granulation; high-shear;
process parameter; scale-up;
hypromellose; HPMC;
compressibility; Heckel;
tabletability; flowability
Introduction
The most common way to produce granules is by wet granulation, where a liquid is used to achieve agglomeration of the primary powder particles into a granulate [1,2]. Wet granulation is com- monly used in many industrial sectors, and most notably for the production of pharmaceuticals. The main objective of the process is to improve the material properties, such as their flow and com- paction, handling and to reduce the dustiness, and segregation tendency [3–5]. The formulation and process parameters as well as scale of operation are known to influence granule properties and considerable efforts have been made to gain better under- standing of the effects that these can have on granule properties, such as morphology, particle size, porosity, density, strength, flow- ability, and other critical quality attributes (CQAs) [3,6–17].
The effects of scale add greatly to the complexity of the granu- lation process. Differences in the scale of operation can signifi- cantly influence the granule properties. Thus, the aim of scale-up activities is to produce identical granule properties when going from small to large scale by maintaining the similarity of the mechanism, such as binder-liquid distribution, nucleation, growth, consolidation, and breakage [18]. Batch scale-up is one of the big- gest challenges in the field of wet granulation technology today, and in practice this has traditionally been performed using costly
trial and error approaches [13,16,19–23]. Indeed, many dimension- less numbers have been developed and applied to determine operating process conditions for scale-up, such as Stokes Number and Reynolds Number. However, the three most widely used scal- ing rules have been keeping constant (a) Froude Number [24,25], (b) Tip Speed [13,26–28], or (c) Shear Stress [29,30].
Despite extensive studies and the use of wet granulation in the pharmaceutical industry, there remains a knowledge gap when hypromellose (hydroxypropylmethylcellulose (HPMC)) is used in formulations, especially in terms of scale-up. HPMC has been widely used as an excipient in various products, with differ- ent functions, such as a binding agent, a controlled-release agent or a film-forming agent in the coating of solid dosage forms [31].
High-molecular weight HPMC polymers are the preferred choice in the design of controlled-release matrix solid dosage forms, and these are available in several grades that vary in extent of substi- tution and molecular weight, which are differentiated and named according to their viscosity. Commercially available HPMC grades consist of irregular particles, which can cause problems with their flow properties in high-speed rotary tableting [32–34]. Thus, direct compression as the preferred method of manufacturing tablets is not always feasible or even possible from the intellectual property point of view. In this case, high-shear granulation is often used to CONTACTIlija German Ilic Ilija.German.Ilic@ffa.uni-lj.si Department of Pharmaceutical Technology, Faculty of Pharmacy, University of Ljubljana, Askerceva 7, Ljubljana 1000, Slovenia
ß2018 Informa UK Limited, trading as Taylor & Francis Group https://doi.org/10.1080/03639045.2018.1496447
improve flow and compaction properties, so that modified release tablets of the desired quality can be produced. Based on our industrial experience, high-shear granulation of HPMC polymers is a very complex process that requires further studies to establish reliable relationships.
Thus, the purpose of this study was to investigate the effects of the scale of the high-shear granulation and the critical process parameters (CPPs) on CQAs mainly connected to flow and com- paction properties of granules, using a realistic formulation based on the HPMC K100M polymer, which further adds to the complex- ity of this practical industrial study. Scale-up effects were studied using the three most widely used scaling rules of constant Froude Number, Tip Speed and Shear Stress. The effects of the process parameters (impeller speed, wet massing time and binder addition volume) were studied using the design of experiments (DOE) approach. The study touches upon an area of significant interest to the pharmaceutical industry and was designed to provide add- itional process knowledge and understanding of how the chosen parameters and scale-up influence the CQAs of the granules, and allow the application of these findings to the more systematic process design of complex pharmaceutical formulations with high-molecular weight HPMC polymers. In the industry, these for- mulations are well-known to be challenging to process during granulation, especially at larger scales, as they are usually not sus- ceptible to the granulation process parameters. The ability to predict the granule properties from the understanding of the formulation and process is what the industry and regulators strive for.
Materials and methods Materials
Since the main focus of this practical study was on processability, i.e. flow and compaction properties of produced granules, for experimental purposes we used placebo formulation that was based on a realistic industrial low-dose product (Table 1). High- molecular weight substitution type 2208 HPMC polymer was used as the binding and controlled-release agent in the formulation (MethocelTM K100M CR Premium; Dow Chemical Company, MI, USA), however, the impact on drug release was not the subject of this study. Milled lactose monohydrate 200 mesh was used as diluent (GranuLacVR 200; Meggle Pharma Excipients and Technology, Wasserburg, Germany). Hydrophilic fumed silica was used as the glidant to improve the flow properties (AerosilVR 200;
Evonik Industries AG, Essen, Germany). Purified water was used as the granulation liquid. Magnesium stearate (FACI, Genoa, Italy) was used as the lubricant and antiadhesive agent.
Granule, compression mixture and tablet preparation
High-shear mixer granulators with different vessel volumes and capacities were used for the granulation, while the same
composition of the formulation was maintained. All of the granu- lators used in our studies were of similar geometry. They have an impeller that consists of a central shaft with three sets of blades that rotate in the horizontal plane at the base of the vessel, and another shaft with smaller blades that acts as the chopper and rotates in the upper region of the vessel, to break up the loose large granules formed. The experiments were conducted at three scales of operation using three vessel volumes of 4 L, 300 L, and 600 L. The batch sizes used were increased linearly as a function of the scale to achieve a constant fill ratio (0.177 kg solid/L cap- acity), and these are given inTable 1. The 300 L production scale (Collette GralTM300 L; GEA Pharma Systems, Dusseldorf, Germany) was used as the reference scale in the scale-up studies, since pro- duction of granules with the most desired (acceptable) flow and compaction properties was validated at this scale. The effects of the scale-up and the process parameters (i.e. impeller speed, wet massing time, binder addition volume) were studied at the 4 L laboratory scale (Formatrix 4M8-TriX Granulator; ProCepT, Zelzate, Belgium) and 600 L production scale (Collette GralTM 600 L; GEA Pharma Systems, Dusseldorf, Germany).
The same technological procedure was used across all of the experiments, regardless of the scale. The intra-granular compo- nents of the formulation (i.e. HPMC K100M, lactose monohydrate, AerosilVR) were added to the vessel and premixed. This homogen- ized mixture was then granulated with a defined amount of water, and then the granulate was wet massed using the process para- meters as specified in sections Scale-up studies and Experimental design. The granules were tray dried at 70C in an oven, to the desired moisture content of 2.5%.
Compression mixtures were prepared by separation of the agglomerates>1 mm (i.e.‘lumps’) from the dried granules by siev- ing, and the remaining granules were mixed with 1% (w/w) mag- nesium stearate in a mixer based on the Paul Schatz principle (Inversina, Bioengineering, Wald, Switzerland), at 60 rpm for 2 min.
The mixtures were compressed into tablets at different pres- sures (up to 250 MPa) using an instrumented single-punch tablet press (Kilian SP300; IMA, Cologne, Germany) mounted with strain gauges at the lower and upper punches, and a linear displace- ment transducer at the upper punch, using round flat-faced 12.0-mm punches without beveled edges, at a tableting rate of 15 tablets/min. The gravity feeding technique was used for the com- pression of mixtures. The target tablet mass was 500 mg. The mass, thickness, diameter and crushing strength of the tablets were evaluated 24 h after production. The tablet apparent den- sities were calculated from the measured mass and volume of the tablets. The mass was determined using an analytical balance (AX224; Sartorius, Goettingen, Germany), and the thickness and diameter were measured using a slide caliper (MIB Messzeuge, Spangenberg, Germany).
Scale-up studies
The potential granule CQAs were first investigated at two different production scales, using the 300 L and 600 L high-shear granula- tors. The 300 L production scale was used as the reference, and the impeller speed for the 600 L granulator was determined according to the constant Froude Number scaling rule ofEquation (1)24[25]:
N600¼N300 D300
D600
0:5
; (1)
where N is the impeller speed and D is the impeller diameter.
The subscripts represent the two scales of the granulators.
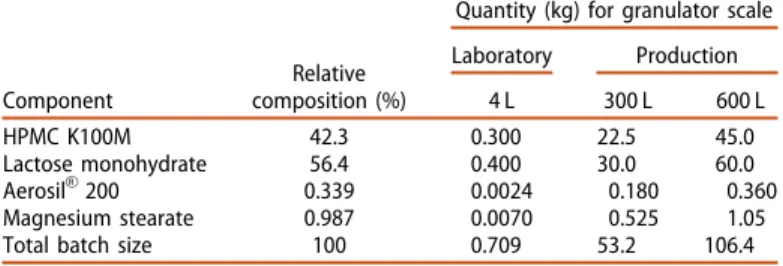
Table 1. Formulations used in this study and quantitative compositions accord- ing to the batch sizes at the different scales of operation.
Component
Relative composition (%)
Quantity (kg) for granulator scale Laboratory Production
4 L 300 L 600 L
HPMC K100M 42.3 0.300 22.5 45.0
Lactose monohydrate 56.4 0.400 30.0 60.0
AerosilVR200 0.339 0.0024 0.180 0.360
Magnesium stearate 0.987 0.0070 0.525 1.05
Total batch size 100 0.709 53.2 106.4
The granulation time was kept constant at both scales, and the water addition volume was linearly increased as a function of scale. Comparisons of the operating process parameters at both of these scales are given inTable 2.
The properties of the dried granules produced at both of these industrial scales were investigated, and those that were affected by the scale-up the most were identified as CQAs of the granules with impact on downstream processability and selected for further studies at the 4 L laboratory granulator scale. First, the effects of scale were analyzed following three scaling rules: constant Froude Number, constant Tip Speed, and constant Shear Stress. The 300 L production scale was used as the reference, and the impeller speed for the 4 L granulator was determined according to Equation (2)[13]:
N4¼N300 D300 D4
C
; (2)
whereNis the impeller speed,Dis the impeller diameter, andCis a constant that depends on the scale-up rule used; i.e. 0.5 for the constant Froude Number, 1.0 for the constant Tip Speed, and 0.8 for the constant Shear Stress. The subscripts represent the two scales of the granulators. The granulation time was kept constant at both of these scales using all three of the scaling rules.
However, the water addition rate could not be linearly decreased to the 4 L scale, as the maximum water addition rate in the granu- lator Formatrix 4M8-TriX was 0.012 kg/min. Consequently, half of the water addition volume was used to keep the granulation time constant. If the higher water addition volumes at the 4 L scale were used to match the water-to-dry-components ratio, i.e. using longer granulation times, the wet mass became over-granulated.
The comparisons of the final operating process parameters at both scales and using the different scaling rules are given in Table 2. The properties of granules produced using these different scaling rules were then investigated and compared to the proper- ties of the reference granules produced in the 300 L granulator.
Experimental design
In the second phase of the studies, the effects of the three CPPs of impeller speed, wet massing time, and water addition volume on the CQAs were investigated at the 4 L scale using the DOE approach.
Already identified CQAs along with other granule properties were set as response variables: loss on drying, particle size,
particle size distribution width, percentage of lumps, morphology, Carr index, flow time, tablet mass and crushing strength variation, compressibility, tabletability, and elastic recovery. A central com- posite design of the response surface methodology was used, and batches were produced according to this design. The coded and real values of the evaluated process parameters are given in Table 3. The experiments were performed in a randomized order.
The responses obtained were analyzed by ANOVA to the 0.05 level of significance, using the Design-ExpertVR software (version 7.0; Stat Ease Inc., Minneapolis, USA).
Loss on drying
The loss on drying of each of the samples was determined using a moisture analyzer (B€uchi B-302; Flawil, Switzerland) on 2 g dried at 85C to constant mass. The results were expressed as the percentage of the loss in weight of the sample. All of the meas- urements were carried out in triplicate.
Table 2. Process parameters at the different granulator scales using the different scaling rules.
Phase Process parameter (units)
Granulator scale
Production Laboratory, 4 L
300 L 600 L Constant Froude number Constant impeller tip speed Constant shear stress
Liquid addition Water addition volumea(L) 18 36 0.12 0.12 0.12
Granulation time (s) 600 600 600 600 600
Water addition rate (kg/min) 1.80 3.60 0.012 0.012 0.012
Impeller speed (rpm) 150 135 310 635 475
Chopper speedb(rpm) Low Low Low Low Low
Wet massing Impeller speed (rpm) 170 150 350 350 350
Chopper speedb(rpm) High High High High High
Wet massing timec(s) 60 70 30 30 30
aWater addition was performed using calibrated peristaltic pump and controlled by using constant liquid addition rate and spraying duration of 10 min, which both were monitored at all scales. We used a single binary nozzle of the same design (atomization by the interaction of high velocity gas and liquid), where the atomiza- tion pressure and air flow were also monitored.
bThe 300 L and 600 L production granulator has only low (1000 rpm) and high (2500 rpm) chopper speed settings.
cWet massing time: impeller speed values at each scale were determined using constant Froude number scalin rule equation and the number of rotations during wet massing was kept constant (approximately 10.500 rotations), both together determining the wet massing time.
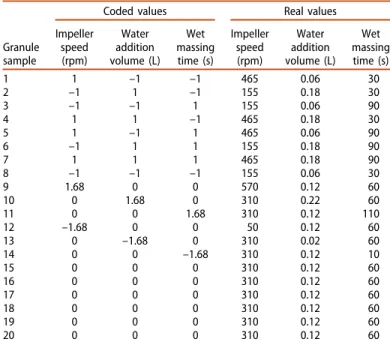
Table 3. Experimental design with coded and real values of the evaluated pro- cess parameters.a
Granule sample
Coded values Real values
Impeller speed (rpm)
Water addition volume (L)
Wet massing
time (s)
Impeller speed (rpm)
Water addition volume (L)
Wet massing time (s)
1 1 –1 –1 465 0.06 30
2 –1 1 –1 155 0.18 30
3 –1 –1 1 155 0.06 90
4 1 1 –1 465 0.18 30
5 1 –1 1 465 0.06 90
6 –1 1 1 155 0.18 90
7 1 1 1 465 0.18 90
8 –1 –1 –1 155 0.06 30
9 1.68 0 0 570 0.12 60
10 0 1.68 0 310 0.22 60
11 0 0 1.68 310 0.12 110
12 –1.68 0 0 50 0.12 60
13 0 –1.68 0 310 0.02 60
14 0 0 –1.68 310 0.12 10
15 0 0 0 310 0.12 60
16 0 0 0 310 0.12 60
17 0 0 0 310 0.12 60
18 0 0 0 310 0.12 60
19 0 0 0 310 0.12 60
20 0 0 0 310 0.12 60
aBaseline reference process parameters (coded values 0) were selected based on the results of the scaling rule effects studies.
Particle size distribution
The particle size distribution was determined on 100 g samples using a vibration sieve analyzer (Retsch AS200, Haan, Germany), with the following sieve sizes: 0.045, 0.063, 0.125, 0.180, 0.250, 0.355, 0.500, 0.710, and 1.000 mm. The sieving lasted for 15 min at amplitude setting 50/100. To compare the samples, the data are presented as the particle size at which 50% (w/w) of the particles were below the given size (median particle diameter,d50) and as the particle size distribution. The particle size distribution width (PDW) was expressed by parameters (d84-d16)/d50, where d16 and d84 are the particle sizes at which 16% (w/w) and 84% (w/w) of particles are below the given size, respectively. The value of d16
was also used as a measure of the fines produced.
The percentage of lumps formed was also determined, in terms of agglomerates of>1 mm.
Morphology and intragranular porosity
The morphology of the granules was investigated using scanning electron microscopy (Supra 35VP-24–13; Carl Zeiss, Oberkochen, Germany), with an acceleration voltage of 2 kV using a secondary electron detector. The granules were deposited on conductive double-sided adhesive carbon tape, and micrographs were collected.
Microcomputer tomography scanning analysis was performed to determine the granule structure and intragranular porosity. The granules were gently poured into a 1.7 mm diameter plastic tube, and then scanned by high-resolution microcomputer tomography (SkyScan 1172; Bruker, Kontich, Belgium), using a digital camera (Hamamatsu 1.3 megapixel). Images were obtained with a pixel size of 2.26lm and an aspect ratio of 1.0. Each slice represented a sample depth of 2.26lm (two-dimensional images), and the slices were collected (n¼250) into a stack using the software (ImageJ 1.51n; National Institutes of Health, Bethesda, USA). The signal of the sample holder tube was eliminated by setting the relevant brightness values (i.e. contrast) of the images. The edges of a sin- gle granule were marked manually on individual slices of the sam- ple stack, and then the threshold was applied to the stack to separate the void space of the pores from the solid material. The intragranular pore volume was determined as follows: the black pixels that represented the areas of the pores were obtained on an individual slice from the stack, and were summed and multi- plied according to the thickness of the slice. The whole area of the marked granule was also determined for individual slices, and mul- tiplied by the thickness of the slice, to determine the volume of the granule. The intragranular porosity was then calculated as the ratio of the pore volume to the granule volume. This was repeated on approximately 15 slices moving through the stack through the granule, to determine the total intragranular porosity. This analysis was performed on five granules from the individual granule sam- ple stack. Three-dimensional representations of the granules were obtained using a 3D viewer plugin of the ImageJ software.
Pycnometric, bulk, and tapped density
The bulk volume of the granules was determined by gently intro- ducing accurately weighed amounts of sample (i.e. granulate, 1%
Mg-stearate mixture) into a graduated 100 ml cylinder. Then the sample was mechanically tapped 1250 times, using a tap density tester (VanKel, NC, USA) to determine the tapped volume. The bulk and tapped densities (g/mL) were calculated from the ratios of the mass and volume of the sample. All of the determinations were carried out in triplicate.
The pycnometric density was determined only on the 1% Mg- stearate mixtures, according to European Pharmacopoeia [35]
(2.9.23. Gas pycnometric density of solids), using a helium pycn- ometer (AccuPyc 1330; Micrometrics, Norcross, GA, USA). All of the determinations were carried out in triplicate.
Flow properties
The flow properties were determined by introducing 50 g of a granule sample into a dry glass funnel with a stem, the bottom opening of which (10-mm outlet nozzle) had been blocked by suitable means. After unblocking the bottom opening of the stem, the flow time was measured, as the time needed for the entire sample to flow out of the funnel. All of the determinations were carried out in triplicate.
The flow properties were also determined using the Carr index, according to European Pharmacopoeia [3]5 (2.9.36. Powder flow).
Also, the tablet mass and the crushing strength variations (n¼20 tablets) were studied on 1% (w/w) Mg-stearate mixtures at a tablet- ing rate of 15 tablets/min and compression pressure of 90 MPa. The variation (RSD) of both of these parameters was used as an indirect measure of the flow properties and tableting performance.
Compressibility, tabletability, and compactibility
For determination of the compressibility, ‘out-of-die’ Heckel [36]
and modified Walker [37,38] models were used. About 25 tablets of each compression mixture sample were produced in the com- pression pressure range of 10 MPa to 250 MPa. The Walker and Heckel coefficients were estimated from their ‘out-of-die’ Walker and Heckel profiles, using linear regression, where each point rep- resented one tablet. The standard error of the slopes and the two-sided 95% confidence interval of the slopes were calculated using Microsoft Office Excel. Statistical significance between the slopes was calculated using two-independent-samples t-test, with either equal or unequal variance (determined by the Hartley test for equality of variance), using a statistical calculator [39]. The same procedure was used in our previous studies [34,40,41].
The tablet crushing force (H) was determined using a hardness tester (VK200; Varian, NC, USA), and the tensile strength (rT) was calculated according to Equation (3), as defined for circular and flat compacts [42]:
rT ¼ 2H
pdh; (3)
where d is the diameter and h is the thickness of the compact.
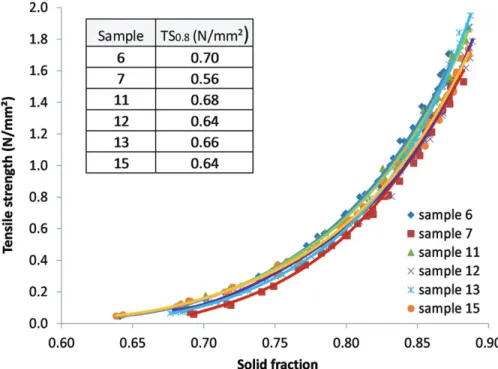
The plots of tensile strength versus compression pressure were constructed, and the slopes (Cp) of the linear parts of these pro- files are measures of tabletability. The statistical testing was per- formed as described previously. The plots of tensile strength versus solid fraction, i.e. compactibility profiles, were also con- structed for selected granule samples. The value of tensile strength at solid fraction value of 0.8 (TS0.8) was used for quantita- tive comparisons.
Elastic recovery
Elastic recovery (ER) was determined according to Equation (4) [43,44]:
ER¼hth0
h0 100; (4)
where h0 is the tablet thickness at maximum compression pres- sure, and ht is the tablet thickness 24 h after the production of
the tablets. The h0 was corrected for elastic deformation of the machine and tooling (upper punch, 0.004600 mm/kN; lower punch and machine, 0.005662 mm/kN). The elastic recovery was deter- mined at compression pressures between 20 MPa and 90 MPa, and it was shown to be independent of the compression pressure used; i.e. its value was reproducible within the range used. Thus, the mean ER was used for comparisons of the elasticity between samples.
Results and discussion
Effects of scale and critical quality attribute determination:
300 L versus 600 L production scale
First, the granule properties of batches produced at different industrial scales were compared (i.e. using 300 L and 600 L high- shear granulator). The objective of these preliminary studies was to determine which properties were most affected by the scale of operation (i.e. the granules’ CQA determination). The scale-up process parameters were determined using the constant Froude
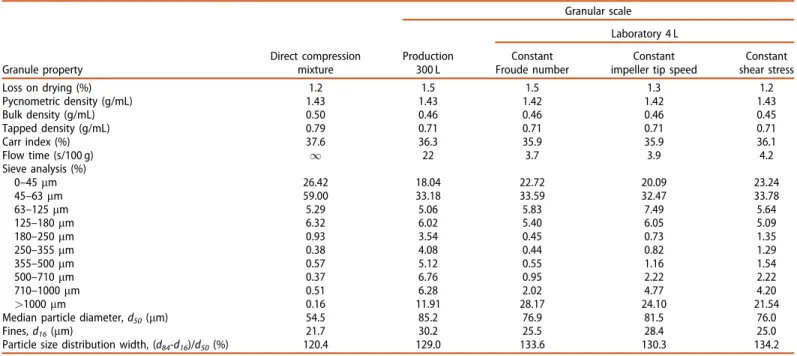
Number scaling rule, where the 300 L scale was used as refer- ence. The basic properties of the granules produced at both scales were investigated and compared, and the data are given inTable 4.
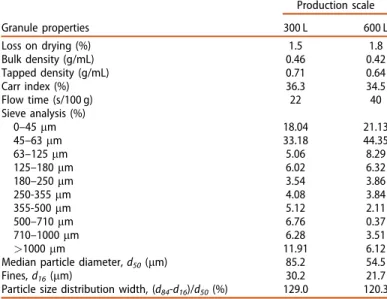
From these data, it can be seen that the scale of operation most affected the particle size distribution; i.e. median particle diameter, percentage lumps, and PDW (see alsoFigure 1), as well as the flow time.
The median particle diameter of the granules produced in the 600 L granulator was lower, and the PDW was narrower in com- parison with the granules produced in the 300 L granulator. Also, the granules produced in the 600 L granulator had more fines, as demonstrated by the lowerd16and the formation of fewer lumps.
The morphology of the granules was also affected by the scale.
Granules produced in the 300 L granulator were generally more rounded (i.e. spherical) and had smoother surfaces, while granules produced in the 600 L granulator had more flattened, fibrillar and angular shape, with sharp edges and rough surfaces (data not shown).
The observed differences in size, shape, and surface between the granules produced at the different scales can affect their flow and compaction properties, either indirectly through the bulk and tapped densities, or directly. The bulk and tapped densities at the 600 L scale were lower in comparison with the granules produced in the 300 L granulator, which thus showed a trend to decrease with increased scale of operation. However, this did not seem to affect the Carr index significantly with values at 600 L and 300 L being 34.5% and 36.3%, respectively. The Carr index classified the flowability of the granules produced at both scales as very poor, according to European Pharmacopoeia [35]. However, the flowabil- ity of the granules produced at the smaller scale appeared to be better, as the flow time was roughly halved, as 40 s and 22 s at 600 L and 300 L, respectively. This appears to be the consequence of the larger size as well as the more spherical, rounded shape and smoother surfaces of the granules produced at the 300 L scale, as discussed previously.
From these preliminary studies, the d50, flow time, percentage of lumps, PDW, and granule shape and surface were identified as the granule CQAs, as these were affected the most by the scale.
Nevertheless, other properties were also investigated during the further studies here, especially the compaction properties.
Table 4. Granule properties produced at the two production scales using the 300 L and 600 L high-shear granulator.
Production scale
Granule properties 300 L 600 L
Loss on drying (%) 1.5 1.8
Bulk density (g/mL) 0.46 0.42
Tapped density (g/mL) 0.71 0.64
Carr index (%) 36.3 34.5
Flow time (s/100 g) 22 40
Sieve analysis (%)
0–45mm 18.04 21.13
45–63mm 33.18 44.35
63–125mm 5.06 8.29
125–180mm 6.02 6.32
180–250mm 3.54 3.86
250-355mm 4.08 3.84
355-500mm 5.12 2.11
500–710mm 6.76 0.37
710–1000mm 6.28 3.51
>1000mm 11.91 6.12
Median particle diameter,d50(lm) 85.2 54.5
Fines,d16(mm) 30.2 21.7
Particle size distribution width, (d84-d16)/d50(%) 129.0 120.3
Figure 1. Cumulative size distribution of the granules produced in the 300 L and 600 L high-shear granulator. The lumps are excluded from the distribution.
Effects of the scaling rule (impeller speed) and water addition volume
In the second step, the identified CQAs were the subject of further studies at the 4 L laboratory granulator scale. The objective was to determine the scaling rule for the production of granules at the 4 L scale that have similar properties to those of the 300 L indus- trial batch, which was again used as reference.
When scaling down to the 4 L granulator, the impeller speed was determined using the three different scaling rules: (a) con- stant Froude Number, (b) constant Tip Speed, and (c) constant Shear Stress. As the water addition rate could not be linearly scaled down to the laboratory scale (see section Scale-up studies), two sets of experiments were initially performed at the maximum possible water addition rate: (a) using a linear decrease for the water addition volume as a function of the scale, which required twice the granulation time, and (b) using half the water addition volume (i.e. keeping constant granulation time as for both indus- trial batches).
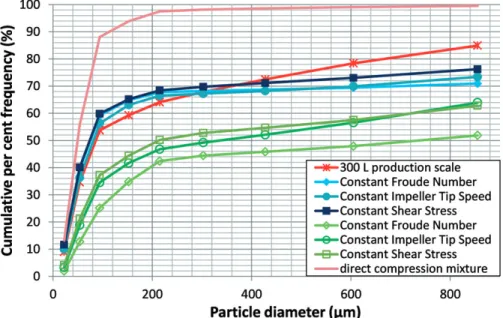
The properties of the dried granules produced at the 4 L scale using different scaling rules were then investigated and compared to 300 L industrial batch. Additionally, the direct compression mix- ture of the formulation studied was prepared and its properties were determined. The data for the cumulative granule size distri- butions are shown inFigure 2.
FromFigure 2, it can be seen that the direct compression mix- ture had the smallest particles, as would be expected. The granule size increased as the water addition volume (or granulation time) increased which is in agreement with observations of other researchers [6,7,17]. At higher water addition volumes, the mass became over-granulated, with larger granules and more lumps produced (Figure 2, green distributions, with blank markers). The best fit with the reference granules produced at the 300 L indus- trial scale was achieved when the granulation time of 600 s was kept constant (Figure 2, blue distributions, with full markers), even though this resulted in a lower water addition volume than speci- fied by the linear decrease as a function of scale. The other meas- ured properties of these granules produced under the three different scaling rules and while keeping the granulation time of 600 s constant are given inTable 5.
Figure 2and the data in Table 5 show that the granules pro- duced in the 4 L high-shear granulator under all three of the scal- ing rules had similar d50 (range, 76–82mm), PDW (range, 130%–134%) and fines diameter (range, 25–28mm), and thus the scaling rule had negligible effects on these properties. Some of the previous studies in the field of scaling rules showed different results, thus suggesting their effects are formulation dependent, however, none of them deals with a practical industrial formula- tion based on high-molecular weight HPMC polymer [12,13,16,23].
Furthermore, the granules produced under all three scaling rules at the 4 L scale had similar d50and PDW in comparison with the granules from the 300 L granulator. A number of the other granule properties measured also showed no effects of the scaling rules applied, such as the loss on drying, density and the Carr index.
However, differences were seen for flow time, as the flow times of the granules produced at the 4 L scale under all three scaling rules were significantly shorter in comparison with the granules produced in the 300 L granulator, even though the bulk and tapped densities (and thus Carr index) were similar. Thus, achiev- ing similar properties of single granules (i.e. particle size and shape) does not always guarantee similar bulk performance prop- erties [23]. These differences appear to be the consequence of other factors, which will be discussed in more details further on.
The direct compression mixture had the worst flow properties here, with an infinite flow time and the highest Carr index, which showed that the granulation greatly improved the flow properties.
The last difference was for the percentage of lumps for the 4 L and 300 L scales, as 21% to 28% versus 12%, respectively, which could contribute to above mentioned differences to the flow time.
From these data, it can be concluded that at the 4 L scale the granule size distribution of the HPMC K100M-based formulation studied is less dependent on the scaling rules used (i.e. impeller speed) and is instead a lot more sensitive to the water addition volume. Also, the other granule properties showed negligible dependence on the scaling rules used in comparison to the effects of the scale itself, which was particularly true for the flow time and the percentage of lumps.
Next, the compaction properties of the granules produced were determined with the methodology that was used in our pre- vious study [34]. The compressibility data show two distinct
Figure 2. Cumulative size distribution using the 300 L and 4 L granulators according to the three different scaling rules. Blue distributions (with full markers) show the granules produced with half the water addition volume,versusthe green distributions (with blank markers). Lumps were excluded from the distribution.
regions for the Heckel and Walker plots, as illustrated inFigure 3.
The first region had a steep slope up to the compression pressure of 110 MPa, where a distinct break occurred. This region repre- sents the compression pressure range where the fragmentation of the granules into primary particles and most of the plastic deformation occurred, while at higher compression pressures the slope was considerably flattened. Similar behavior for HPMCs has already been reported [34]. Thus, the first steeper region is the region of choice for the evaluation of the compaction properties of the granules (i.e. when produced using different scaling rules), and only these data are shown. For complete understanding and for a comparison of the mechanical behaviors, the tabletability
and elastic recovery of the granules produced were also taken into account. The compaction properties of the granules produced are summarized inTable 6.
The differences in the Heckel and Walker coefficients between the granules produced at the 4 L scale demonstrated lack of cor- relation with the scaling rules used (i.e. impeller speed). When comparing both compressibility coefficients, the granules that were produced using the constant Froude Number scaling rule showed the best fit with granules produced at the 300 L produc- tion scale.Figure 3 illustrates the‘out-of-die’Heckel plots for the granules produced in the 300 L and 4 L granulators using the con- stant Froude Number scaling rule, and similarities between these Table 5. Basic granule properties produced at the 300 L and 4 L scales using the three different scaling rules (i.e. different impeller speeds) while keeping the granu- lation time constant. The data for the direct compression mixture are also included.
Granule property
Direct compression mixture
Granular scale
Production 300 L
Laboratory 4 L Constant
Froude number
Constant impeller tip speed
Constant shear stress
Loss on drying (%) 1.2 1.5 1.5 1.3 1.2
Pycnometric density (g/mL) 1.43 1.43 1.42 1.42 1.43
Bulk density (g/mL) 0.50 0.46 0.46 0.46 0.45
Tapped density (g/mL) 0.79 0.71 0.71 0.71 0.71
Carr index (%) 37.6 36.3 35.9 35.9 36.1
Flow time (s/100 g) 1 22 3.7 3.9 4.2
Sieve analysis (%)
0–45mm 26.42 18.04 22.72 20.09 23.24
45–63mm 59.00 33.18 33.59 32.47 33.78
63–125mm 5.29 5.06 5.83 7.49 5.64
125–180mm 6.32 6.02 5.40 6.05 5.09
180–250mm 0.93 3.54 0.45 0.73 1.35
250–355mm 0.38 4.08 0.44 0.82 1.29
355–500mm 0.57 5.12 0.55 1.16 1.54
500–710mm 0.37 6.76 0.95 2.22 2.22
710–1000mm 0.51 6.28 2.02 4.77 4.20
>1000mm 0.16 11.91 28.17 24.10 21.54
Median particle diameter,d50(lm) 54.5 85.2 76.9 81.5 76.0
Fines,d16(mm) 21.7 30.2 25.5 28.4 25.0
Particle size distribution width, (d84-d16)/d50(%) 120.4 129.0 133.6 130.3 134.2
Figure 3. Heckel plots for the granules produced in the 300 L and 4 L granulators using the constant Froude number scaling rule, and showing two distinct regions of deformation.
two samples can be seen. The compressibility data of the HPMC K100M-based formulation studied show significant differences in the Heckel (P¼0.00094) and Walker (P¼0.000012) coefficients for the granules produced at the 4 L scale in comparison with those produced at the 300 L scale, with the latter being less compress- ible. Again, this illustrates the importance of the scale effects.
TheCpvalues varied in a narrow range from 0.00908 to 0.0114, and the differences in Cp between the granules produced using the different scaling rules at the 4 L scale were not significant.
However, the differences between granules produced at the 4 L and 300 L scales were significant (P<0.000782), where better tab- letability was shown for the granules produced in the 300 L granu- lator. The differences in elastic recovery between these individual granule samples were negligible, with the granules produced at the 300 L scale showing slightly higher elasticity. Nevertheless, in comparison to the direct compression mixture, all of the granu- lated samples had lower Cp and higher elastic recovery, thus showing the negative effects of the granulation process and par- ticle enlargement on tabletability of the formulation studied.
In summary, these data show little or no dependence of the granule properties (e.g. granule size, flow, compaction properties) on the scaling rules used, in contrast to the effects of the scale itself. This suggests high importance of the scale effects since geo- metric similarity of the process equipment does not guaranty kinematic and dynamic similarity, and also suggests high robust- ness of the formulation studied with regards to the effects of the process parameters at the individual scale level. Up to this point none of the reported studies deal with these scale-up effects in relation to the practical industrial HPMC K100M-based formulation.
To confirm these data, further studies of the effects of selected process parameters at the 4 L laboratory scale were conducted.
The process parameters based on the constant Froude Number scaling rule were selected as the central point reference, as when all of the data were considered, the granules produced using this rule showed the best fit with reference granules produced at the 300 L scale. From the granule bulk properties perspective, Froude Number emerged as the best scale-up approach already in some previous studies [23], but not in all cases [13,16].
Effects of process parameters on granule properties
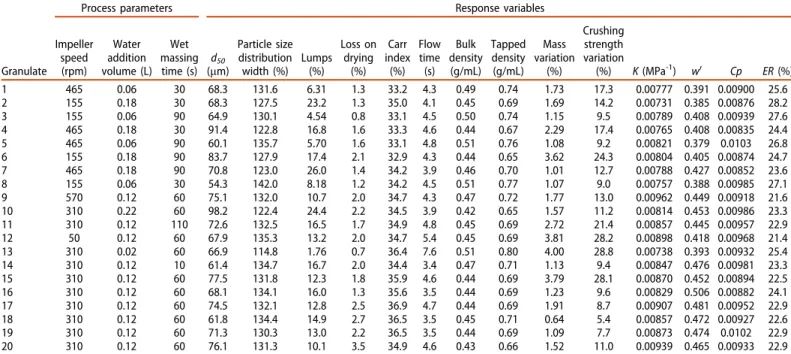
A central composite design of experiments was used to study the effects of the impeller speed, wet massing time, and water add- ition volume on the granule properties (i.e. the already identified CQAs, and other granule properties). The process parameters and their values were selected based on the data from the scaling rules studies. Particle size and PDW, percentage lumps, bulk and
tapped densities, Carr index, flow time, mass and crushing strength variation, compressibility, tabletability, and elastic recov- ery were set as the response variables. The data obtained are given inTable 7. LOD can have a significant effect on the granule flow and compaction properties in general as well, and this is especially true for HPMC polymers, hence the goal was to dry all the samples to the desired constant value of approximately 2.5%
and the differences in determined LOD in a reasonably narrow range of 0.7–3.5% were found to have a negligible effect on these properties (lack of correlation) and could be to some extent also the consequence of experimental and method error.
The effects of the process parameters ond50 showed that the two-factor interaction model was statistically significant (P¼0.0036) and described the relationships with a good fit. The factor with the largest effect on d50 was the water addition vol- ume; however, the interaction between the impeller speed and the wet massing time also had large effect. In addition, the effects of the process parameters on lump formation showed that the water addition volume had the largest and only significant effect (P0.0001), with a linear model (R2¼0.854). The amount of liquid crucially affects the dynamics of the initial wetting process and the number of liquid bridges between the primary particles, the nucleation process, and the growth of the granules. A higher water addition volume resulted in the formation of more liquid bridges between the particles, which resulted in the promotion of granule growth; i.e. larger granules and more lumps were formed [17]. On the other hand, the effects of the impeller speed and the wet massing time were more complex; i.e. they showed an inter- action between them. Here, higher impeller speed and longer wet massing time decreased the granule size. This can be attributed to higher attrition and consolidation of the granules due to the greater energy input, an effect also reported by other studies [7,14,16]. Similarly, lower impeller speed and shorter wet massing time again decreased the granule size. These granulation condi- tions had insufficient energy input, which hindered the redistribu- tion of the binding liquid by the impeller, to result in high levels of ungranulated material. These essential mechanisms of the granulation (i.e. wetting, growth, consolidation, attrition) typically occur simultaneously, and often compete against each other in the determination of the final granule properties; i.e. certain mechanisms might dominate under particular conditions [3,4].
Higher impeller speed and shorter wet massing time, and vice versa, increased the granule size, as the energy conditions were in favor of the granule growth processes for the formulation studied, which is in accordance with some previous work [6]. Figure 4 shows the effects of impeller speed and wet massing time on the median particle diameterd50.
Table 6. Compaction properties of the granules produced in the 300 L and 4 L granulators using the three different scaling rules (i.e. different impeller speed) while keeping the granulation time constant. The data for the direct compression mixture are also included.
Granule property Direct compression mixture
Granulator scale
Production 300 L
Laboratory 4 L
Constant Froude Number Constant impeller tip speed Constant shear stress Heckel analysis
K(MPa–1) 0.00821 0.00723 0.00856 0.00946 0.00970
R2 0.987 0.997 0.992 0.986 0.986
Walker analysis
w0 0.406 0.375 0.499 0.557 0.495
R2 0.991 0.996 0.991 0.983 0.985
Cp 0.0114 0.0105 0.00908 0.00912 0.00913
R2 0.996 0.987 0.996 0.994 0.992
Elastic recovery (%) 22.1 25.1 24.2 24.5 23.2
This study also reveals complex effects of the process parame- ters on PDW. The model did not reach statistical significance (P¼0.0962), although some trends were seen and can be dis- cussed. Here, the initial wetting and distribution of the binding liquid can have a pronounced influence on the size of the nuclei granules. Poor distribution of the liquid results in a wide nuclei size distribution, which leads to a wide granule size distribution (i.e. retaining the ‘memory’ of the granulation process). Lower impeller speed and shorter wet massing time resulted in an increased PDW. These lower energy input conditions can lead to poorer mechanical distribution of the binding fluid and more ungranulated primary particles. At higher impeller speed and/or wet massing time (i.e. higher energy input), the PDW was decreased, as the shear forces broke down the overwet clumps.
Furthermore, the water addition volume had effect on PDW. This study showed a range of water addition volumes that resulted in increased PDW, but at values outside of this range (i.e. both lower and higher), the PDW decreased. However, this effect was less profound in comparison to the influence of the impeller speed and the wet massing time. Finally here, it can be concluded that the process parameters need to be carefully selected to achieve the desired granule size and size distribution; i.e. fine-tuning of the process conditions is necessary.
The effects of the process parameters on the bulk and tapped densities showed that a quadratic model was statistically signifi- cant in both cases (P0.0001), and the effects of the individual parameters or their interactions were similar for both of these densities. The factor that had the greatest effects on both the bulk and tapped densities was again the water addition volume;
however, the impeller speed and the wet massing time interac- tions also had strong effects. The effects of water addition volume appear to be indirect and a consequence of primary properties, i.e. d50 and PDW. Higher water addition volumes resulted in d50 increase and PDW decrease, which leads to lower bulk and tapped densities of the granules produced. This is a consequence of the packing order, as there are no smaller granules or ungranulated particles to fill the inter-particulate voids. On the contrary, at lower water addition volumes,d50decreased while PDW remained low, which resulted in higher bulk and tapped densities of the granules. Here the smaller granules are more closely packed and show lower inter-granular porosity. The combined effects of the impeller speed and the wet massing time had a more complex influence which is shown inFigure 5for tapped density. The low- est values of both the bulk and tapped densities were observed at low impeller speeds and high wet massing times, and vice versa.
Figure 4. Effects of the impeller speed and the wet massing time on the median particle diameterd50at the water addition volume of 0.12 L.
Figure 5. Effects of impeller speed and wet massing time on the tapped density, at the water addition volume of 0.06 L.
Table 7. The experimental design with the investigated process parameters and the response variables.
Process parameters Response variables
Granulate Impeller
speed (rpm)
Water addition volume (L)
Wet massing time (s)
d50
(mm)
Particle size distribution width (%)
Lumps (%)
Loss on drying
(%) Carr index
(%) Flow time (s)
Bulk density (g/mL)
Tapped density (g/mL)
Mass variation
(%)
Crushing strength variation
(%) K(MPa-1) w0 Cp ER(%)
1 465 0.06 30 68.3 131.6 6.31 1.3 33.2 4.3 0.49 0.74 1.73 17.3 0.00777 0.391 0.00900 25.6
2 155 0.18 30 68.3 127.5 23.2 1.3 35.0 4.1 0.45 0.69 1.69 14.2 0.00731 0.385 0.00876 28.2
3 155 0.06 90 64.9 130.1 4.54 0.8 33.1 4.5 0.50 0.74 1.15 9.5 0.00789 0.408 0.00939 27.6
4 465 0.18 30 91.4 122.8 16.8 1.6 33.3 4.6 0.44 0.67 2.29 17.4 0.00765 0.408 0.00835 24.4
5 465 0.06 90 60.1 135.7 5.70 1.6 33.1 4.8 0.51 0.76 1.08 9.2 0.00821 0.379 0.0103 26.8
6 155 0.18 90 83.7 127.9 17.4 2.1 32.9 4.3 0.44 0.65 3.62 24.3 0.00804 0.405 0.00874 24.7
7 465 0.18 90 70.8 123.0 26.0 1.4 34.2 3.9 0.46 0.70 1.01 12.7 0.00788 0.427 0.00852 23.6
8 155 0.06 30 54.3 142.0 8.18 1.2 34.2 4.5 0.51 0.77 1.07 9.0 0.00757 0.388 0.00985 27.1
9 570 0.12 60 75.1 132.0 10.7 2.0 34.7 4.3 0.47 0.72 1.77 13.0 0.00962 0.449 0.00918 21.6
10 310 0.22 60 98.2 122.4 24.4 2.2 34.5 3.9 0.42 0.65 1.57 11.2 0.00814 0.453 0.00986 23.3
11 310 0.12 110 72.6 132.5 16.5 1.7 34.9 4.8 0.45 0.69 2.72 21.4 0.00857 0.445 0.00957 22.9
12 50 0.12 60 67.9 135.3 13.2 2.0 34.7 5.4 0.45 0.69 3.81 28.2 0.00898 0.418 0.00968 21.4
13 310 0.02 60 66.9 114.8 1.76 0.7 36.4 7.6 0.51 0.80 4.00 28.8 0.00738 0.393 0.00932 25.4
14 310 0.12 10 61.4 134.7 16.7 2.0 34.4 3.4 0.47 0.71 1.13 9.4 0.00847 0.476 0.00981 23.3
15 310 0.12 60 77.5 131.8 12.3 1.8 35.9 4.6 0.44 0.69 3.79 28.1 0.00870 0.452 0.00894 22.5
16 310 0.12 60 68.1 134.1 16.0 1.3 35.6 3.5 0.44 0.69 1.23 9.6 0.00829 0.506 0.00882 24.1
17 310 0.12 60 74.5 132.1 12.8 2.5 36.9 4.7 0.44 0.69 1.91 8.7 0.00907 0.481 0.00952 22.9
18 310 0.12 60 61.8 134.4 14.9 2.7 36.5 3.5 0.45 0.71 0.64 5.4 0.00857 0.472 0.00927 22.6
19 310 0.12 60 71.3 130.3 13.0 2.2 36.5 3.5 0.44 0.69 1.09 7.7 0.00873 0.474 0.0102 22.9
20 310 0.12 60 76.1 131.3 10.1 3.5 34.9 4.6 0.43 0.66 1.52 11.0 0.00939 0.465 0.00933 22.9
The flow properties data showed no direct correlations with the process parameters used, as the mean flow time (4.3 s) and Carr index (34.7%) described the relationships better than any model. This might not appear surprising, as the process parame- ters had similar influences on the bulk and tapped densities, which resulted in a relatively constant Carr index, as this depends on the ratio between these two densities. Nevertheless, a basic trend was observed for the Carr index and flow time through indirect effects of primary properties, i.e. d50 and PDW. Put very generally, it appears that better flow properties were achieved with larger granules with lower PDW, as these were the conditions where the lowest Carr index was achieved. This observation is also in agreement with literature [7,11,12] and our previous findings during scale-up studies, where again, larger granules had better flow properties.
The Carr index and flow time data were also confirmed with tablet mass variation and crushing strength variation data, both of which being measures of tableting performance mostly connected with the flow properties, as their mean values also described the
relationships with the process parameters better than any model.
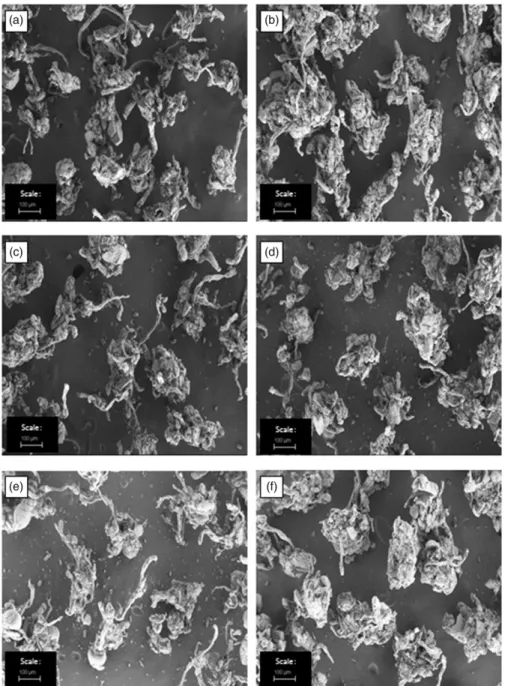
However, the tablet mass and crushing strength variation data fluctuated much more (0.64%–4.00%, 5.4%–28.8%, for mass and crushing strength variations, respectively) and correlated well with each other (R2¼0.924), but not with the flow time and the Carr index. This suggests that the flow time and Carr index are not the only predictors of tableting performance, and that other proper- ties have important roles, such as PDW, granule porosity and morphology (i.e. shape, surface). Thus, the morphology and the intra-granular porosities of selected samples were investigated using scanning electron microscopy and micro-computer tomog- raphy scanning analysis, the latter technique not being used in this context in other reported studies. Six samples were carefully selected based on the extreme values of the process parameters used and the response variables by which the abovementioned differences might be explained. Images for these selected samples 6, 7, 11, 12, 13, and 15 are shown in Figures 6 and 7, and their intragranular porosities were 5.99%, 6.94%, 6.84%, 7.60%, 7.41%, and 6.61%, respectively. The intragranular porosity affects the flow
Figure 6. Scanning electron micrographs (particle size fraction of 180–250mm), for granule samples 6 (a), 7 (b), 11 (c), 12 (d), 13 (e), and 15 (f). Scale bars, 100mm.