BUDAPEST WORKING PAPERS ON THE LABOUR MARKET
BWP – 2018/5
Educational policies and the gender gap in test scores:
A cross-country analysis
ZOLTÁN HERMANN - MARIANNA KOPASZ
BWP 2018/5
INSTITUTE OF ECONOMICS, CENTRE FOR ECONOMIC AND REGIONAL STUDIES HUNGARIAN ACADEMY OF SCIENCES
BUDAPEST, 2018
2
Budapest Working Papers on the Labour Market BWP – 2018/5
Institute of Economics, Centre for Economic and Regional Studies, Hungarian Academy of Sciences
Educational policies and the gender gap in test scores: A cross-country analysis
Authors:
Zoltán Hermann research fellow Institute of Economics
Centre for Economic and Regional Studies, Hungarian Academy of Sciences and Corvinus University of Budapest
email: hermann.zoltan@krtk.mta.hu
Marianna Kopasz research fellow
Institute for Political Science
Centre for Social Sciences, Hungarian Academy of Sciences email: kopasz.marianna@tk.mta.hu
November 2018
3
Educational policies and the gender gap in test scores:
A cross-country analysis
Zoltán Hermann - Marianna Kopasz Abstract
Girls tend to outperform boys in reading tests, while they usually lag behind boys in math. However, the size of the gender gap varies to a great extent between countries.
While the existing literature explains these differences as being mainly due to cultural factors, this paper explores whether this cross-country variation is related to educational policies like tracking, grade retention, and individualised teaching practices. The gender test score gap is analysed in math, reading and science using the PISA 2012 dataset.
Multilevel models are used in the estimation. The results suggest that the extent of the gender gap is indeed associated with certain characteristics of the various education systems. First, applying a difference-in-differences estimation method, it was found that early tracking has a direct effect on the gender gap in test scores, in favour of girls.
Second, suggestive evidence shows that more student-oriented teaching practices also benefit girls relative to boys, both between and within countries, and within schools.
Finally, grade retention is correlated with the gender gap, though there is further evidence suggesting that this correlation is very unlikely to represent a causal effect.
JEL codes: I21, J24
Keywords: Gender stratification, tracking, grade retention, teaching practice, PISA, multilevel model, difference-in-differences
Acknowledgement:
The project leading to this application has received funding from the European Union's Horizon 2020 research and innovation programme under grant agreement No. 691676 and from the Hungarian National Research Development and Innovation Grant under Grant number K109338.
4
Az oktatási intézményrendszer és a nemek szerinti tesztpontszám-különbségek nemzetközi
összehasonlításban
Hermann Zoltán - Kopasz Marianna
Összefoglaló
A szövegértés teszteken a lányok átlagosan jobb eredményt érnek el a fiúknál, matematikából viszont rendszerint gyengébben teljesítenek. Ugyanakkor a nemek közötti különbségek mértéke országonként nagyon változó. Míg az irodalom főként kulturális különbségekkel magyarázza ezeket az eltéréseket, ez a tanulmány az oktatási intézményrendszer olyan jellemzőinek hatását vizsgálja, mint az iskolatípusok közötti korai szelekció, az évismétlés elterjedtsége és a diák-orientált pedagógiai módszerek alkalmazása. A nemek közötti különbségeket a szövegértés, matematika és természettudomány terén vizsgáljuk, a 2012-es PISA adatbázis adatain.
Az elemzés többszintű modellekre épül. Az eredmények azt mutatják, hogy a nemek közötti különbségek összefüggenek az oktatási rendszer jellemzőivel. Először, a különbségek különbsége módszerét alkalmazó elemzés azt mutatja, hogy az iskolatípusok közötti korai szelekció közvetlen hatása a lányok számára kedvező. Másodszor, az eredmények arra utalnak, hogy a diák-orientált tanítási gyakorlat is relative kedvezhet a lányoknak. Végül, az évismétlés gyakoriság alkalmazása a fiúk relatív előnyével jár együtt, de a részletesebb elemzések arra utalnak, hogy ebben az esetben nem oksági hatásról van szó.
JEL: I21, J24
Kulcsszavak: nemek közötti különbségek, iskolatípusok közötti korai szelekció, évismétlés, pedagógiai gyakorlat, PISA, többszintű modell, különbségek különbsége
5 1. INTRODUCTION
Gender differences in educational achievement are a well-known phenomenon. In most countries, boys score higher in mathematics tests, while girls tend to do better in reading. This is a concern for policy-makers since, in spite of the increase in higher education enrolment, girls are still heavily underrepresented in STEM (Science, Technology, Engineering and Mathematics) fields (see, e.g. OECD 2015). At the same time, in recent decades, girls have been closing the test score gap in subjects traditionally favouring boys, like mathematics and science, while extending their advantage in reading literacy (Marks 2008; Baye and Monseur 2016). In recent decades female educational attainment has also risen rapidly, and in most of the developed countries more women than men obtain a higher education degree. These trends are often regarded as a symptom of the so-called ‘boy crisis’. The widening gender gap in educational attainment in the era of labour market polarization can lead to increasing inequalities and decreasing labour market participation among men (Pekkarinen 2012). Nevertheless, research on the test score gap still focuses mainly on girls’ disadvantage in mathematics (Stoet and Geary 2015).
It is also well documented that the gender test score gap varies remarkably between countries (Schnepf 2004; Marks 2008; Fryer and Levitt 2010). In some countries, girls lag behind boys in math by a considerable margin, while in others they are on average at par. Similarly, in some cases, girls outdistance boys in reading to a considerable degree, while at the other extreme, only a narrow gap can be observed. The comparative gender gap research seeking explanations for these differences almost exclusively focuses on the role of cultural factors, social norms and female participation in the labour market and politics (see, e.g. Penner 2008; Guiso et al. 2008; Else-Quest et al. 2010). Cross-country differences in the gender gap are for the most part linked to gender inequalities in society and, to a lesser extent, to gender role attitudes and beliefs. Studies in the former line of research are often based on the gender stratification hypothesis, first proposed by Baker and Jones (1993). They mostly focus on the cross-country differences in women’s social participation, such as participation in education, the labour market or politics. This thread of research assumes that women’s lower rates of participation in education and the labour market (e.g. Baker and Jones 1993; Penner 2008), lower participation in politics (e.g. Guiso et al. 2008, Else-Quest et al. 2010) produce a gender stratification in which women are assigned lower status. This shapes the behaviour of students, parents and teachers (Baker and Jones 1993; Else-Quest et al. 2010; Riegl-Crumb 2005). If
6
female students are faced with fewer educational and occupational opportunities than male students, then they may see mathematics as less important for their future and be reinforced in this belief by parents, teachers and friends. (Baker and Jones 1993).
However, the existing evidence is mixed. Some studies conclude that there is a link between gender inequality measures (e.g. women’s participation in politics, the labour market, etc., or composite indicators of gender inequality) and the gender test score gap (e.g. Riegl-Crumb 2005; Else-Quest et al. 2010; Guiso et al. 2008; González de San Román and De la Rica Goiricelaya 2012). Others challenge this conclusion (Fryer and Lewitt 2010; Stoet and Geary 2015).
At the same time, it seems obvious that schools play a decisive role in mediating the effects of societal and cultural factors. Indirect evidence also suggests that schools indeed affect the gender gap in achievement. The gender gap in mathematics abilities opens up after children enter school (Fryer and Levitt 2010), and in school this gap increases with age (i.e. from primary school to secondary school) both in reading, mathematics and science (Baye and Monseur 2016). Moreover, schooling seems to have heterogeneous effects across gender. Boys appear to benefit more from higher school quality (Autor et al. 2016) and perceived teacher quality (Hochweber and Vieluf 2018) than girls.
As the gender gap seems to be formed in schools, it is natural to assume that the specific characteristics of various education systems affect the cross-country differences in the gender gap (Ayalon and Livneh 2013). Prior research shows that the gender gaps in reading and mathematics are highly correlated at the country level (van Langen et al.
2006; Guiso et al. 2008; Marks 2008; González de San Román and De la Rica Goiricelaya 2012). In other words, where girls have a larger advantage in reading over boys, they also tend to have a smaller disadvantage in mathematics. This suggests that cross-country differences in the gender gap are not determined by educational policies specific to a given subject (i.e. the curriculum in math) (Marks 2008), but rather, that broader educational institutions and policies are at work.
However, the effect of national educational policies has hardly been addressed in the literature, and the few existing studies focus on the homogeneity of school systems.
Higher degrees of standardization and integration in the education system were found to be associated with a higher relative performance by girls (Ayalon and Livneh 2013; Van Langen et al. 2006). At the same time, early tracking seems to benefit boys (Van Hek 2017). Altogether, prior evidence is scarce, and confined to a limited set of educational institutions.
7
This study seeks to contribute to filling this void by analysing the relationship between educational policies and gender differences in educational performance from a cross-country perspective. More specifically, the focus is on three policies: early tracking, the extensive use of grade retention, and the incidence of individualised teaching practices. These are very different features, but all of these are among the key educational policies that education systems use to manage the heterogeneity of the student population (Mons 2004; 2007). In this respect these policies have similar functions. We ask whether, and if so, how these educational policies affect the gender gap in mathematics, reading, and science test scores.
This question is addressed using a two-stage empirical strategy. First, the association between the gender gap and the educational policies is explored. In this stage, multilevel regression models are employed including all three educational policy variables at the same time. Second further evidence on the effect of each policy variable separately is provided. The effect of grade retention is tested indirectly, by comparing its effects in different parts of the performance distribution. For early tracking, its direct effect is identified using a difference-in-differences strategy. Finally, suggestive evidence is offered concerning the effects of individualised teaching relying on within-country and within-school variation in teaching practices.
In this paper, data from the 2012 wave of OECD’s PISA programme is used. For the analysis of early tracking, these are supplemented by the IEA’s PIRLS and TIMSS data from 2006 and 2007. PISA provides data on students’ test scores in mathematics, reading, and science for more than sixty countries, including all OECD member countries. Here, data for a single cross-section are used, as the cross-country patterns of the gender gap hardly change over time.
The contribution made here to the literature is threefold. First, the evidence on the relationship between educational policies and gender differences in student achievement is scarce. This study explores the effects of three educational policies. Two of these, grade retention and teaching practice, have not been analysed in this context before. Second, most of the evidence on cross-country differences in the gender gap is descriptive, confined to correlations. In this paper, the causal effect of early tracking is identified, and suggestive evidence provided in the case of the other two policy variables. Third, despite the fact that the disadvantage of boys in reading is a growing concern, the vast majority of the gender gap literature focuses on mathematics only. In contrast, this paper covers three fields of competence. Analysing mathematics, science and reading within one study, it is possible to shed light on which policies favour boys or girls, and in which field of competence.
8
The remainder of the paper is structured as follows. In the next section, the context of the research is outlined and a review provided of previous research investigating the effects of educational policies on gender differences. Section 3 describes the data and the estimation methods used. In Section 4 the results are presented. Finally, Section 5 draws conclusions.
2. THEORETICAL BACKGROUND AND RELATED LITERATURE
Prior evidence suggests that the cross-country differences of the gender test score gap are related to the characteristics of educational systems. However, this literature looked at only a few educational institutions. Van Langen et al. (2006) examine the degree of integration for the educational systems (measured by such factors as grade and track differentiation, number of tracks, socioeconomic, gender and immigrant segregation, and quality differences) in relation to the gender gap. Integrated educational systems are found to be more favourable to the achievement of girls (in mathematics, science and reading) than differentiated ones.
Ayalon and Livneh (2013) address the gender effects of educational standardization.
They report a significant level of association between the degree of standardization and gender difference in mathematics test scores. According to this, a higher degree of standardization (i.e. the use of national examinations and the higher uniformity in time devoted to various mathematics topics) is linked to a reduced gender gap in mathematics test scores. An apparently different conclusion is reached for reading performance by Van Hek (2017). She demonstrates that a higher degree of standardization is associated with a larger gender gap (favouring girls) in reading achievement. However, boys outperform girls in mathematics, while lagging behind in reading. Hence, both studies suggest that standardization provides relative benefits for girls.
Van Hek (2017) also explored the relationship between the gender achievement gap and early tracking in the cross-country context. She found that the gender gap in reading scores is smaller in countries that track students at an early age, i.e. early tracking provides relative benefits to boys.
These studies are motivated by the research into the effect of educational institutions on inequality of opportunity. This thread in the literature asks how educational institutions shape the effect of family background on students’ educational achievement.
In international comparison, the key question is why some countries are more successful in offsetting socio-economic inequalities and ensuring greater equality of opportunity in schools than others. Early tracking and standardization are key themes in this literature
9
(van de Werhofst 2015; Hanushek and Woessmann 2010). It is natural to ask whether the mechanisms behind educational policies affecting socioeconomic inequalities in achievement also affect gender inequality.
This paper seeks to contribute to the literature on the cross-country differences in the gender test score gap by exploring the effect of other educational policies. The analysis is informed by the theoretical framework elaborated by Mons (2004; 2007, see also Dupriez et al. 2008); she starts from the observation that in response to students’ diverse abilities, school systems use different policies to manage heterogeneity in the student population. She identifies four key educational policies developed to deal with student heterogeneity: tracking, ability grouping, grade retention, and individualised teaching practices. Tracking and ability grouping allow for student sorting based on ability and motivation, resulting in more homogeneous classes. In theory, this leaves room for adjusting the level and content of education to fit students’ needs better. Grade retention decreases heterogeneity within classes by holding back students who cannot meet minimum achievement standards. Finally, the use of individualised teaching practices implies allocating additional teacher time and attention to help low-achievers. Mons argues that though the countries studied rely on a mix of these measures, one of them tended to become predominant in most cases. Based on the particular policy mix implemented in a given country, Mons (2004; 2007) and Janmaat and Mons (2011) distinguish between four models of heterogeneity management. Selective school systems use early tracking, while comprehensive school systems rely on either ability grouping within and across schools or frequent grade retention or individualised teaching practices to deal with student heterogeneity.
The first model, the ‘separation model’, is characterized by a short common core curriculum and the introduction of separate tracks from the end of primary school.
Students are placed on tracks mainly on the basis of their educational achievement.
Ability grouping and frequent use of grade retention are also important characteristics of this model. This type of school system can be observed in central European countries (Austria, Germany, Hungary, and Switzerland).
The ‘individualised integration model’ is the archetype of the comprehensive school concept. It has the following characteristics: a long common curriculum, automatic promotion of students, heterogeneous classrooms and use of individualised teaching.
This model is adopted by the Nordic countries (Denmark, Finland, Iceland, Norway, and Sweden).
Another model of the comprehensive school system is the so-called ‘à la carte integration model’. Its features are a long common curriculum, automatic promotion, or a low rate of grade retention, a flexible ability grouping in secondary schools, and
10
individualised teaching. This model can be found in Canada, New Zealand, the United Kingdom and the United States.
The last model of the comprehensive school system is the so-called ‘uniform integration model’. This refers to an educational system with a long common core curriculum, a high incidence of grade retention and ability grouping from lower secondary schools. The countries belonging to this model are France, Italy, Portugal, and Spain.
A very similar approach is taken by two subsequent reports by the OECD (2010, 2013b). The OECD uses the terms vertical and horizontal differentiation. (The 2013 report uses the term ’stratification’ instead of differentiation, though with a similar meaning.) Vertical differentiation refers to how students progress through the education system as they get older. In some countries, all 15-year old students attend the same grade level, while in other countries they are dispersed throughout various grade levels as a result of policies affecting the school entrance age or grade retention. Horizontal differentiation refers to the differences in instruction within a grade or education level.
At the system level, horizontal differentiation can be applied by schools that select students on the basis of their academic records, by offering specific programs (e.g.
vocational and academic). At the school level, individual schools can apply horizontal differentiation by grouping students according to ability or transferring student out of the school.
Though these policies have similar functions, the empirical evidence suggest that they are not equally effective. There are large differences in equality of opportunity across countries (Schütz et al. 2008) and also across the types identified by Mons (Dupriez et al. 2008; Castejon and Zancajo 2015).
Seeking to explain cross-country differences in the gender gap the effects of these policies on the gender gap are explored. Only three of the four policies are investigated, ignoring ability grouping, as no reliable and comparable measure is available on that at the country level. Prior research lends support to the assumption that these policies may matter, as it suggests that boys and girls are affected differently by these policies.
The effect of grade retention on student achievement at the individual level is often hotly debated. The empirical evidence is mixed and fairly controversial. The general conclusion is that grade retention has either no effect or has a negative impact on student performance (Jimerson et al. 2002; Jimerson et al. 2006; Martin 2009; Manacorda 2012). At the student level, grade retention effect is most often found not to differ by gender (Martin 2009; Ikeda and Garcia 2014). In contrast, Morrison and No (2007) report a more detrimental impact on boys. At the same time, it is often observed that
11
boys stand a higher risk of repeating a grade than girls (Jimerson et al. 2006; Martin, 2009). This implies that if repeating a grade has a direct effect on student achievement, boys are affected to a greater extent by grade retention policies overall, due to their higher exposure to this policy.
A similar argument holds for early tracking. The empirical evidence largely confirms that early tracking strengthens the influence of parental background on students’
educational achievement, as tracking has a detrimental effect on low-achievers (Hanushek and Wößmann 2006; Schütz et al. 2008; Bol and Van de Werfhorst 2013;
Lavrijsen and Nicaise 2015). At the same time, in tracking regimes boys tend to be more often placed in lower tracks, resulting in a lower enrolment share in the vocational tracks among girls (Van Hek, 2017). This implies that altogether the differences in educational quality across tracks affect boys more than girls.
Some direct evidence on the effect of early tracking on the gender gap is also available. Pekkarinen (2008), analysing the effect of a Finnish comprehensive school reform of the 1970s, reports that the shift from a selective school system to a comprehensive one had a positive effect on girls' probability of choosing the academic track later, whereas this effect was slightly negative for boys. These findings suggest that postponing tracking favours girls.
With regard to teaching practices, the empirical literature most often contrasts two types: lecture-style teaching and teaching based on problem-solving. The former is often associated with more traditional, didactic teacher-centred teaching styles, while the letter is associated with more modern, interactive, student-oriented teaching styles (Schwerdt and Wuppermann 2010). The latter can be conceived as similar to individualised teaching in the terminology of Mons (2007). The existing evidence on the impact of teaching practices on student achievement is mixed. Based on data for the U.S., Brewer and Goldhaber (1997) and Schwerdt and Wuppermann (2011) find that teaching based on in-class problem solving (as opposed to lecture-style teaching) is associated with lower student achievement. Analysing Spanish data, Hidalgo-Cabrillana and Lopez-Mayan (2015) conclude that modern teaching practices are associated with better student performance, especially in reading, while traditional practices if anything, are disadvantageous. These effects differ according to gender: girls gain from modern practices and lose from traditional ones, while boys do not benefit from any particular teaching style. Korbel and Paulus (2017) investigated the effect of teaching practices on non-cognitive skills using Czech data and found that the effects are different by gender.
Overall, the evidence suggests that these policies may have an impact on the gender gap.
12
In the remainder of this section, previous work on the effects of early tracking and grade retention is reviewed in more detail, with special attention to results on the links between educational policies and the socioeconomic inequalities of student performance.
We assume that the mechanisms that produce the effects of educational policies on socioeconomic inequality in achievement also affect gender inequality.
The age at which students choose between different tracks varies between countries.
In general, in comprehensive school systems, students attend the same schools throughout lower secondary school, while in selective school systems they have already been sorted into different (academic or vocational) tracks at this stage.
Of the educational policies examined here, it is tracking that has been the most extensively studied. In the related literature, some studies look at its effect on the inequality of student performance (inequality as dispersion); while other studies assess its effect on the inequality of opportunity (the extent to which performance is influenced by the family background). In the first line of research, employing differences-in- differences estimations, Hanushek and Wößmann (2006) demonstrate that early tracking leads to an increase in inequality of student performance between the end of primary and the end of lower-secondary school.
The other line of the early tracking research focuses on the effect of tracking on equality of opportunity. There are good reasons for assuming that early selection increases the effect of family background on educational attainment. Children with a disadvantaged background are more likely to end up in lower tracks, where education quality is lower, and the learning environment is generally less stimulating, for several reasons. Tracking systems often sorts students on the basis of previous performance. As the gap in abilities and school performance across socioeconomic groups appear at early ages (Cunha et al. 2006), track sorting is likely to correlate with family background.
Further, the educational ambitions of pupils are influenced by the role models they encounter in their surroundings; children of parents of low socioeconomic status tend to have more modest aspirations than those of parents of high socioeconomic status (Breen and Goldthorpe 1997). When track choice is made in early grades, family background has a stronger effect on it (Brunello and Checchi 2007).
The empirical evidence largely confirms that early tracking strengthens the influence of parental background on students’ educational achievement (e.g. Schütz et al. 2008;
Horn 2009; Bol and Van de Werfhorst 2013). However, these cross-sectional studies suffer from the weakness that many other factors may influence the effect of social background on educational performance as well. Ammermüller (2005) and Waldinger (2007) employed a difference-in-differences strategy, combining achievement data for 10-11 and 15 years old students, to identify the effect of early tracking on equality of
13
opportunity in a cross-country context. Ammermüller (2005) found that the effect of students’ social origin on reading performance increased (between primary and secondary school) more in countries that track students at an early age. In contrast to this finding, Waldinger (2007) reports that though the family background is more important in early tracking countries, tracking does not increase its effect on test scores.
Recently, Lavrijsen and Nicaise (2015), using the same estimation strategy on a larger sample of countries, found that the effect of social origin on reading outcome in secondary school is stronger in countries that are characterized by early tracking.
In summary, the evidence indicates that early tracking is associated with an increase in inequality of student achievement and inequality of opportunity.
The desirability of grade retention is a highly debated issue (see, e.g. Belot and Vandenberghe 2011; Manacorda 2012). Some countries practise automatic grade promotion (i.e. a system which allows pupils to be promoted to higher grades independently of their performance), while other countries use grade retention.
Opponents of grade retention emphasize that repeating a grade does not lead to improvement in students’ academic achievement (McCoy and Reynolds 2003), while increases the probability of dropping out of school (Jimerson et al. 2002). At the same time, proponents of grade retention argue that it might improve educational achievement by reinforcing a student’s knowledge. Also, grade repetition might help make classes more homogeneous.
Although the strongest argument in favour of grade repetition is that it may be a deterrent to low educational performance (Manacorda 2012), the empirical literature on grade repetition focuses almost exclusively on its ex-post (i.e. treatment) effects on grade repeaters (Belot and Vandenberghe 2011; Foureaux Koppensteiner 2013). The results from this line of research are contradictory and depend on the context and age of students (see, e.g. Foureaux Koppensteiner 2013).
The threat (i.e. ex-ante) effects of grade repetition policies have received little attention so far. The few exceptions include studies by Belot and Vandenberghe (2011), Battistin and Schizzerotto (2012), and Foureaux Koppensteiner 2013. Again, the results are mixed, with positive as well as negative (or no) effects of the threat of grade repetition on educational performance.
Cross-country studies related to the effects of grade retention are very rare. Based on analyses of data from PISA 2009 and 2012, OECD reports (2011; 2013b) suggest that school systems with high rates of grade retention are also school systems that show lower student achievement. These reports go one step further, analysing the association between the incidence of grade retention and the effect of students’ social background on
14
educational outcome. Findings show that in countries with a higher proportion of retained students, social background has a stronger impact on educational outcomes than in countries where fewer students repeat grades – even after accounting for the country’s national income (OECD 2011; 2013b).
3. DATA AND METHODS
3.1. DATA
The primary dataset used in this paper is the 2012 wave of the OECD Programme for International Student Assessment (PISA). PISA is a survey of 15-year-old students in which skills in different domains are assessed: mathematics, literacy and science, with the major focus on mathematical literacy in 2012. PISA 2012 was implemented in 65 countries, including all 34 OECD member countries. We use a single wave of PISA, as the cross-country patterns of the gender gap hardly change over time. Moreover, measures of teaching practices in math are available only for 2012.
Our final sample contains 472,074 students from 62 countries. Cyprus is not included in the available data set, while Lichtenstein is excluded due to the small number of observations. Furthermore, Taiwan is also excluded as the Global Gender Gap Index is not available.
Besides the PISA data, student achievement data from the Progress in International Reading Literacy Study (PIRLS) and the Trends in International Mathematics and Science Study (TIMSS) datasets are used in Section 5.2. PIRLS and TIMSS are standardised student achievement testing programmes similar to PISA carried out by the International Association for the Evaluation of Educational Achievement (IEA). PIRLS tests students at grade four in reading, and TIMSS tests students in mathematics and science.
3.2. VARIABLES
The dependent variables in the analysis are math, reading and science test scores, standardized within each country, so that the mean is 0, and standard deviation is 1. In this way any differences in the overall level of performance between countries are removed from the data and the gender differences are directly comparable across countries.
The key variables describe educational policies at the country level. Tracking is measured as the age at which students are first tracked into different school types. Data
15
on the age of first selection are gathered from the OECD (2013b). The tracking variable is truncated at the age of 15, since it is assumed that achievement measured at this age is not affected by tracking that occurs later.
Data on grade retention were gathered from the PISA student questionnaire. The country-level variable is measured as the share of students who have repeated a grade at least once at either the primary or secondary level. In the regressions, the natural logarithm of this variable is used, as it fits the data better.
To measure individualised teaching the index student-orientated teaching practices developed by the OECD (2013a) is used. This index was constructed using students’
reports on the frequency with which, in mathematics lessons, the teacher gives different work to classmates who have difficulties learning and/or to those who can advance faster; the teacher assigns projects that require at least one week to complete; the teacher has students work in small groups to come up with a joint solution to a problem or task;
and the teacher asks students to help plan classroom activities or topics (OECD 2013a).
Higher values of the index indicate the more intensive use of student orientated practices. It should be noted that, though measuring teacher classroom behaviour based on students’ responses may contain considerable measurement error, student-reported measures are more closely related to student achievement than those reported by teachers (Hidalgo-Cabrillana and Lopez-Mayan 2015). The questions on teaching practices in PISA 2012 refer to mathematics lessons only. This measure is used as a proxy for teaching practices in general at the country level, assuming a strong correlation between subjects. In other words, it is assumed that teaching practices reflect a general pedagogical approach and teaching culture rather than subject-specific methodological differences at the country level. At the same time, when comparing schools within countries this correlation cannot be presumed; hence, the effect of teaching practices across and within schools is analyzed only in the case of mathematics.
In the analysis gender stratification is controlled for by the use of one composite index of gender inequality: the Global Gender Gap Index (GGI), prepared by the World Economic Forum (2009 data). This index is widely used in the literature (Guiso et al.
2008; Fryer and Levitt 2010) and available to most of the PISA countries. The GGI is comprised of four sub-indices which measure economic participation and opportunity, educational attainment, political empowerment, health, and survival. Larger GGI values indicate a better position of women in society. Other composite indicators are also available, however, a meta-analysis by Else-Quest et al. (2010) concludes that, along with the Gender Empowerment Measure (GEM), the GGI proved to be the best predictor of the gender gap in mathematics on PISA. As the practice has been in previous studies, per
16
capita GDP (logarithmic form) is also a control. GDP data as reported by the World Bank for 2011 are used.
In the estimated models two student characteristics are controlled for: immigrant background and parental education.
Summary statistics for the key country-level variables are displayed in Table 1. It should be noted that all the educational policy variables display a significant degree of variation from country to country.
Table 1 Descriptive statistics of country-level variables
N minimum maximum mean standard deviation Gender gap
(male-female)
Math gender gap (PISA) 62 -0.282 0.365 0.092 0.123 Reading gender gap (PISA) 62 -0.862 -0.136 -0.444 0.142 Science gender gap (PISA) 62 -0.548 0.245 -0.029 0.134 Math gender gap (TIMSS) 27 -0.270 0.213 0.037 0.123 Reading gender gap
(PIRLS)
30 -0.420 -0.054 -0.209 0.093
Science gender gap (TIMSS)
27 -0.252 0.196 0.016 0.122
Educational policy variables
Tracking age 62 10 15 14.178 1.499
Grade retention (log) 62 -0.693 3.717 2.046 1.184 Individualised teaching 62 -0.579 1.081 0.205 0.397 Country-level controls
Gender Gap Index 62 0.400 0.828 0.696 0.069
GDP per capita (log) 62 8.459 11.794 10.192 0.654 Note: Variables derived from PIRLS and TIMSS are calculated for PISA countries only.
Besides the variables used in the analysis, Table 1 also presents country-level measures of the gender gap in the three subjects. The gender gap is calculated as the weighted mean score of males minus the weighted mean score of females.
In reading, boys lag behind girls in each country by a considerable margin; the gap typically falls between standard deviations (SD) of -0.1 and -0.9. At the same time, in
17
most countries, on average, boys outperform girls in mathematics. However, the difference tends to be smaller; while in a few countries girls are on a par with or better than boys. In the case of science the picture is mixed, with boys in some countries performing better, while in others, girls excel. The gap typically varies between -0.5 and 0.2 SD. It is important to note that the gender gaps in the three domains correlate strongly at the country level. In countries where girls have a large advantage in reading, they also tend to close the gap in mathematics and perform better than boys in science (Marks 2008).
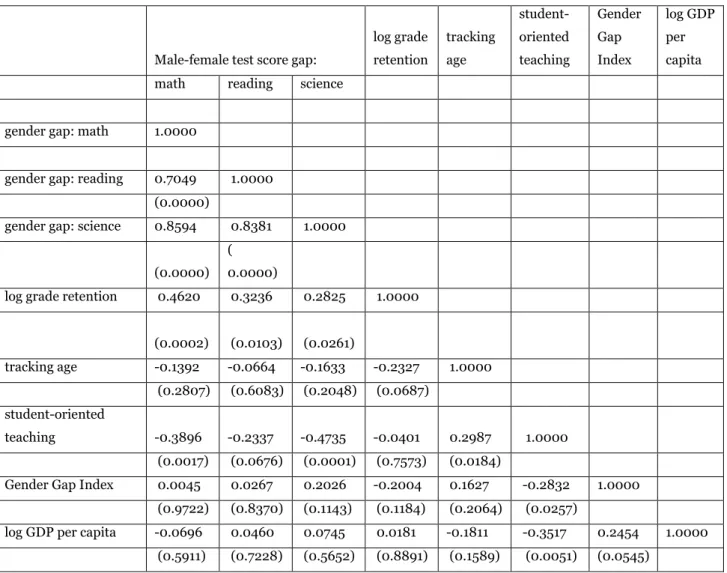
Table A1 in the Appendix gives descriptive statistics on the gender gap between countries and subjects. Figure A1 in the Appendix depicts the correlations of the gender gaps in the three domains.
3.3. ESTIMATION METHODS
We explore the effects of educational policies on the gender gap using multilevel regression models. These models are similar to those used in the existing literature to estimate the effect of standardization and early tracking (Ayalon-Livneh 2013; Van Hek 2017). Our baseline model contains two levels, the individual and the country level:
(1)
where A is the test score of student i in country j, X is a set of M individual student characteristics, including the dummy variable F denoting female students and Z is the set of L country-level variables, including the three educational policy measures mentioned above and country-level controls. The β parameters correspond to the first level of the model, while the γ0l and γ1l coefficients represent the country-level effects. The µ and ε parameters represent the random part of the model, µ1j denoting the random gender slope in country j.
The key parameters are the γ1l coefficients representing the effects of the female student – education policy interaction terms. These coefficients indicate whether the presence of an educational policy on average goes together with an additional (dis)advantage to girls relative to boys, compared to countries where this policy is used to a lesser extent.
In the second stage of the analysis, further evidence is provided on the effects of the three education policy variables separately, extending the model in different directions.
Unfortunately, the available data does not often allow for proper identification of causal
18
effects in a country-level analysis. Hence various empirical strategies were employed.
First, an indirect implication of grade retention effects was tested by re-estimating the baseline model and comparing the results for subsamples of students over different parts of the performance distribution. Grade retention might be expected to have a direct effect only on low achievers, implying different correlations across the distribution. The direct effect of early tracking is then analysed employing a difference-in-differences strategy, augmenting the dataset with 4th graders and adding further interaction terms to the baseline model. Here the question of whether the gender achievement gap develops differently between grade 4 and age 15 in tracking and non-tracking countries is tested.
Finally, suggestive evidence is provided concerning the effect of individualised teaching exploiting the variation between and within schools. Here a three-level model is employed, extending the baseline model with a school level. The exact model specifications are described at the beginning of each section.
It should be noted that only the difference-in-differences analysis of the tracking effect can be considered as a causal identification strategy per se. In the other cases, suggestive evidence is provided that is non-causal, but none the less helps to assess the effects of educational policies on the gender gap.
The models are estimated using the weights provided in the PISA data. In the two- level models, the final student weights are used, while in the three-level model, schools are weighted by the school weights and students within schools by conditional student weights. The final student weights and the school weights are rescaled to give an equal sum for each country.
In order to take into account the fact that key variables are measured at the country level, robust standard errors are calculated and clustered at the country level.
4. RESULTS
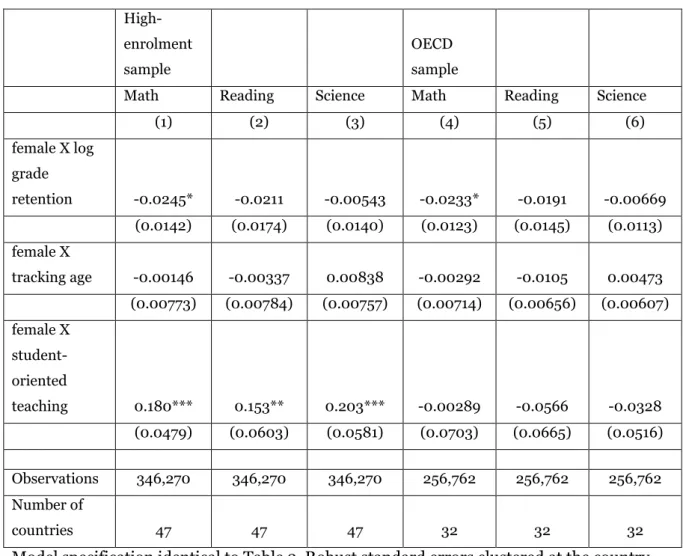
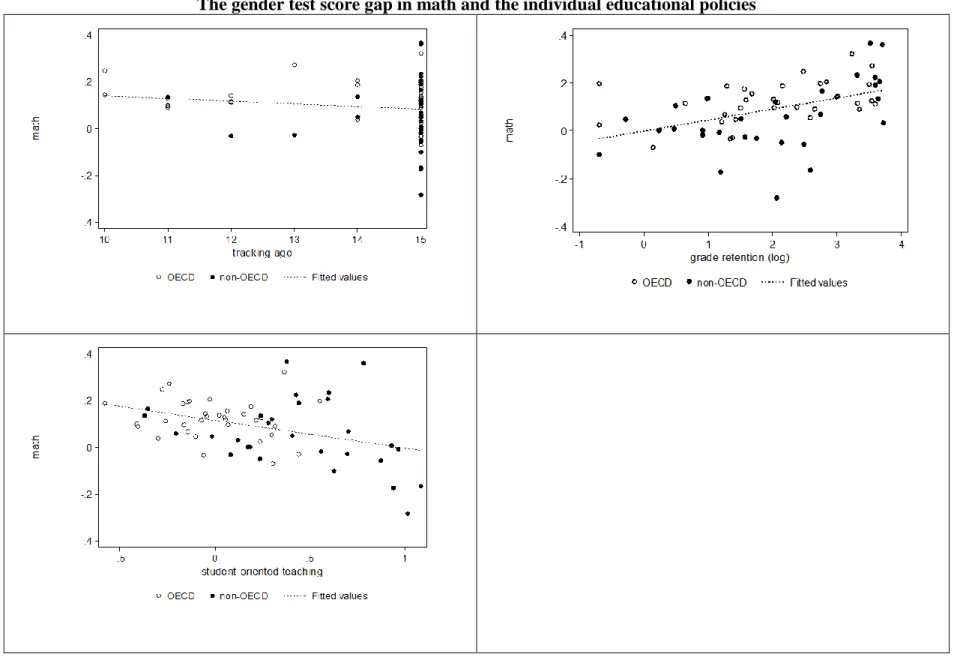
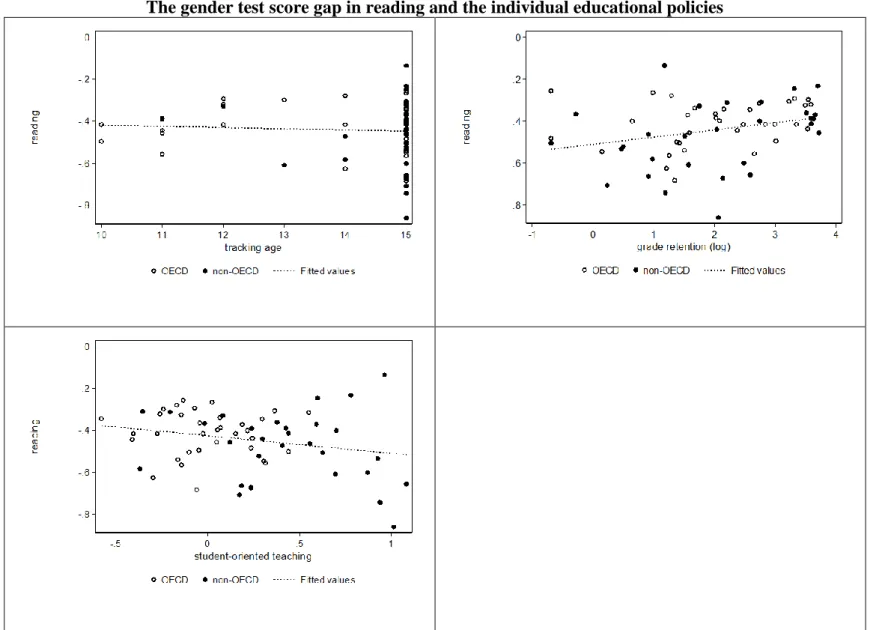
Before turning to the results of the multilevel models, country-level bivariate correlations between the gender achievement gap and our three educational policy measures are presented. Figures A2 to A4 in the Appendix are scatter plots showing the relationships between the gender test score gap in each subject (mathematics, reading, and science) and the educational policies (tracking, grade retention, and individualised teaching), while table A2 shows the pairwise correlation coefficients. The results suggest a positive correlation between the gender gap and grade retention and a negative correlation with individualised teaching. Regarding tracking age, no association could be found in math and reading and only a weak negative correlation in science. The figures suggest a linear
19
relationship with individualised teaching and grade retention, the latter measured on a log scale.
4.1 BASELINE MODEL
Table 2 presents the results of the base multilevel model. As between-country gender inequality is represented by the variation of the gender slope, the key parameters of interest are the interaction terms of gender and the education policy variables.
The results suggest that grade retention has the most consistent correlation with the gender gap. The share of students who have repeated a grade is statistically significant for all three subjects. The negative coefficients indicate that a higher rate of grade retention tends to be favourable to boys. In other words, on average, girls perform better relative to boys in countries where grade retention is less prevalent. This implies that a strict grade retention policy goes together with a larger gender gap in math, as on average boys outperform girls in math in most countries, and with a smaller gap in reading.
Individualised teaching also seems to matter. It is significantly associated with the gender gap in math and science, and it is marginally insignificant for reading (p=0.103).
These results suggest that the widespread use of student-oriented teaching practices conveys more benefits to girls, especially in math and science.
As opposed to grade retention and individualised teaching, tracking age appears to have no effect on the gender slope in the baseline model presented here. The coefficients are highly nonsignificant for each subject. These results seem to contradict the findings of Van Hek (2017), who reports a positive effect of the tracking age on the gender slope in reading. However, she estimated this positive effect in a three-level model including schools as a separate level and, thus, controlling for sorting across schools. In that setting, the positive effect is conditional on sorting. In contrast, the two-level model here represents the unconditional association. It is to be noted that schools play an important mediating role, as sorting is part of the mechanism behind the tracking effect (Skopek and Dronkers 2015). Hence, in order to estimate the total effect, sorting across schools should not be controlled for.
How large is the estimated effect of individualised teaching and grade retention?
In order to assess effect size, it is important to note that the standard deviation of log grade retention at the country level is about three times that of the student-oriented teaching indicator (see Table 1). Taking this into account, the two-to-five times larger coefficients of student-oriented teaching indicate an effect of similar magnitude. In other
20
words, a one standard deviation change of log grade retention and the index of student- oriented teaching implies a similar change in the gender gap.
Finally, the results regarding societal gender equality are mixed. Higher levels of the gender inequality index are related to boys performing relatively better in science than girls, though the coefficient is significant only at the 10 percent level. For math and reading, no sign can be found of the gender equality effect. On the whole, no firm evidence was to be found for an association between gender equality and the gender gap in test scores. This finding is in line with the conclusion reached by Stoet and Geary (2014).
Overall this first set of results suggests that two of the three educational policies are associated with the gender gap at the country level. A higher frequency of grade retention tends to favour boys, while more individualised teaching practices appear to benefit girls relative to boys, especially in the case of mathematics and science. At the same time, early tracking is not associated with the gender gap.
However, it is important to emphasize that these coefficients represent country-level correlations. This is prima facie evidence, which does not necessarily represent causal effects, and thus requires further verification. In the following sections, further evidence is sought for the effects of the three policy variables, using various empirical strategies.
Table 2 Education policies and the gender test score gap: baseline model
math reading science
(1) (2) (3)
student variables
female -0.306 0.623** 0.0718
(0.214) (0.305) (0.248) parental education: lower secondary or below -0.327*** -0.318*** -0.324***
(0.0237) (0.0249) (0.0246)
parental education: tertiary 0.383*** 0.363*** 0.377***
(0.0171) (0.0158) (0.0168)
immigrant background -0.0509 -0.0587 -0.0900
(0.0576) (0.0538) (0.0599) country variables
log grade retention 0.0662*** 0.0590*** 0.0595***
(0.0114) (0.0128) (0.0123)
tracking age 0.00399 0.00502 0.00215
21
(0.00754) (0.00739) (0.00781)
student-oriented teaching -0.0784** -0.0540 -0.0807*
(0.0395) (0.0467) (0.0442)
Gender Gap Index -0.356* -0.345* -0.217
(0.182) (0.190) (0.192)
log GDP per capita -0.0737** -0.0444 -0.0531
(0.0351) (0.0368) (0.0388) cross-level interactions
female X log grade retention -0.0454*** -0.0376** -0.0311**
(0.0121) (0.0149) (0.0132)
female X tracking age -0.00503 -0.00694 0.00103
(0.00692) (0.00710) (0.00683) female X student-oriented teaching 0.152*** 0.0961 0.162***
(0.0401) (0.0589) (0.0483)
female X Gender Gap Index -0.0508 -0.0693 -0.353*
(0.165) (0.242) (0.210)
female X log GDP per capita 0.0389** 0.00382 0.0229
(0.0196) (0.0268) (0.0224)
constant 0.739** 0.169 0.420
(0.377) (0.388) (0.413)
Observations 472,074 472,074 472,074
Number of countries 62 62 62
Robust standard errors clustered at the country-level in parentheses.
*** p<0.01, ** p<0.05, * p<0.1
4.2. GRADE RETENTION
The results of our baseline model suggest that grade retention is closely related to the gender gap. The higher the share of grade repeaters in a country, the better boys perform relative to girls on average. However, it should be pointed out that interpreting this association thus, in causal terms may well be mistaken. To provide further evidence an indirect implication of grade retention effects is tested.
In most cases, students repeating a grade fail to reach a minimum standard. Cross- country differences in grade retention occur as these standards may differ between countries or because performing below standard does not necessarily incur repeating a grade in some countries. In either case, if grade retention has a direct effect on the gender gap (e.g. repeating a grade affects student performance differently by gender, or
22
the threat of it motivates boys more than girls), its effect should be stronger on low- achievers. As high-achievers rarely repeat a grade, they are directly not affected by the retention rate.
This implication was tested by comparing grade retention effects on the gender gap measured in different parts of the test score distribution. The sample within each country was split into three groups with respect to the test score and the baseline model for the low, middle, and high-achiever groups was estimated separately. The set of independent variables in the model remain unchanged.
Table 3 gives the estimated coefficients for the education policy – female student interaction terms. The results show no marked differences across the test score distribution in the association between grade retention and the gender gap. A higher retention rate goes together with the better performance of boys relative to girls both among low- and high-achievers. For math, the estimated coefficients are almost identical in the three groups. For reading and science, the coefficients slightly decrease moving upwards on the achievement scale, but pairwise tests of the equality of the coefficients across the groups reveal no statistically significant differences.
At the same time, the coefficients for early tracking and individualised teaching slightly differ across the three achievement groups. Individualised teaching is associated with a higher advantage for girls in reading in the middle- and high-achiever groups, significant at the 10 percent level. Early tracking seems to benefit boys relative to girls in reading among high-achievers.
Besides comparing the achievement group, an indirect test can be applied in which students with low and higher levels of parental education are compared. The data shows that students with a disadvantaged family background are prone to grade retention to a larger extent. Therefore the argument for low achievers holds here, as well. The results are also similar (Table A3 in the Appendix). The coefficient of grade retention on the gender slope is somewhat larger among poor students, but the difference is statistically not significant.
Consequently, our indirect test does not support the existence of a direct effect;
retention policies per se hardly affect the gender gap. It is more likely that retention policy is correlated with other characteristics of the education systems that influence the gender test score gap, and represents the effects of these unobserved factors in country- level regressions.
23
Table 3 Education policies and the gender test score gap:
low-, middle- and high- achievers
Math Reading Science
(1) (2) (3)
Low-achievers
female X log grade retention -0.0469*** -0.0457*** -0.0370**
(0.0122) (0.0164) (0.0145)
female X tracking age 0.00232 0.00349 0.00860
(0.00780) (0.00913) (0.00848)
female X student-oriented teaching 0.131*** 0.0687 0.130**
(0.0459) (0.0706) (0.0563)
Middle-achievers
female X log grade retention -0.0487*** -0.0387** -0.0358**
(0.0136) (0.0162) (0.0141)
female X tracking age -0.00906 -0.0123 -0.00428
(0.00790) (0.00799) (0.00691)
female X student-oriented teaching 0.167*** 0.116* 0.189***
(0.0424) (0.0617) (0.0504)
High-achievers
female X log grade retention -0.0479*** -0.0344** -0.0280**
(0.0136) (0.0138) (0.0135)
female X tracking age -0.00946 -0.0129** -0.00258
(0.00623) (0.00645) (0.00639)
female X student-oriented teaching 0.140*** 0.0884* 0.153***
(0.0380) (0.0451) (0.0394)
Each panel represents the cross-level interactions from a separate regression estimate. Model specification is identical to that in Table 2. Robust standard errors clustered at the country-level are given in parentheses.
*** p<0.01, ** p<0.05, * p<0.1
4.3. EARLY TRACKING
In this section, we investigate further the correlation between the gender gap and early tracking. The baseline model reveals no significant association here. However, these estimates are prone to omitted variable bias, which may in turn conceal the true effect of early selection.
24
To test the direct effects of early tracking a difference-in-differences approach was employed (see Ammermüller 2005; Waldinger 2006; Lavrijsen and Nicaise 2015). This approach builds on the observation that early tracking should not affect student achievement in primary education, which is untracked in every country. At the same time, other educational institutions can be assumed to shape student performance similarly at the primary and secondary levels. Under this assumption, a difference-in- differences approach identifies the causal effect of early tracking on inequalities. In other words, any changes between the end of the primary level and the end of the lower- secondary level should reflect the effect of early tracking.
Combining PISA data with PIRLS or TIMSS datasets measuring achievement in the fourth grade provides an ideal setting, as PISA measures students after tracking has taken place in early tracking countries, while in late tracking countries there is no tracking at the age of 15.
Figure 1 The gender test score gap (F-M) in reading in primary and secondary
education, and early tracking
AUT
BEL
BGR
DEU HUN
ITA
LUX NLD
ROU
SGP SVK
SVN
CAN DNK ESP
FRA
GBR HKG
IDN ISL
ISR
LTU LVA
NOR
NZL POL
QAT
RUS
SWE
USA TWN
.7
.6
.5
.4
.3
.2
secondary education
.5 .4
.3 .2
.1 0
primary education
early tracking fitted values late tracking fitted values Reading
25
Figure 1 demonstrates the idea of the difference-in-differences estimation strategy in the case of reading (for mathematics and science see Figure A5 in the Appendix). The figure depicts the gender gap in reading test scores in primary education, measured in PIRLS 2006 for fourth graders and in secondary education, measured in PISA 2012 for the 15-year-olds. As may immediately be seen, the gender gap widens in every country, except Great Britain. The advantage of girls in reading ranges roughly from 0 to 0.4 SD in primary education. At the secondary level, they outperform boys by a larger margin, between 0.2 and 0.7 SD.
Also, Figure 1 compares early and late tracking countries. First, it should be noted that early tracking appears to go together with a smaller advantage of girls in primary education. The gender gap is between 0 and 0.2 for most of these countries in grade four, and girls have a relatively larger advantage only in Bulgaria, Slovenia and Singapore. At the same time, the size of the gender gap in late tracking countries typically falls into the range between 0.1 and 0.4 (except Spain). Looking at the 15-year-old populations, the girls’ advantage is still larger on average in late tracking countries.
However, if the change in the gender gap from primary to secondary education in the two country groups is compared, the patterns show an interesting difference. The dashed lines in the figure represent the values for the gender gap that might be expected at the secondary level, given the value of the gender gap at the primary level. The short and long dashed lines correspond to early and late or non-tracking countries respectively. At a given level of the gender gap in primary education, girls’ advantage tends to increase more in early tracking countries.
To test the direct effect of early selection formally, the PISA dataset was augmented with the PIRLS and TIMSS samples of 4th graders. An indicator variable P denoting PISA students was defined and interaction terms added to the baseline model. In this way a third level was added, but it was included in the fixed part of the model.
Note that the straightforward way for specifying a difference-in-differences model in this setting would include country fixed effects instead of random effects. A random effects multilevel model was used in order to maintain an integrated framework for the analysis and provide results comparable to those derived from the baseline model. The multilevel difference-in-differences model is:
(2)
26
where T is the measure of tracking. Student-level control variables are not included, as parental education not measured in the PIRLS and TIMSS datasets. The α and π parameters represent the interaction terms, i.e. the changes in the parameters from grade 4 to the age 15. It should be noted that besides tracking, interaction terms of P and the other country-level variables are not included as the effect of these is not expected to change with the age of students. The coefficient α1 represents the increase in the gender gap from primary to secondary education in general. The parameter of main interest is π1, representing the differential increase of the gender gap in secondary education in early- and late- or non-tracking countries.
Table 4 gives the estimates for the education policy–female student interaction effects. In columns 1, 3 and 5 tracking is measured with the age of selection under age 15, as before. In the other columns, a dummy variable specification is employed, as is frequently the case in the tracking literature. Non-tracking denotes countries that use a comprehensive school system or track students later than the age of 141. The number of countries is about the half that found the full PISA sample, as here only those countries participating both in the PISA and the PIRLS or TIMSS program at fourth grade level are included.
These results stand in sharp contrast to the patterns of the baseline model, as early tracking is significantly related to the gender slope of test scores.
The key variable here is the triple interaction term of tracking, secondary level education and female student. Its coefficient is statistically significant for each subject in both specifications. This indicates that in tracking countries the gender gap evolves in a way significantly different to that in the non-tracking group from primary to secondary education.
The triple interaction term has a negative effect, suggesting that later tracking impairs the performance of girls relative to boys. The dummy variable specifications tell the same story: in non-tracking countries, girls’ advantage in reading decreases, while the gap in math widens.
Overall, these results suggest that girls gain with early tracking relative to boys. This is not surprising, as boys enrol in vocational tracks more often than girls. Consequently, after tracking more boys than girls receive a lower level and lower quality of schooling in academic subjects.
1 An indicator for non-tracking is used instead of early tracking to have a coefficient with similar sign to tracking age.
27
Table 4 Difference-in-differences estimates of the effect of early tracking on the
gender test score gap
Math Reading Science
(1) (2) (3) (4) (5) (6)
female X log grade
retention -0.0323* -0.0330* -0.0324* -0.0329* -0.0217 -0.0233 (0.0177) (0.0172) (0.0177) (0.0184) (0.0190) (0.0190)
female X tracking age 0.00860 0.0113* 0.0213***
(0.00744) (0.00595) (0.00666)
female X non-tracking 0.0342 0.0475** 0.0756***
(0.0284) (0.0241) (0.0293)
female X individualised
teaching 0.125*** 0.128*** 0.106** 0.106** 0.120** 0.123**
(0.0405) (0.0421) (0.0525) (0.0482) (0.0488) (0.0487) female X tracking age X
PISA -0.0137* -0.0156* -0.0203**
(0.00724) (0.00899) (0.00860)
female X non-tracking
X PISA -0.0663** -0.0679**
- 0.0889***
(0.0297) (0.0311) (0.0329)
Observations 350,562 350,562 396,189 396,189 350,562 350,562
Number of countries 27 27 30 30 27 27
Country-level variables as in Table 2. Additional controls: indicator variable of PISA observations, female students, and the interaction of PISA observations and female students. Robust standard errors clustered at the country-level are given in parentheses.
*** p<0.01, ** p<0.05, * p<0.1
These results appear to contradict the effects estimated by Pekkarinen (2008).
Analysing the comprehensive education reform in Finland, he found that girls gained more with the postponement of tracking. The differences in the results might be related to the different outcome measures (educational attainment and wages versus test scores), but are also likely to be related to the different societal context of the early 70s when the Finnish school reform took place.