CHAPTER
3/EXPERIMENTAL PROCEDURES
3.1. APPARATUS
Usually the experimental arrangements for measuring luminescence spectra consist of a source of the light used for excitation, a specimen tube containing the luminescent substance, and a device for analyzing and recording the spectrum. Frequently it is advantageous to stimulate the emission not with white light, but with more or less monochromatic radiation. In this case, between the light source and the specimen tube the apparatus includes suitable filters or, better, an (excitation) mono- chromator that permits the operator to select the wavelength to be introduced. It is almost always essential, when measuring phosphor
escence spectra, to have an arrangement for cooling the specimen tube to the temperature of liquid nitrogen or lower. In principle the spectra can be measured without using a phosphoroscope, but they are then recorded simultaneously with the fluorescence spectra that lie at shorter wavelengths. However, the phosphoroscope confers so many advantages in measuring technique that one is compelled to regard it as an essential part of the equipment for determining phosphorescence spectra.
3.1.1. Source of the Exciting Light
The source of the exciting light produces white radiation, both visible and U V ; it should be as intense as possible and have an effectively continuous energy distribution. Xenon and mercury vapor lamps are most frequently used. Xenon lamps are inferior to mercury vapor in intensity but give a better continuum. They are preferable for the measurement of phosphorescence excitation spectra (see Section 3.3.2), and are obtainable in a small compact form with ratings between 250 and 500 watts, their introduction into the optical system involving little
109
expense.1 For the measurement of very weak phosphorescences high pressure mercury tubes are preferable since one can then make use of the high intensities of the principal lines of the spectrum. Data for the dose rate* of such a 500-watt lamp in combination with a large quartz- prism monochromator have been given by P a r k e r2 for the most im
portant wavelengths.
3.1.2. Filters and Monochromator s
Of the two ways in which light of a definite wavelength can be selected from the white light of the source, each has its own advantage. Filters have high transparency and so guarantee more intense excitation, but monochromators produce light of greater spectral purity and permit the introduction of any desired wavelength. The advantages that the use of a monochromator confers may well be decisive.
Whether a prism or a grating monochromator should be used is not at all easy to decide.1 With the exception of the high frequencies (which, however, are often used for excitation) the resolution is better with a grating monochromator than with a prism instrument of comparable size. The spectrum given by a grating monochromator is linear in the wavelength, an advantage that also applies to the recording of lumin
escence excitation spectra. When fluorescence spectra are being measured using a grating as the excitation monochromator, interference is fre
quently caused by scattered exciting light. This does not occur in measuring phosphorescence since scattered light from the source is completely cut off by the phosphoroscope.
The light from the excitation monochromator falls on the specimen tube containing the solution whose luminescence is under investigation.
The light emitted then falls onto the entrance slit of either a spectrograph or—for photoelectric recording—a second (the emission) mono
chromator. In phosphorescence studies, there are, with respect to the direction of excitation and the position of the specimen tube, two particularly important directions of observation. They are shown in Fig. 20. In the "right-angle" method (a) the normals to the entrance and exit slits of the excitation and emission monochromators are
* That is, the intensity of the radiation in microeinsteins per minute.
1 C. A. Parker and W. T. Rees, Analyst 87, 83 (1962).
2 C. A. Parker and L. G. Harvey, Analyst 86, 54 (1961).
3.1. Apparatus 111 perpendicular to each other; in the "straight-through" method (b) they coincide. For fluorescence measurements the use of the straight-through method is not usual because of difficulties caused by the exciting light.
Phosphorescence studies are more likely to be made with this arrange
ment since the phosphoroscope eliminates the exciting light quan
titatively whatever the geometry of the apparatus; there remains, however, the disadvantage that the "inner filter effects" (see Section
Excitation
monochromator ·
ι I
— • Ο Sample tube • Ο —
r
monochromator EmissionFig. 2 0 . Positions of specimen tubes in the light paths of phosphorescence spectro
meters, (a) Right-angle arrangement; (b) straight-through arrangement.
3.4) appearing with concentrated solutions become particularly serious with the "straight-through" method. Udenfriend3 has shown that in spectrofluorimetric analyses the most satisfactory shape of the calibra
tion curve is obtained with the "right-angle" method. The same is true for phosphorescence measurements.
3.1.3. The Specimen Tube
For phosphorimetry the specimen tube has a cylindrical shape and must fit into a suitable quartz Dewar flask that holds the refrigerant, usually liquid nitrogen at —196°C. In the simplest arrangement the specimen tubes may be test tubes made of quartz glass. A very con
venient arrangement of sample tube and Dewar flask is found in the Aminco-Keirs spectrophosphorimeter discussed below.
3.1.4. The Phosphoroscope
Separation of the rapidly decaying fluorescence from the slowly fading
3 S. Udenfriend, "Fluorescence Assay in Biology and Medicine." Academic Press, New York, 1962.
phosphorescence, which appears simultaneously, is achieved mechan- ically by means of a phosphoroscope. As has already been pointed out, this also eliminates the exciting light, so that of the three kinds of radiation
that emerge from the specimen tube—fluorescence, phosphorescence, and stimulating radiation—only the phosphorescence succeeds in reaching the spectrograph or the emission monochromator. In the original Becquerel phosphoroscope,4 the specimen tube is placed between two circular disks that are mounted on a common axis. The disks have openings 1 centimeter in length arranged along the circumference in such a way that apertures in the one disk coincide with obstructions in the other. If the disks are rotated by an electric motor, then the specimen tube "sees" alternately the exit slit of the excitation monochromator and the entrance slit of the emission monochromator or of the spectro- graph. That is, in one phase light from the stimulating source falls on the specimen tube, the path from the specimen tube to the receiver being closed, and in the next the phosphorescent light can enter the emission monochromator, while the path from the lamp to the specimen tube is closed. Keirs et al. have described a further development of the simple Becquerel phosphoroscope.5 Lewis and Kasha have used another type.6 The sample is placed in the middle of a rotating cylinder in which there is an aperture. Then, alternately, light from the source of excitation falls onto the sample and phosphorescent light from the sample onto the entrance slit of the spectrograph. This arrangement has also been used in a modified form in the Aminco-Keirs spectrophosphorimeter (see Section 3.1.6). Parker and H a t c h a r d7 drive the two disks of the Becquerel phosphoroscope with separate synchronous motors, the geometry and electrical connections being so arranged that without dismantling the apparatus one can choose to measure either the phosphorescence spectrum or both phosphorescence and fluorescence spectra.
The phosphorescent light falls onto the entrance slit of either a spectrograph or an emission monochromator, where its spectrum is
4 E. Becquerel, "La Lumière, ses causes et ses effets." Gautier-Villars, Paris, 1867;
Am. Chim. Phys. [2] 27, 539 (1871). For a mathematical treatment of phosphoro- scopes, see T. C. O'Haver and J. D. Winefordner, Anal. Chem. 38, 602 (1966).
5 R. J. Keirs, R. D. Britt, and W. E. Wentworth, Anal. Chem. 2 9 , 202 (1957).
6 G. N. Lewis and M. Kasha, J. Am. Chem. Soc. 66, 2100 (1944).
7 C. A. Parker and C. G. Hatchard, Trans. Faraday Soc. 5 7 , 1894 (1961); Analyst 87, 664 (1962).
3.1. Apparatus 113 resolved, and then is finally recorded by means of either a photographic plate or a photomuitiplier. Formerly spectrographs were exclusively employed for phosphorescence measurements. The first workers to employ a monochromator and a photoelectric recorder were Ferguson and his colleagues.8 Instruments that incorporate these are of great advantage, especially for analytical work in which, among other things, it is important to be able to make measurements rapidly and accurately.
Here too grating monochromators will be preferred.
3.1.5. The Detector System
Because in the study of phosphorescence one usually must estimate extremely low intensities, a detector system of the greatest possible sensitivity is necessary.1 The most important part of this is the photo- multiplier, that converts the weak light beam into photoelectrons and multiplies these by a factor of up to 108. There are now obtainable 11- to 13-stage tubes with quartz windows and very high sensitivity for a relatively low dark current; T u r k9 has described the various types in a review, though further considerable developments have taken place since that appeared. The output from the photomuitiplier is measured by means of a sensitive galvanometer, if necessary after further ampli
fication in order to achieve the highest sensitivity. Parker and Rees1 have discussed various amplifiers suitable for fluorescence and phos
phorescence spectrometers; if their paper is inadequate the appropriate literature on electronics should be consulted. The output from the galvanometer can be linked with a graph plotter (xy recorder), thus making possible the rapid and complete presentation of the phosphor
escence spectrum. Because the sensitivity of the multiplier is usually greatly dependent on the wavelength, the relative distribution of the intensities of the spectra obtained in this way are considerably distorted from the true quantum spectra though they can be corrected if necessary (see Section 3.3.1).
3.1.6. Phosphorescence Spectrometers
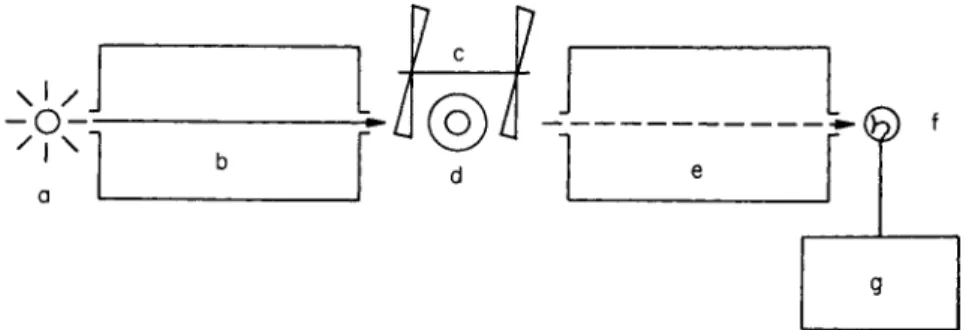
A simple phosphorescence spectrometer with straight-through arrangement and two monochromators is represented schematically in Fig. 21. The lettering has the following significance: a, source of exciting
8 J. Ferguson, T. Iredale, and J. A. Taylor, J. Chem. Soc. p. 3160 (1954).
9 W. E. Turk, Photoelec. Spectrometry Group Bull. 5 , 100 (1952).
light; b, excitation monochromator; c, Becquerel phosphoroscope;
d, specimen tube with vacuum vessel; e, emission monochromator;
f, photomultiplier; and g, amplifier with curve tracer.
A good phosphorescence spectrometer ought to combine the greatest possible sensitivity with sufficient resolution to permit the measurement of weak emissions. Factors that favor high sensitivity are a powerful source of exciting light, high-intensity monochromators, good geo
metrical design of the apparatus, and above all a sensitive photo- multiplier. Parker and H a t c h a r d7 have described a particularly efficient,
- ο - :
/ ι \
h
ι 17h
ι1/ ©h
D
1 j
B Γ
©h
D E
g
Fig. 2 1 . Diagram of a simple phosphorescence spectrometer with the straight- through arrangement.
very sensitive phosphorescence spectrometer. With this apparatus it is possible to determine phosphorescence to fluorescence ratios down to less than 10~5. The extremely weak phosphorescence that alcoholic solutions of phenanthrene display at room temperature can be measured with i t .1 0 Muel and H u b e r t - H a b a r t1 1 have reported on a very sensitive arrangement by which weak phosphorescences as far as about 10,000 À can be measured.
Among the commercially available instruments, several large UV spectrometers, such as the Beckman-Universal, can be used for studying phosphorescence if the necessary supplementary parts are attached.
The well-known Aminco-Bowman spectrofluorimeter has been provided with a phosphorescence attachment and has found quite wide distribu
tion as the Aminco-Keirs spectrophosphorimeter.1 2 The construction io C. A. Parker, Chem. Brit. 2 , 160 (1966) (see Fig. 7).
n B. Muel and M. Hubert-Habart, / . Chim. Phys. 5 5 , 377 (1958).
1 2 See brochures of the American Instrument Co., Inc., Silver Spring, Maryland.
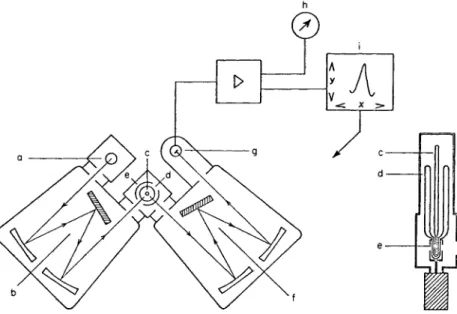
3.1. Apparatus 115 of this instrument is reproduced schematically in Fig. 22. The light of a xenon lamp (a) is resolved by the grating monochromator (b). The radiation that emerges from this has its wavelength controlled manually within the range 200-800 m/x, and falls on a small quartz specimen tube.(c) (shown in section at the right of Fig. 22) in which the solution
Fig. 2 2 . Schematic representation of the Aminco-Keirs spectrophosphorimeter.
[According to M. Zander, Angew. Chem. Intern. Ed. Engl. 4 , 930 (1965).]
under investigation is placed in the lower part of an unsilvered quartz vacuum flask (d). The vacuum flask and specimen tube are arranged on the central axis of the phosphoroscope (e). The latter is similar to that used by Lewis and Kasha and consists of a rotating cylinder in which two equally large apertures are found diametrically opposite to each other. The speed of rotation of the cylinder can be varied smoothly. The phosphorescence generated in (c) is then resolved in the grating mono
chromator (f), which also covers the range 200-800 χημ. The light that leaves (f) falls on a photomuitiplier (g), which may be selected by the operator (e.g., R C A 1P28 in the standard model), and is there converted into an electrical signal to be amplified and measured in the photo
meter (h). This photometer is convenient for use in measuring the key
bands, which can be picked out manually with the monochromator (f).
To measure complete phosphorescence spectra, the emission mono
chromator is electrically operated, and its driving motor is coupled with the photometer output and an xy plotter (Electro-Instruments Inc., San Diego 12, California). The sensitivity of the photometer can be varied over a wide range. The resolution of the monochromators (b) and (f) can be adjusted by altering the exit slit of (b) and the entrance and the exit slits of (f) as well as by the choice of the entrance and exit slits on the cuvet housing.
3.1.7. Phosphorescence Decay Phenomena
With arrangements such as those described, it is generally possible also to measure phosphorescence decay phenomena in a simple way.
For this purpose the variation of the intensity of a selected band is recorded as a function of the time after interrupting the excitation. A graph plotter cannot be used if the decay takes place too rapidly, i.e., if the mean phosphorescent lifetime is less than about 0.5 second. If the decay is more rapid an oscillograph is necessary and the display on the screen is then conveniently photographed with a Polaroid camera and evaluated. Numerous arrangements for measuring phosphorescence decay processes have been described in the l i t e r a t u r e ,1 3 - 1 5 that com
municated by Kellog and Schwenker1 4 seems to be particularly efficient.
Van Roggen and V r o o m1 5 have published a method in which, with the help of a generator with variable constants, an exponential curve is developed and varied continuously until it matches the observed decay curve. The mean phosphorescent lifetime can then be determined from the parameters introduced into the generator.
3.1.8. Polarization and Quantum Yield of Phosphorescence
The relative polarizations of phosphorescence can be measured with the help of such simple additions to the apparatus as are available for, say, the Aminco-Keirs spectrophosphorimeter. D o r r1 6 has published a recent review on the spectroscopy of polarized luminescence.
1 3 D. S. McClure, J. Chem. Phys. 17, 905 (1949); K. Skarsvâg, Rev. Sci. Instr. 26, 397 (1955); A. Martinez, Compt. Rend. 255, 491 (1962).
1 4 R. E. Kellog and R. P. Schwenker, / . Chem. Phys. 41, 2860 (1964).
1 5 A. van Roggen and R. A. Vroom, / . Sci. Instr. 32,180 (1955).
1 6 F. Dorr, Angew. Chem. 78, 457 (1966); see aiso, M. A. El-Sayed and S. Siegel, /. Chem. Phys. 44, 1416 (1966).
5.2. Solvents 117 McClure and his colleagues1 7 have discussed the experimental difficulties of measuring the absolute quantum yields of fluorescence and phosphorescence. Melhuish1 8 has described an arrangement which, essentially, combines a rhodamine Β quantum counter with a photo- multiplier and shows constant sensitivity between 220 and 590 m/x.
3.2. SOLVENTS
The experimental conditions that promote high intensities of phos
phorescence are intense stimulation, low temperatures, and rigid media.
These conditions will generally be chosen for spectrophosphorimetric analyses.
Since liquid nitrogen (b.p., — 196°C) is a very convenient refrigerant and is easily obtainable, substances and mixtures of substances that set either to glassy or crystalline solids at —196°C play an especially im
portant role as solvents in spectrophosphorimetry.
Three groups of rigid media can be distinguished:
(1) organic solvents or mixtures of solvents that set to glasses at
—196°C without either crystallizing or breaking up (2) glassy synthetic materials
(3) solvents that set to crystalline form
Each of these different types of solvent has advantages and disadvantages.
Nevertheless, the most important are the organic solvents that form glassy solids. Solutions of this kind can be quickly and easily prepared and, because of their vitreous nature, little reflection occurs, so that few special difficulties are encountered in making quantitative analytical measurements.
By far the most frequently used rigid solvent is that known as EPA, a mixture of ethanol, isopentane, and ether in the proportions by volume of 2 : 5 : 5 . It sets at the temperature of liquid nitrogen to a rigid, trans
parent glass that, if the components are dry, shows neither turbidity nor separation of crystalline material and has no tendency to break up.
Obviously it is important that the solvent should itself show the smallest possible phosphorescence. EPA of very good quality and having very little self-phosphorescence is commercially available, e.g., from the
1 7 E. H. Gilmore, G. E. Gibson, and D. S. McClure, / . Chem. Phys. 2 0 , 829 (1952).
1 8 W. H. Melhuish, J. Opt. Soc. Am. 5 4 , 183 (1964).
American Instrument Co., Inc., Silver Spring, Maryland. The user can, however, prepare the mixture himself. Frequently, this is actually an advantage, as will be shown later. In purifying the solvents it is especially important to remove traces of aromatic and heterocyclic compounds, and for this, adsorption techniques are well suited.1 In spite of careful purification, however, it is frequently not possible to obtain solvents absolutely devoid of phosphorescence, and this self-phosphorescence can often enable the (lower) limits for the detection of phosphorescent substances to be determined.
TABLE 2 0 Low-Temperature Glasses for Phosphorimetry (77°K)a
Components Proportion by volume
1. Ethanol : methanol 4:1,5:1,5:2,1:9 2. Isopropyl alcohol : isopentane 3:7
3. Alphanol79 Commercially obtainable mixture
of primary alcohols
4. Butanol : ether 2:5
5. EPA : chloroform 12:1
6. Triethylamine : ether : w-pentane 2:5:5 7. Di-w-propyl ether:isopentane 3:1 8. 2-Methyltetrahydrofuran
9. Ethyl iodide:isopentane:ether 1:2:2 10. Λ-Pentane : w-heptane 1:1 11. Methylcyclohexane : w-pentane 4:1,3:2
a According to F. J. Smith, J. K. Smith, and S. P. McGlynn, Rev. Sci. Instr. 3 3 , 1367 (1962), J. D. Winefordner and P. A. St. John, Anal. Chem. 35, 2211 (1963).
Easily soluble substances can be dissolved directly in ready-mixed EPA at room temperature. The preparation of the solutions for measure
ment is particularly easy in this case. However, in analytical work, substances are frequently met with which cannot be brought into solution in EPA at room temperature. It is then expedient to prepare a solution of the substance in boiling alcohol and, after cooling, to add the other two ingredients of the EPA, isopentane and ether, in the correct volume proportions.
1 See, for example, G. Hesse and H. Schildknecht, Angew. Chem. 67, 737 (1955).
3.2. Solvents 119 If EPA solutions are cooled down to —196°C a contraction of about 3 0 % takes place in the volume. The majority of the concentration data in publications on phosphorescence, like all the author's own measure
ments recorded in the present monograph, relate to solutions at room temperature.
Beside EPA, there are various other organic solvents and mixtures of these that set to glassy solids at — 196°C and which have been suggested and used in phosphorescence spectroscopy. A collection of these is found in Table 20. As well as such polar solvents as EPA, there are also known several nonpolar solvents that are suitable for phosphorescence measurements. Mixtures of methylcyclohexane and isopentane are the most frequently employed of these. Light petroleum (b.p., 58-60°C) also gives a clear, rigid glass.
Several glassy plastics such as poly(methyl methacrylate) (Lucite, Plexiglas) are now gaining significance as solvents in phosphorescence spectroscopy.2 - 6 Although the preparation of the solutions is more complicated than when organic solvent mixtures such as EPA are used and although there are usually stronger UV absorption and self- phosphorescence, so that synthetic materials bring additional problems, they do confer advantages for certain special studies. In particular, synthetic materials enable phosphorescence investigations to be carried out over a wide temperature range. They have been used as solvents for investigations into the processes of phosphorescence decay,3 polarization of phosphorescence,4 quantum yields,5 and intermolecular energy transfers.6 However, particularly in spectrophosphorimetry, they may well have little importance and scarcely displace the organic solvents.
We owe to Shpol'skii7 the introduction of aliphatic hydrocarbons such as cyclohexane as solvents for spectroscopic investigations at low
2 E. Laffitte, Ann. Phys. (Paris) [12] 10, 71 (1955); G. Oster, N. Geacintov, and A.
Khan, Nature 196, 1089 (1962).
3 R. Kellogg and R. Schwenker, J. Chem. Phys. 4 1 , 2860 (1964); W. Melhuish and R. Hardwicki, Trans. Faraday Soc. 5 8 , 1908 (1962).
4 M. El-Sayed, J. Opt. Soc. Am. 5 3 , 797 (1963); Nature 197, 481 (1963).
5 R. Kellogg and R. Bennett, / . Chem. Phys. 4 1 , 3042 (1964).
6 R. Bennett, J. Chem. Phys. 4 1 , 3037 (1964); R. Bennett, R. Schwenker, and R.
Kellogg, ibid. p. 3040; R. Kellogg, ibid. p. 3046.
7 Ε. V. Shpol'skii, Usp. Fiz. Nauk. 7 1 , 215 (1960); 8 0 , 255 (1963); Soviet Phys.—
Usp. (English Transi.) 6, 411 (1963).
temperatures (see also Section 1.3). Sponer, Kanda, and o t h e r s8 have used this kind of solvent for measuring phosphorescence spectra. The snowy, polycrystalline solutions yield spectra that are especially rich in structure and have bands of small half-width. They are therefore well suited for vibrational analyses and also for the identification of sub
stances during analysis. Very insoluble substances do not dissolve sufficiently in those solvents so far known to set to glassy solids. For such compounds, typified by highly condensed aromatic hydrocarbons, 1,2,4-trichlorobenzene has been suggested as a solvent.9 This sets to crystalline form at low temperatures and the solutions show intense phosphorescence. Trouble arising from the self-phosphorescence of the solvent does not arise if light of wavelength greater than 300 τημ is used for excitation. For aromatic hydrocarbons, the solubility of which permits measurements to be made both in EPA and in trichlorobenzene, it could be shown that, with few exceptions, the spectra in trichloro
benzene are unchanged from those in EPA.
Such highly purified polynuclear aromatic hydrocarbons as phen
anthrene that show no measurable phosphorescence in the crystalline state are also suitable for use as matrices. The phosphorescence spectra of aromatic hydrocarbons in a phenanthrene matrix agree1 0 with those in EPA apart from a slight broadening of the bands and a red shift of about 250 c m- 1.
Although solvents that set to crystalline form offer advantages for certain special purposes such as vibrational analysis and refined identi
fication, and for compounds of low solubility, they are scarcely suitable for quantitative analysis because of the difficulties caused by reflections from the surfaces of the crystals. It may also be mentioned here that the glasses of boric acid and of sugar that were frequently used in older studies of phosphorescence have little value for analytical work. Apart from the fact that it is not easy to prepare the melts, their use entails a series of possible sources of error; these have been discussed by Lower and El-Sayed.1 1
8 H. Sponer, Y. Kanda, and L. A. Blackwell, Spectrochim. Acta 16, 1135 (1960);
Y. Kanda and R. Shimada, ibid. 17, 279 (1961); Y. Kanda, R. Shimada, and Y. Sakai, ibid. p. 1 ; R. Shimada, ibid. pp. 14 and 30; Y. Kanda, R. Shimada, K.
Hanada, and S. Kajigaeshi, ibid. p. 1268.
9 M. Zander, Naturwissenschaften 52, 559 (1965).
1 0 M. Zander, Z. Elektrochem. 68, 301 (1964).
n S. K. Lower and M. A. El-Sayed, Chem. Rev. 66, 199 (1966).
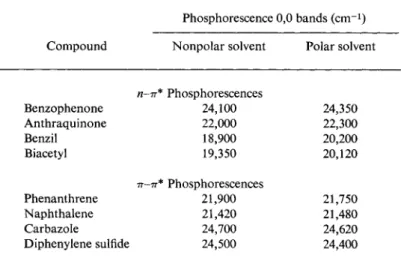
3.2. Solvents 121 Various interesting solvent effects are known in phosphorescence spectroscopy, some of which are important in analytical work. Hammond and his colleagues1 2 have compared the positions of the spectra (0,0 bands) of numerous compounds in polar and nonpolar solvents. EPA and a 1:2 ether-ethanol mixture served as polar solvents while 3- methylpentane and mixtures of methylcyclohexane with isopentane were the nonpolar ones. The η-π* phosphorescences such as are shown by, e.g., acetophenone, benzophenone, anthraquinone, and other carbonyl
TABLE 2 1 Displacement of Phosphorescence by Solvent0
Phosphorescence 0,0 bands (cm- 1) Compound Nonpolar solvent Polar solvent
η-π* Phosphorescences
Benzophenone 24,100 24,350
Anthraquinone 22,000 22,300
Benzil 18,900 20,200
Biacetyl 19,350 20,120
π-π* Phosphorescences
Phenanthrene 21,900 21,750
Naphthalene 21,420 21,480
Carbazole 24,700 24,620
Diphenylene sulfide 24,500 24,400
a According to W. G. Herkstroeter, A. A. Lamola, and G. S.
Hammond, / . Am. Chem. Soc. 86, 4537 (1964).
compounds definitely undergo hypsochromic displacement when a nonpolar solvent is replaced by a polar one. On the other hand, π - π * phosphorescences, which are found for hydrocarbons, depend only slightly on the solvent. In the majority of cases a small bathochromic shift is observed in polar as compared with nonpolar solvents. A selection of the results obtained by Hammond and his co-workers1 2 has been assembled in Table 21.
1 2 W. G. Herkstroeter, A. A. Lamola, and G. S. Hammond, / . Am. Chem. Soc. 86, 4537 (1964).
The phosphorescent lifetimes of a few halogenobenzenes and naph
thalenes have been determined by M c C l u r e1 3 in polar and nonpolar solvents and have been found to be identical within experimental error.
Various authors have shown that, because of heavy atom effects (see Section 1.2), the ratio of the quantum yields of phosphorescence to fluorescence in halogenated solvents (e.g., mixtures of ethanol and ethyl iodide) is greater than in EPA; conversely their phosphorescent lifetimes are shorter. The application of external heavy atom effects in analytical spectrophosphorimetry was first suggested by McGlynn and his co-workers,1 4 and Z a n d e r1 5 has published an exhaustive investigation on this subject. As the perturbing solvent system he used " Ι Ε Ρ Α , " a mixture of 1 volume of methyl iodide and 10 volumes of EPA; this sets to a glassy solid at — 196°C. Measurements were made on various polycyclic aromatic hydrocarbons and heterocyclics and their phos
phorescence spectra and decay times were determined under strictly comparable conditions of concentration, excitation wavelength, etc. In both solvents the majority of the compounds investigated showed close agreement of the positions of the spectra, the number of bands, and their relative intensity distributions. For an analytically suitable key band—
in all cases the bands of greatest intensity before apparatus corrections were applied—the ratio ΛΕΡΑ/^ΕΡΑ °f t n e phosphorescence intensities (in scale divisions) was found. It was shown that this ratio, which is independent of the conditions of measurement (concentration, excitation wavelength, phosphoroscope speed), varies from substance to substance.
Values between 1.5 (l,2:6,7-dibenzpyrene) and 18 (2,3-benzcarbazole) were obtained for the 15 compounds investigated. The fact that the magnitude of this heavy atom effect is specific to the substance suggests a series of possible applications in analysis. For example, for compounds with relatively large /IEPA/^EPA ratios, ΙΕΡΑ can be used as solvent instead of the more usual EPA to improve considerably the lower limit of detection. Further details are discussed in another connection in Section 3.3.5.
A medium that is of interest for phosphorescence measurements in another respect is benzophenone. This compound when cooled slowly sets to a crystalline mass, but rapid refrigeration to —196°C produces a
" D. S. McClure, / . Chem. Phys. 17, 905 (1949).
1 4 S. P. McGlynn, J. Daigre, and F. J. Smith, / . Chem. Phys. 3 9 , 675 (1963).
! 5 M. Zander, Z. Anal. Chem. 226, 251 (1967).
3.3. Characterization of Pure Substances 1 2 3 clear, glassy, supercooled melt. It can therefore be used in either glassy or crystalline form as a solvent. The phosphorescence that benzo- phenone shows in both modifications is quenched by the presence of guest molecules that have triplet states lower than that of benzophenone and the phosphorescence of the guest appears simultaneously. It has already been indicated elsewhere that the phosphorescence of many molecules is greater when sensitized by benzophenone than when excited directly (see Section 1.5). Investigations of the phosphorescence of mixed crystals of aromatic hydrocarbons and benzophenone have been carried out by Hochstrasser and L o w e r1 6 (see Section 1.5). Benzo
phenone may well claim some interest too as a solvent in studying analytical applications of phosphorescence.
3 . 3 . CHARACTERIZATION OF PURE SUBSTANCES BY MEANS OF THEIR PHOSPHORESCENCE PROPERTIES
The phosphorescence of a pure organic compound is characterized by a series of measurable quantities. Of these the following are particularly important, relatively easily accessible, and collectively of considerable significance for planning and carrying out spectrophosphorimetric analyses: phosphorescence spectrum, phosphorescence excitation spectrum, mean phosphorescent lifetime, the ratio φρΙφ/ of the quantum yields of phosphorescence and fluorescence, and dependence of the phosphorescence on the solvent.
3.3.1. Phosphorescence Spectrum
To measure the phosphorescence spectrum (with the Aminco-Keirs spectrophosphorimeter (see Section 3 . 1 . 6 ) or some similar instrument) the excitation monochromator is adjusted to a selected wavelength suitable for stimulating the substance under investigation, and the emission monochromator, which is linked to the recorder, sweeps through the wavelength region in which the spectrum is to be found. The compound is in a rigid glassy medium such as EPA and in practice the refrigerant is liquid nitrogen. The speed at which the phosphoroscope rotates is so chosen that when it is raised further no further increase in the intensity of the spectrum can be measured. Obviously if the phosphorescence
1 6 R. M. Hochstrasser,/. Chem. Phys. 3 9 , 3153 (1963); R. M. Hochstrasser and S. K.
Lower, ibid. 4 0 , 1041 (1964).
decays slowly a lower speed of rotation can be chosen than if it fades rapidly.
In simple apparatus, excitation is with the unfiltered white light of the mercury or xenon lamp. For measuring very weak phosphorescences of reliably pure substances this method is to be recommended, but for spectrophosphorimetric analysis selective excitation offers special advantages that are too important to be surrendered.
The choice of the excitation wavelength—especially for the analysis of mixtures—depends on a series of criteria that have yet to be discussed (see Section 3.5.2). When measuring the phosphorescence spectrum of a sufficiently dilute solution of a single pure compound it is expedient to irradiate with a wavelength that corresponds to a strong absorption maximum of the compound. Suitable wavelengths can therefore be rapidly inferred from the UV spectrum of the substance. In doing this it is necessary to take note of the fact that the majority of the UV spectra to be found in the literature were measured at room temperature, although phosphorescence spectra are obtained at low temperatures.
The displacement of the UV spectrum with temperature is, however, generally characteristic of the class of compound. Hence by knowing how these spectra vary with temperature for a few representatives of a particular class the variation of all the rest can be predicted, at least approximately. For the polynuclear aromatic hydrocarbons the α bands (xLb) are displaced1 hypsochromically by ca. 30-50 c m- 1 on cooling from room temperature to 77°K, while the para (lLa) and β bands (lBb) are shifted bathochromically about 300 cm"1. Xenon lamps rapidly fall off in intensity in the high-frequency region, so that if a choice has to be made between irradiation in a weak but long-wave absorption band and an intense short-wave band the decision is often in favor of the former.
The phosphorescence spectrum of a pure substance is independent of the irradiating wavelength. If, therefore, different spectra are obtained on exciting with different wavelengths the conclusion may confidently be drawn that the compound is not homogeneous. Each individual compound has been excited in its own absorption region by irradiating with the various wavelengths and the distinct phosphorescence spectrum of each has been produced. Of course it is conceivable that the UV and phosphorescence spectra of the components of a mixture are very
1 E. Clar, Spectrochim. Acta 4 , 116 (1950).
3.3. Characterization of Pure Substances 125 similar. Then the same phosphorescence spectrum will be obtained, within the limits of experimental error, by excitation with different wavelengths. Thus the converse, that when the phosphorescence spectrum of a substance is independent of the wavelength of excitation the substance must definitely be homogeneous, is not true.
In the Aminco-Keirs spectrophosphorimeter, the specimen tube with the rigid solution to be investigated is immersed in the liquid nitrogen that serves as a cooling agent, and so the stimulating light that falls on it and the phosphorescent light appearing from it must pass through the nitrogen. There are other cuvets and cooling devices in which this is not the case. In all kinds of phosphorescence apparatus in which the light passes through the liquid nitrogen it is, of course, decisively important to ensure that the nitrogen contains no snow, i.e., that it is quite dry, and that no gas bubbles rise up in the Dewar flask, since otherwise irregular fluctuations in the intensity of the phosphorescence are recorded, and this makes satisfactory measurement of the spectrum impossible. However, the manipulative techniques for obtaining snow- free and bubble-free nitrogen are easily acquired.
Apart from its dependence on the sizes of the prisms and gratings used in the instrument, the band width depends on the choice of slit widths in the two monochromators. For the purpose of qualitative analysis great importance will be attached to well-resolved spectra, but for quantitative analysis less well-resolved spectra will frequently be tolerated to secure greater sensitivity of the apparatus. Narrow slits are required for well-resolved spectra, wide ones for high sensitivity.
A reasonable compromise must be found in each particular case. With the Aminco-Keirs spectrophosphorimeter (using a xenon lamp and photomultiplier R C A 1P28) the following slit widths have been found suitable for qualitative analysis (see Fig. 22): Exit slit A of the excitation monochromator b, 3 mm ; entrance and exit slits B, C of the phosphor
oscope housing, 0.5 mm ; entrance slit D of the emission monochromator f, 2 m m ; exit slit Ε of the emission monochromator f, 0.5 mm. For quantitative analysis, A = 3 mm, Β = 3 mm, C = 2 mm, D = 3 mm, Ε = 2 mm.
The phosphorescence spectra the graph plotter traces out do not correspond in the relative intensities of the bands to the true energy spectra (the "quantum spectra"); this occurs particularly because of the dependence of the sensitivity of the photomultiplier on the wavelength.
For theoretical and similar considerations concerning the relationships between constitution and spectra, knowledge of the quantum spectra is a great advantage. For analytical purposes the uncorrected records are more useful since one works with them and correcting them to the quantum spectra introduces new sources of error. In publishing lumin
escence spectra it is the custom that in predominantly theoretical papers quantum spectra are given and in predominantly analytical papers uncorrected spectra.2 For the latter the constants of the apparatus are essential and the calibration curve of the photomultiplier is desirable so that readers who are interested in the corrected spectra can themselves make the conversion.
Various methods are known for obtaining the calibration curve of the spectrometer; the most i m p o r t a n t3'4 are measurement with a calibrated tungsten lamp (for the visible region) and the measurement of fluor
escence and phosphorescence standards, of which the energy spectra are known. The second method is used particularly often. Suitable fluorescence standards have been suggested by Lippert and his col
leagues4 and by other workers. In the ranges in which the sensitivity of the receiver changes rapidly with the wavelength, the calibrations are unreliable. A detailed description of the procedure with fluorescence standards has been given by L i p p e r t4 and by Dann and Nickel.5 33.2. Phosphorescence Excitation Spectrum
To measure a phosphorescence excitation spectrum the emission monochromator is clamped at a wavelength at which an easily measur
able phosphorescence band appears, and the excitation monochromator, which is coupled to the curve tracer, sweeps through the range of wave
lengths in which the UV spectrum of the substance under investigation is to be found. Thus in the phosphorescence excitation spectrum, one measures the dependence of the phosphorescence intensity on the stimulating wavelength. In the ideal case (the brightness of the lamp and
2 J. H. Chapman, Th. Fôrster, G. Kortiim, C. A. Parker, E. Lippert, W. H. Melhuish, and G. Nebbia, Appl. Spectry. 17, 171 (1963).
3 C. A. Parker and W. T. Rees, Analyst 85,587 (1960) ; H. V. Drushel, A. L. Sommers, and R. C. Cox, Anal. Chem. 35,2166 (1963); C E. White, M. Ho, and E. Q. Weimer, ibid. 3 2 , 438 (1960).
4 E. Lippert, W. Nàgele, I. Seiboldt-Blankenstein, U. Staiger, and W. Voss, Z. Anal.
Chem. 170, 1 (1959).
5 O. Dann and P. Nickel, Ann. Chem. 667, 101 (1963).
3.3. Characterization of Pure Substances 1 2 7
the yield of phosphorescence are independent of the wavelength) the phosphorescence excitation spectrum corresponds accurately with the UV spectrum of the substance. In reality the excitation spectra are distorted by comparison with the absorption spectra, since the dose rates of mercury and xenon lamps vary with the wavelength. Moreover, for a few compounds the phosphorescence quantum yields are functions of the excitation wavelength (see Section 1.4). In order to convert measured into true excitation spectra the energy distribution of the source of excitation must be known. The method by which measured luminescence excitation spectra are corrected has been described in detail by Parker and R e e s3.
True phosphorescence excitation spectra can be very useful in analysis.
It is possible to determine the UV absorption of a substance via the excitation spectrum using very much smaller concentrations than are possible in direct measurement of the U V spectrum. With mixtures it is often possible via the excitation spectrum to obtain the UV spectrum of an individual phosphorescent compound, whereas direct measurement of the UV absorption gives the combined curve resulting from the superposition of the absorption spectra of the various components.
P a r k e r6 has described a measuring device that records directly the true excitation spectrum; it was developed especially for fluorescence measurements but is applicable also to phosphorescence spectra. Such an appliance is extraordinarily useful. One will often, especially in routine investigations, reject the tedious point-by-point conversion of measured into true excitation spectra, which one has to carry out with the equipment that is commercially available at present, and will be satisfied with the measured excitation spectra. These also have a certain analytical value and often, even in mixtures, enable the UV absorption of individual compounds to be recognized. Apart from the circumstances discussed above, phosphorescence excitation spectra can be falsified by a too-high recording speed. The movement of the excitation monochrom
ator must be as slow as possible, especially when the phosphorescence decays slowly.
3.3.3. Mean Phosphorescent Lifetime
According to all previous experience the process of the decay of the phosphorescence takes place according to a strictly exponential law,
6 C. A. Parker, Nature 182, 1002 (1958).
if the substance is in EPA or a corresponding organic glass at low temperature. To measure the process (e.g., by use of the Aminco-Keirs spectrophosphorimeter or a similar instrument) excitation and emission monochromators are firmly fixed at suitable wavelengths, the excitation is interrupted, and the decay of phosphorescence intensity is recorded either (for slow processes, i.e., long lifetimes) with an xy plotter or (for rapid processes, i.e., short lifetimes) by an oscillograph (the picture on the screen is conveniently photographed by means of a Polaroid camera).
If, then, the logarithm of the phosphorescence intensity (in scale units) is plotted against the time, a straight line is obtained the gradient of which is given by 2.303r0, where r0 is the mean phosphorescent lifetime (see Section 1.4).
The strictly exponential course of the phosphorescence decay process (over an interval of several times τ0) is an excellent criterion of purity.
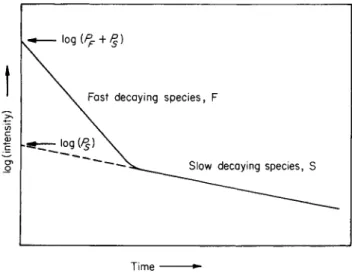
If it is observed, then one can conclude that, at the emission wavelength used, only a single compound phosphoresces. If a strictly exponential decay and a constant value of r0 are found over the complete range of the phosphorescence spectrum, then we clearly have a single pure compound. The only case in which this evidence can be misleading is when the two or more components of a mixture have exactly the same mean phosphorescent lifetime, but that will seldom be the case. If, conversely, it is established that a measured phosphorescence decay process cannot be represented by the semilogarithmic plot ( l o g /p h o s/ 0 as a straight line, but only as the superposition of two, three, or more straight lines with different gradients, then it can confidently be concluded that, at the selected emission wavelengths, two, three, or more substances with different r0 values phosphoresce.
An important exception to the behavior just described is known. A substance in a solvent in which an external heavy atom effect appears does not show exponential decay of phosphorescence. The phenomenon was first observed by McGlynn and his colleagues7 in rigid solutions of 1-halogenonaphthalenes in propyl halides (CI, Br, and I) at — 190°C.
Z a n d e r8 confirmed it for several polynuclear aromatic hydrocarbons and heterocyclics in a mixture of 10 volumes of EPA and 1 of methyl iodide. In these cases the semilogarithmic plot of the decay process
7 S. P. McGlynn, M. J. Reynolds, G. W. Daigre, and N. D. Christodouleas, / . Phys.
Chem. 66, 2499 (1962).
8 M. Zander, Z. Anal. Chem. 226, 251 (1967).
3 .3. Characterization of Pure Substances 129 produced a series of straight lines of different slopes. The decay process is therefore exhibited as the overlapping of several exponential functions with different time constants ( r0) . McGlynn has discussed the origin of this behavior.7
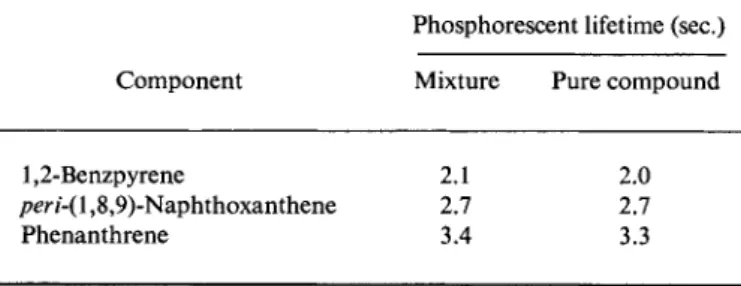
Experimental evidence so far suggests that the mean phosphorescent lifetime is a characteristic constant of a substance for a given temperature and solvent, i.e., is independent of the concentration. It can therefore be used, in addition to the spectrum, for the identification of a phosphore
scent compound.9 The extraordinary simplicity and rapidity with which the determination of r0 can be carried out encourages its use in qualitative phosphorescence spectroscopic analysis of pure substances and mixtures.
This is illustrated elsewhere by a number of examples (see Section 3.5.3).
3.3.4. The Ratios φΡΙφί
From the ratio φρΙφ/ of the quantum yields of phosphorescence and fluorescence it is possible to determine whether a compound phosphor
esces or fluoresces more strongly. This is of theoretical significance and also of importance in planning phosphorimetric analysis.
To determine φρΙφ/ the total luminescence spectrum (fluorescence plus phosphorescence) of the substance at low temperature is measured in an organic glass using a fluorescence spectrometer. To do this using the phosphorescence spectrometer described by Parker and H a t c h a r d1 0'1 1 (see Section 3.1.6), the two circular disks of which the phosphoroscope consists are brought "into phase"; the phosphoroscope is removed from the Aminco-Keirs spectrophosphorimeter (which can be done very quickly) and in this way the instrument is converted into a spectro- fluorimeter. The measured total luminescence spectrum is converted into the energy spectrum by means of the calibration curve of the instrument and the areas of the shorter-wavelength fluorescence spectrum and of the longer-wavelength phosphorescence spectrum are determined with a planimeter. The ratio of the areas is identical with φρΙφ/.
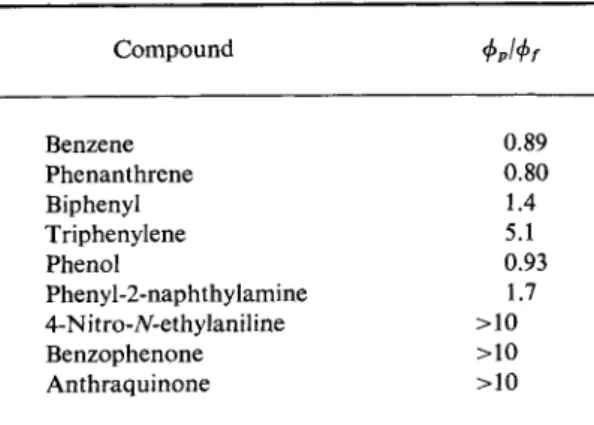
Parker and H a t c h a r d1 1 have measured φρ/φ/ values for compounds of various classes. Their results are reproduced in Table 22. It is clear from these that numerous compounds, such as the aromatic carbonyl com
pounds (see also Section 2.2), can only be detected and estimated by 9 M. Zander, Angew. Chem. Intern. Ed. Engl. 4 , 930 (1965).
1 0 C. A. Parker and C. G. Hatchard, Trans. Faraday Soc. 57, 1894 (1961).
1 1 C. A. Parker and C. G. Hatchard, Analyst 87, 664 (1962).
phosphorescence and not by fluorescence. For aromatic hydrocarbons in principle both methods can be applied and further criteria still to be discussed are needed to enable one to decide which of the two lumines
cence methods is the more suitable in a particular case (see Section 3.7).
TABLE 2 2 φρΙφ/ Values for Some Compounds*
Compound ΦρΙΦί
Benzene 0.89
Phenanthrene 0.80
Biphenyl 1.4
Triphenylene 5.1
Phenol 0.93
Phenyl-2-naphthylamine 1.7 4-Nitro-yY-ethylaniline >10
Benzophenone >10
Anthraquinone >10
a According to C. A. Parker and C. G. Hatchard, Analyst 87, 664(1962).
3.3.5. The Dependence of Phosphorescence on the Solvent
Among the effects of solvent on phosphorescence that have already been discussed (see Section 3.2), the most important in spectrophos
phorimetry is the heavy atom effect shown by solvents that contain halogen atoms. The mixture known as ΙΕΡΑ, which consists of 10 parts by volume of EPA to 1 part of methyl iodide, is a solvent that produces an external heavy atom effect and hardens without fracture to a glass at
—196°C; it is therefore also suitable for quantitative spectrophosphori
metry.8
It is of great advantage in analysis if a substance can be characterized by two spectra. This is possible, e.g., with coronene, triphenylene, l,2:7,8-dibenzocarbazole (XCV), and brasan (XCVI) if the spectra are measured in EPA and in ΙΕΡΑ. Although most of the compounds investigated in this connection show extensive agreement between their phosphorescence spectra in EPA and ΙΕΡΑ, those of the four com
pounds named above are characteristically different in the two solvents,8
3.3. Characterization of Pure Substances 1 3 1
xcv
X C V Iand as examples the spectra of triphenylene and brasan are reproduced in Figs. 23 and 24. In this connection see also Section 4.2.
4 0 0 4 5 0
Î
I ^ T T il
II II II II
jl EPA
ΙΕΡΑ
II 1
'If J ! Λ
)
.5 0 0 5 5 0
λ (m/x) — Fig. 23.
5 0 0
Fig. 23. Phosphorescence spectra of triphenylene in EPA (—) and ΙΕΡΑ (—).
The spectra have been normalized so that the most intense band has the same height in each case. [According to M. Zander, Z. Anal. Chem. 226, 251 (1967).]
Fig. 24. Phosphorescence spectra of brasan in EPA (—) and ΙΕΡΑ (—). The spectra have been normalized so that the most intense band has the same height in each case.
[According to M. Zander, Z. Anal. Chem. 226, 251 (1967).]
3.4. FOUNDATIONS OF QUANTITATIVE SPECTROPHOSPHORIMETRY
The intensity Ρ of the phosphorescence of a solution is proportional to the intensity of the light absorbed by the dissolved substance and to the phosphorescence quantum yield, φρ. If the intensity absorbed is written as .the difference between the incident and transmitted intensities I0 and
then
Ρ = φρ(Ι0-Ιί) (6)
By the Lambert-Beer law It = I0 - \0~€cd, where e is the molar extinction coefficient, c the concentration in moles/liter, and d the thickness of the layer of solution in centimeters, and so we obtain from Eq. (6)
Ρ = φρΙ0(\-\0'^) (7)
Expressing Eq. (7) as a power series we have
Ρ = φρΙ0{2.^ά- (2.3ea/)2/2! + · · ·) (8) If the extinction of the solution E= ecd, is less than 0.01, the higher
terms of the series can be neglected and Eq. (8) becomes
Ρ = 2.3φρΙ0^ (9)
Equation (9) is the fundamental equation of quantitative spectro
phosphorimetry and indicates that in sufficiently dilute solutions a linear relationship exists between the intensity of phosphorescence and the concentration of the solution. It was originally developed for fluori- metry1 and was carried over to phosphorimetry by Keirs et al?
The concentrations at which it is possible to work, and yet to be within the range of validity of Eq. (9), must be decided from case to case. For example, we may consider here the behavior of the aromatic hydro
carbons when studied with the aid of an Aminco-Keirs spectrophosphori- meter.3 The linear relationship between concentration and intensity of phosphorescence becomes progressively more satisfactory as the extinc
tion of the solution becomes less than 0.01. We may take d to be 0.1 cm, which corresponds roughly to the diameter of the specimen tube of the Aminco-Keirs instrument. On irradiating in the relatively weak α bands (xLb) (e = ΙΟ2—103) it is found that concentrations c < 1 0- 3 M are within
1 See G. F. Lothian, / . Sci. Instr. 1 8 , 200 (1941).
2 R. J. Keirs, R. D. Britt, Jr., and W. E. Wentworth, Anal. Chem. 29, 202 (1957).
3 See M. Zander, Angew. Chem. Intern. Ed. Engl. 4, 930 (1965).
3.4. Foundations of Quantitative Spectrophosphorimetry 133 the range of validity of Eq. (9). For irradiation in the intense para and β bands (lLa and xBb) (e = 104-105) greater dilutions (c < \0~5 M) are, however, necessary. For example, curves of phosphorescence intensity against concentration have been reproduced in Fig. 25 for triphenylene irradiated in the α and β bands. As can be seen, the concentration range in which linearity prevails is greater when irradiation is in the α band than when it is in the β band.
A quantitative spectrophosphorimetric analysis turns out to be very simple if, in the solution under examination, there are no other substances present apart from the phosphorescent compound. A situation that frequently occurs is one in which a mixture of substances has been separated by paper or thin-layer chromatography and the individual spots have been eluted; spectrophosphorimetry is then utilized solely to determine quantitatively the pure compounds present in the eluates (see Section 3.6). An intense band in the phosphorescence spectrum is chosen as the key band, and for the excitation a wavelength is selected in which the lamp is sufficiently intense and for which the compound under investigation has an intense absorption band. The dilution of the experimental solution is so chosen that it lies within the range of validity of Eq. (9). Next a calibration curve of phosphorescence intensity against concentration is established by means of solutions of known concentra
tion of the pure compound to be estimated. The phosphorescence intensity employed is the uncorrected output of the instrument for the wavelength of the key band. After establishing the calibration curve, the sample being investigated is measured under identical conditions.
The concentration of the solution can then be obtained directly from the calibration. Obviously it is important that the brightness of the source should not change [excitation intensity 70, Eq. (9)] during the measurement of the calibration curve and the test sample.
A rather more complicated situation prevails if the test sample contains other compounds beside the phosphorescent substance to be evaluated and these likewise absorb at the irradiating wavelength. For the present it is quite immaterial whether these accompanying substances themselves phosphoresce or not.
The phosphorescence intensity of a solution is actually, under other
wise identical conditions, dependent not only on the concentration of the dissolved phosphorescent compound but also on the intensity of irradiation. In solutions of a pure compound A the exciting radiation is
34. Foundations of Quantitative Spectrophosphorimetry 135 absorbed only by this. If there are other absorbing components, B, C, D, etc., in the solution, these take up part of the incident radiation, the whole of which is, therefore, no longer available to excite the phos
phorescence of A. Hence, for a given concentration of A, its phos
phorescence is smaller in the presence of B, C, D, etc., than in the solution of the pure material. This physically trivial phenomenon, which, however, is of great practical importance in fluorimetry and phosphori- metry, is known as the "inner filter effect."* For a two-component system A, Β in which an inner filter effect operates, Eq. (6) takes the form
^ - b i f e . K "
(io)Correspondingly Eq. (8) becomes
ΡΛ = Φρ,Α h ( 2 . 3 e . cA d - ( 2 . 3 ^ " g ^ + *g* > + . . . ) (11) Equations (10) and (11) show, as is immediately clear, that an inner filter effect is all the greater, the smaller the ratio of the extinction of component A, which is being measured, to that of the filter component Β for the excitation wavelength, and, further, that the effect becomes negligibly small if the total concentration is sufficiently small.1
An inner filter effect can cause particularly strong interference if the component A, present in a small amount, must be estimated in the presence of a very large amount of the filter component B. This situation often arises, for example in assaying a phosphorescent impurity A in some very pure product B. It may be assumed that the phosphorescence calibration curve has been determined with solutions that contain only the component A. Because of the filter effect the test sample then shows a lower phosphorescence intensity than the calibration curve does for an equal concentration of A. Thus, in the test sample, the value found for A is wrong, being, in fact, too low.
In principle, there are three possible ways of avoiding or eliminating the inner filter effect :
1. An excitation wavelength is chosen for which the compound to be
* Frequently both the non linearity that is observed between luminescence intensity and concentration in solutions of a pure compound at high concentrations and the reabsorption of luminescence are also known as "inner filter effects." We shall, however, use the term only with the meaning discussed above.
estimated absorbs much more strongly than the accompanying material.
However, this possibility cannot often be realized, especially in analyzing complicated mixtures of very similar compounds.
2. The filter components are added to the solutions used for develop
ing the phosphorescence calibration curve, the additions being made in approximately the quantities in which they are present in the test sample.
This presupposes that the qualitative composition of the test sample is accurately known and its quantitative composition approximately, and further presumes that all the substances present in the sample are available in pure form. This possibility will only be capable of realization in the analysis of mixtures of relatively simple composition. An example, the spectrophosphorimetric analysis of the impurities in very pure anthracene from coal tar, is discussed in detail elsewhere (see Section 4.1).
3. Work is conducted at dilutions at which inner filter effects are no longer serious. This third way of eliminating inner filter effects is the most generally applicable. It is also successful with mixtures of very complex composition. In practice the procedure is as follows: the assay is carried out for several dilutions, the analytical figures obtained increasing at first with increasing dilution of the experimental solutions.
The correct analytical result, no longer falsified by inner filter effects, is recognized by the fact that on further dilution the figures alter no more.
Of course, in principle, it would be possible always to avoid inner filter effects by working from the beginning with very high dilutions.
However, high dilutions imply low phosphorescence intensities and necessitate in turn high amplification by the recording instrument.
This leads to increased noise in the measuring device and correspondingly reduces the accuracy of the measurement and of the analytical results derived from it. It is therefore more advantageous to estimate the extent of dilution permissible in each particular case and to carry out the analysis for that.
Of the possible sources of error important in the quantitative spectro
phosphorimetric analysis of mixtures, the inner filter effect deserves the most attention. By ignoring it, completely false analytical results can be produced.
In fluorimetry the reabsorption of the fluorescent radiation is a frequent source of error. The corresponding phenomenon does not
3.4. Foundations of Quantitative Spectrophosphorimetry 137 occur in phosphorimetry since phosphorescence spectra lie at appreciably greater wavelengths than UV. Only when colored compounds are present in the mixture can the radiation of the phosphorescent com
pounds occasionally be absorbed. This case seldom arises. In the same way quenching processes, i.e., processes that reduce the quantum yields, play only a small part in phosphorimetry in contrast with fluorimetry.
It was shown earlier that triplet energy transfer in rigid solutions, a process bound up with the quenching of the phosphorescence of one component (the energy donor; see Section 1.5) only appears at very high concentrations; such high concentrations, however, are not generally used in spectrophosphorimetry for the reasons already discussed. The phenomenon of quenching by other substances (e.g., inorganic compounds, phenols, hydrogen sulfide, etc.), that is well known in fluorescence spectroscopy is rare in phosphorescence (but see
Sawicki and Pfaff4).
The magnitude of the random errors to which a phosphorimetric analysis is subject depends, among other things, on the apparatus used.
Possible causes of random errors are fluctuations in the brightness of the source lamp, noise in the recording instrument, and variations in the control of the wavelengths. With the Aminco-Keirs spectrophosphori- meter these influences are small and affect the reproducibility of the measurements only to an insignificant extent. The greatest influence on the accuracy of analytical results obtained with the Aminco-Keirs instrument arises from inability to replace the sample tube in exactly the same position in the light path for successive measurements. The relative mean error of phosphorimetric analyses using this spectro- phosphorimeter, at the present stage of manipulative skill, amounts to 5 - 1 0 % .3 This accuracy is sufficient for many purposes. Details are discussed later with the help of examples (see Sections 4.1-4.7).
Spectrophosphorimetry is a very sensitive method of analysis. The limits of detection for strongly phosphorescent compounds are of the same order of magnitude as for those with strong fluorescence. Thus, for example, triphenylene can be clearly detected3 even at a dilution of 1 0- 9 gm/ml. A thorough comparison of the sensitivity of spectrofluori- metry, spectrophosphorimetry, and UV spectroscopy is given elsewhere (see Section 3.7.3).
4 E. Sawicki and J. D. Pfaff, Mikrochim. Acta p. 322 (1966).
3 . 5 . T H E SPECTROPHOSPHORIMETRIC ANALYSIS OF MIXTURES
The qualitative and quantitative analysis of a mixture is possible by spectrophosphorimetry if the components present in the mixture differ sufficiently in one or, better, in several of the following measurable properties: phosphorescence spectrum, phosphorescence excitation spectrum, mean phosphorescent lifetime, and sensitivity to external heavy atom effects. Frequently it is the case that only one or a few of the components of a mixture show measurable phosphorescence. These can then usually be very easily detected qualitatively and can also be estimated quantitatively beside the nonphosphorescent components.
5.5.7. Phosphorescence Spectrum
We consider first mixtures the components of which exhibit very similar UV spectra but definitely different phosphorescence spectra.
With mixtures of this kind the phosphorescence spectra of all the components present are simultaneously excited by every possible excitation wavelength. The measured spectrum of the mixture is then produced as a superposition of the spectra of the individual components.
As a simple example, the spectrum of a mixture of carbazole and phen
anthrene is reproduced in Fig. 26. Both compounds can be recognized side by side without any difficulty. The situation does not change—at least qualitatively—if the mixture contains, in addition, nonphos
phorescent compounds. The identification of a substance on the basis of its phosphorescence spectrum is carried out by comparison with an authentic spectrum. Naturally spectrophosphorimetry—like every spectroanalytical method—is all the more effective the more authentic spectra of pure substances there are available for purposes of com
parison.
For quantitative analysis suitable phosphorescence key bands are chosen for each component of the mixture. The situation is then simple if the phosphorescence spectra of the different components do not overlap at all or do so only slightly. The individual compounds can then be considered independently of each other and calibration curves can be developed for each of them in the way described earlier (see Section 3.4).
Hence the amount present in the sample can be determined directly from the intensity of the key band. When partial superposition of the spectra occurs, use can be made, in principle, of the well-known methods