Tuberculosis 126 (2021) 102037
Available online 8 December 2020
1472-9792/© 2020 The Authors. Published by Elsevier Ltd. This is an open access article under the CC BY-NC-ND license
(http://creativecommons.org/licenses/by-nc-nd/4.0/).
Verification of tuberculosis infection among V ´ ac mummies (18th century CE, Hungary) based on lipid biomarker profiling with a new
HPLC-HESI-MS approach
Orsolya Anna V ´ aradi
a,b,*, D ´ avid Rakk
b, Olga Spekker
a, Gabriella Terhes
c, Edit Urb ´ an
d,e, William Berthon
a, Ildik ´ o Pap
f, Ildik o Szikossy ´
f, Frank Maixner
g, Albert Zink
g,
Csaba V ´ agv olgyi ¨
b, Helen D. Donoghue
h, David E. Minnikin
i, Andr ´ as Szekeres
b, Gy orgy P ¨ ´ alfi
aaDepartment of Biological Anthropology, Faculty of Science and Informatics, University of Szeged, Hungary. Postal address: K¨oz´ep fasor 52, H-6726, Szeged, Hungary
bDepartment of Microbiology, Faculty of Science and Informatics, University of Szeged, Hungary. Postal address: K¨oz´ep fasor 52, H-6726, Szeged, Hungary
cInstitute of Clinical Microbiology, Faculty of Medicine, University of Szeged, Hungary. Postal address: P.O.B. 427, H-6701, Szeged, Hungary
dDepartment of Medical Microbiology and Immunology, Medical School, University of P´ecs, Hungary. Postal address: Szigeti út 12, H-7624 P´ecs, Hungary
eInstitute of Translational Medicine, Medical School, University of P´ecs, Hungary. Postal address: Szigeti út 12, H-7624, P´ecs, Hungary
fDepartment of Anthropology, Hungarian Natural History Museum, Hungary. Postal address: Ludovika t´er 2-6, H-1083, Budapest, Hungary
gInstitute for Mummy Studies, Eurac Research, Bolzano, Italy. Postal address: Viale Druso, 1, I-39100, Bolzano, Italy
hCentre for Clinical Microbiology, University College London, London, UK. Postal address: Gower Street, London, WC1E 6BT, UK
iInstitute of Microbiology and Infection, School of Biosciences, University of Birmingham, UK. Postal Address: B15 2TT Birmingham, UK
A R T I C L E I N F O Keywords:
Tuberculosis Mummies
High-performance liquid chromatography Mass spectrometry
Lipid biomarkers Mycocerosates
A B S T R A C T
Tuberculosis (TB) was a large burden of infections that peaked during the 19th century in Europe. Mummies from the 18th century CE, discovered in the crypt of a church at V´ac, Hungary, had high TB prevalence, as revealed by amplification of key fragments of TB DNA and genome-wide TB analysis. Complementary methods are needed to confirm these diagnoses and one approach uses the identification of specific lipid biomarkers, such as TB mycocerosic acids (MCs). Previously, MC derivatives were profiled by specialised gas chromatography- mass spectrometry (GC-MS), so an alternative more direct approach has been developed. Underivatized MCs are extracted and analysed by high-performance liquid chromatography linked to a mass spectrometer, in heated electrospray ionisation mode (HPLC-HESI-MS). The method was validated using representatives of the Myco- bacterium tuberculosis complex and other mycobacteria and tested on six V´ac mummy cases, previously consid- ered positive for TB infection. Analysing both rib and soft tissue samples, four out of six cases gave profiles of main C32 and major C29 and C39 mycocerosates correlating well with those of M. tuberculosis. Multidisciplinary methods are needed in the diagnosis of ancient tuberculosis; this new protocol accesses important confirmatory evidence, as demonstrated by the confirmation of TB in the V´ac mummies.
1. Introduction
Tuberculosis (TB) has been present in the history of mankind for at
least ten millennia [1], but the traces of its infectious agent could be detected from animal bone remains of a far earlier era [2]. Although the prevalence of the disease peaked between 1896 and 1905 in Hungary
Abbreviations: mycocerosic acid, (MC); mycolic acid, (MS); Mycobacterial Outer Membrane, (MOM); phthiocerol, (PDIM); phenolic glycolipid, (PGL); poly- tetrafluoroethylene, (PTFE); isopropanol, (IPA); acetonitrile, (MeCN); selected ion monitoring, (SIM); atmospheric pressure chemical ionisation, (APCI); (heated) electrospray ionisation, ((H)ESI).
* Corresponding author. Department of Biological Anthropology, Faculty of Science and Informatics, University of Szeged, Hungary. Postal address: K¨oz´ep fasor 52, H-6726, Szeged, Hungary.
E-mail addresses: varadi.orsolya.90@gmail.com (O.A. V´aradi), rakkdavid@gmail.com (D. Rakk), olga.spekker@gmail.com (O. Spekker), terhesga@gmail.com (G. Terhes), zsoldiedit25@gmail.com (E. Urb´an), william.berthon@gmail.com (W. Berthon), papildi@hotmail.com (I. Pap), szikossy@gmail.com (I. Szikossy), frank.maixner@eurac.edu (F. Maixner), albert.zink@eurac.edu (A. Zink), mucor1959@gmail.com (C. Vagv´ olgyi), ¨ h.donoghue@ucl.ac.uk (H.D. Donoghue), d.e.
minnikin@bham.ac.uk (D.E. Minnikin), andras.j.szekeres@gmail.com (A. Szekeres), gypalfi@hotmail.com (G. P´alfi).
Contents lists available at ScienceDirect
Tuberculosis
journal homepage: http://www.elsevier.com/locate/tube
https://doi.org/10.1016/j.tube.2020.102037
Received 5 October 2020; Received in revised form 25 November 2020; Accepted 29 November 2020
[3], tuberculosis had been proven to be present in the Carpathian Basin at least since the Neolithic period [4]. On the grounds of the remarkable importance of these infections around the world, TB remains a priori- tized research topic. This includes not only the study of recent cases but also the investigation of archaeological samples, which could help in the better understanding of the disease and its evolution [5–7]. For this purpose, paleopathologists usually use well-documented collections of skeletons and mummies from the pre-antibiotic era to study the in- fections themselves, as well as to identify new TB-related macro- morphological diagnostic criteria [8–12]. The V´ac mummy collection can be considered as an excellent example of the above-mentioned collections. Among other advantages of this collection, the main reason for selecting them in our research is that several results of TB-related investigations and individual data are available regarding this group. As these mummies are dated to the modern age, they also represent an excellent link between recent and archaeological samples [13–18].
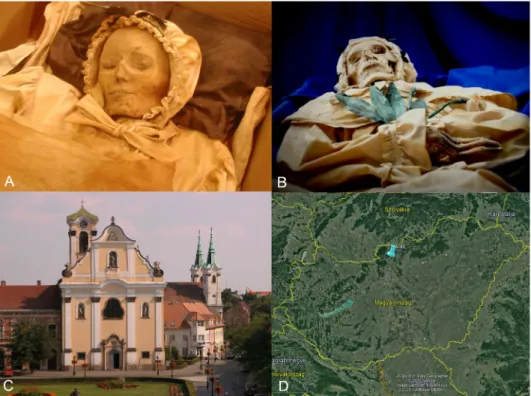
The examined mummy collection was discovered in a long-forgotten crypt during the renovation of the Dominican Church of V´ac in 1994–1995 [13] (Fig. 1). The mummies are curated in the Department of Anthropology, Hungarian Natural History Museum, Budapest. The chamber had been used as a burial site for middle-class families and ecclesiastical individuals from 1731 until 1838. On the site, the remains of 265 individuals were found and, fortunately, most of them were naturally mummified. During the years, the remains have undergone several investigations with a broad variety of techniques, such as morphological analysis, dermatological examination, X-ray imaging, 3D reconstruction, and aDNA examination [14–20]. Considering the high prevalence of TB in this era and the suspicion of TB-infected cases based on macromorphological observations, an extended screening was car- ried out searching for DNA traits of the infectious agent. Fletcher and her colleagues [14] examined over 350 samples covering 168 individuals.
The samples were taken from the lungs, pleura, abdomen, ribs, hair, teeth, and clothing. They found that 55% of the individuals proved to be infected with Mycobacterium tuberculosis complex (MTBC), based on the PCR amplification of IS6110, 19-kDa antigen and MPB70 antigen genes,
as well as dnaA-dnaN spacer regions. Moreover, they monitored the si- lent point mutations of the gyrA 95 and katG 463 genes. In a later study, metagenomics analysis was also carried out on a lung tissue sample taken from Ter´ezia Hausmann, in which signs of a mixed infection were recorded, with the presence of two different M. tuberculosis strains [18].
In 2015, samples were taken from 26 of the V´ac mummies, whose extracted MTBC DNA were analysed phylogenetically based on sequencing results [15]. From eight individuals, 14 different M. tuberculosis genome sequences have been successfully determined.
Furthermore, each infectious agent belongs to the M. tuberculosis Line- age 4, which is represented in a high occurrence globally even today [15, 21].
Complementing the aDNA-based detections, the utilization of lipid biomarker-based diagnostic techniques on archaeological samples has been in practise since the end of the ‘90s [22,23]. These methods benefit from the lipid-rich cell wall, characteristic of mycobacteria. Two cell wall constituent groups, the mycolic acid (MA), the mycocerosic acid (MC) components and, also the C27 mycolipenic acid, are commonly used for this purpose [24–26]. All of these lipids can be found in the Mycobacterial Outer Membrane (MOM) [27]. While MAs are mainly covalently bound to the mycoloylarabinogalactan-peptidoglycan mac- romolecules, MCs are long-chain multimethyl-branched-chain fatty acids (Fig. 2) that are components of phthiocerol dimycocerosate (PDIM) waxes and glycosyl phenolphthiocerol dimycocerosates, the so-called “phenolic glycolipids” (PGLs) [25–28]. MCs can be found only in the strains of M. tuberculosis, Mycobacterium bovis, Mycobacterium gastri, Mycobacterium haemophilum, Mycobacterium kansasii, Mycobacte- rium leprae, Mycobacterium marinum and Mycobacterium ulcerans [25, 29–33].
The development of lipid biomarker diagnosis of ancient mycobac- terial disease has been reviewed in detail [26], but it is summarised as follows. Initially, methylanthryl MA derivatives were profiled by fluo- rescence high performance liquid chromatography (HPLC) [22,23]. The very large C70 – C90 MAs were distinguished, according to size, from all mammalian fatty acids by reverse phase HPLC and the total MAs were collected. The individual α-, methoxy- and keto MA types were resolved
Fig. 1.Source of the V´ac mummy samples. A, The late Ter´ezia Damiani (Body 79, Inv. No: 2009.19.79.); B, The late Ter´ezia Hausmann (Body 68, Inv. No:
2009.19.68.); C, Dominican Church of V´ac. Photo: Andras Thumbasz; D, Location of V´ ´ac.
by normal phase HPLC and the collected fractions analysed by reverse phase HPLC to provide diagnostic profiles [22,23]. The relative insta- bility of methylanthryl derivatives led to the more robust fluorescence HPLC use of pyrenebutyrates of pentafluorobenzyl MA esters [24,26, 34]. Direct electrospray ionisation mass spectrometry (ESI-MS) detec- tion of M. tuberculosis free MAs has been successful in a single example [35]. The smaller C27 – C33 mycocerosic acids (MCs) (Fig. 2) are amenable to gas chromatographic (GC) profiling [29–33]. Highly sen- sitive negative ion-chemical ionisation gas chromatography mass spec- trometry (NI-CI GC-MS) of pentafluorobenzyl esters was developed for their detection in archaeological material [25,26] and applied to a range of specimens [1,2,4,36,37].
Since the lipid biomarker-based diagnostic methods, including mycocerosic acid profiling, were proven to be efficient and reliable [1,2, 22–27,34–37], we chose to optimise a similar method. As a GC-MS method was already well characterized in the literature [25,33], in our study, a novel HPLC-HESI-MS detection based method was devel- oped for MCs and tested on a sample set selected from the published positive cases of the V´ac mummy collection, previously examined by aDNA techniques.
2. Materials
For the method optimisation, two reference strains, M. tuberculosis H37Rv (NR-49098) and M. bovis (NR-31210), were used. The reference strains were acquired from the American Type Culture Collection (ATCC), provided by BEI Resources (Manassas, Virginia, USA). For the method testing, we used five M. tuberculosis complex strains (laboratory IDs of the isolated strains MTBC-1/2015; MTBC-254/2000; MTBC- 3910/2014; MTBC-242/2000; and MTBC-1/8508/2014), isolated from patients diagnosed with pulmonary tuberculosis. Also, eight different NTM (Nontuberculous Mycobacteria) species, namely M. kansasii 1959/
2018, Mycobacterium chelonae 16/2018, Mycobacterium gordonae 389/
2018, Mycobacterium intracellulare 7802/2017, Mycobacterium abscessus ssp. abscessus 180/2018, Mycobacterium avium 16229/2018,
Mycobacterium fortuitum complex 3/2018 and Mycobacterium chimaera 619/2018 from various clinical specimens were studied. The isolation of these strains from clinical specimens was carried out in two laboratories, namely the Institute of Clinical Microbiology, University of Szeged, Szeged, Hungary and the National Kor´anyi Institute of TB and Pulmo- nology, Budapest, Hungary, according to the national recommendations [38]. The identification of the isolated strains was carried out using commercially available tests following the instructions of the manu- facturer, (MALDI-TOF mass spectrometry, Bruker/Hain Lifescience) and sequencing ((Cepheid, Becton Dickinson) 16S rDNA, rpoB and hsp 65 sequence analysis). Culture was carried out using L¨owenstein-Jensen medium (L-asparagine, monopotassium phosphate, magnesium sulfate, magnesium citrate, soluble potato starch, malachite green, whole eggs, glycerol and demineralized water) for 1–3 weeks, incubating at 37 ◦C. In case of adequate growth and pure culture, the strains were inoculated into fresh media and cultured for a further 1–3 weeks at 37 ◦C. The cells were inactivated by heating for 4 h in physiological saline solution and stored at − 20 ◦C, after freeze-drying. For the method optimisation, 20 mg of freeze-dried bacterial material was used.
The examined bone and soft tissue samples were from six in- dividuals, selected on the base of previous positive results gained by aDNA examination [14,15] (Table 1). The sampled adult individuals were four females and two males. The analysed mummy samples (both bone and soft tissue samples) were taken from the chest region of the examined individuals. The samples were removed by sanitized tweezers and stored in tightly closed bags separated well from each other at room temperature. The ribs have been powdered, while the soft tissues were processed in the clean laboratory of the Institute for Mummy Studies, EURAC Research, Bolzano, Italy.
3. Methods
3.1. Lipid extraction and purification
The lipid extraction was carried out according to a previously Fig. 2. Structures of mycocerosic acids. The mass spectral m/z values correspond to carboxylate anions (M – H+).
published method [24] with minor modifications. The samples were heated at 100 ◦C overnight with 20% KOH in MeOH (2 ml; m/V) and toluene (1 ml) in PTFE capped glass tubes; for bacterial samples, 20 mg was used. The sample amounts from each examined individual are shown in Table 1. The tubes were cooled and 10% HCl (1 ml) was added in an ice bath; the pH was finally set to 1 with the addition of 37% HCl solution. Thereafter, toluene was added (1 ml) to the samples and after 1 min of vortexing, they were centrifuged at 1200 rpm for 15 min. The organic layer was transferred into a new glass tube, while the bottom layer was re-extracted twice with the same method with the further addition of toluene and one more time with hexanes (1 ml). The collected and combined organic phases were evaporated to dryness in vacuum with a Savant SC250EXP SpeedVac concentrator (Thermo Sci- entific, Waltham, Massachusetts, USA) and dissolved in 1000 μl and 200 μl isopropanol (IPA):heptane:acetonitrile (MeCN) (4:1:5) in the case of bacterial and mummy samples, respectively. The sample solutions were filtered by PTFE syringe filters (pore size: 2.0 μm; diameter: 13 mm).
3.2. Mycocerosic acid separation and detection by mass spectrometry The measurements were carried out on a Dionex Ultimate 3000 UHPLC system (Thermo Scientific, Waltham, Massachusetts, USA), which was coupled with a Q-Exactive Plus (Thermo Scientific, Waltham, Massachusetts, USA) mass spectrometer (MS). For the separation, a Gemini – NX C18 (3 μm, 110A, 50 mm ×2 mm) column (Phenomenex, Torrance, California, USA) was used at 30 ◦C. The eluent A was MeCN, containing 0.1% acetic acid (AcOH), while eluent B consisted of IPA:
heptane (8:2), also supplemented with 0.1% AcOH. The flow rate was 200 μl/min and the applied gradient elution was the following: at 0 min 10% B, 5 min 15% B, 15 min 70% B, 16 min 90% B, 18 min 90% B, 18.5 min 20% B, 19.5 min 20% B, 20 min 90% B, 23 min 90% B, 24 min 10%
B and 28 min 10% B. The injection volume was 10 μl. The injection needle was thoroughly washed, before and after injection, with 150 μl IPA:heptane (8:2). Solvent blank injections were made between each sample investigation.
In the case of MS settings, certain parameters were optimised, while the sheath gas flow and the auxiliary gas rates were constant at 35 l/min and 10 l/min, respectively. The structures of the investigated MCs are shown in Fig. 2. The MCs were monitored in negative Selected Ion Monitoring (SIM) mode: 409.40510 (C27, C27H53O2), 437.43640 (C29, C29H57O2), 451.45205 (C30, C30H59O2), 479.48335 (C32, C32H63O2) and 493.49900 (C33, C33H65O2), with 0.4 m/z isolation window. The area values of the MC peaks were calculated with TraceFinder 4.0 General Quan Software (Thermo Scientific, Waltham, Massachusetts, USA). The maximum mass deviation from the calculated [M − H]- ion mass was 5 ppm for peak identification. During the evaluation, the detected MC peaks have been normalised to the peak with the highest area value.
4. Results and discussion
4.1. Optimisation of the HPLC-MS protocols for the analysis of mycocerosic acids
For the method optimisation, the MC mixture extracted from M. tuberculosis H37Rv was used. In the case of HPLC-MS based lipid analysis, the two most commonly used ion sources are the atmospheric pressure chemical ionisation (APCI) and (heated) electrospray ionisa- tion modes ((H)ESI) [39–43]. APCI is suitable to examine several kinds of lipids, providing relatively simple mass spectra, but it can certainly lead to the degradation of labile lipids [39,40]. ESI compared to APCI provides a softer ionisation, and it is also minimising the undesired in-source fragmentation, thus the ions can be transferred into the gas phase, while preserved to be intact [44–47] as well as a well-established ESI-MS method can provide an extremely high-sensitivity and good reproducibility [46,48]. Therefore, regarding the advantages of ESI ion source, ESI-MS became a popular tool in lipid research [40,45,47–49].
To find out whether APCI or ESI is more efficient with our target lipids, these two widely used ion sources were compared to each other. To enable the assessment of the effect of the various parameters, a reference profile of the MCs of M. tuberculosis, observed during the application of HESI ion source, is included in Fig. 3.
First, the MS parameters were tuned with both ion sources. The optimisation was carried out in flow injection analysis (5 μl) with 50% of both eluent A and B at 200 μl/min flow rate. Initially, the temperature of both the capillary and the auxiliary gas of the HESI ion source were tuned at 4 kV spray voltage and a 60 V of S-lens voltage, as a basic setting. It was found that increasing the capillary temperature from 300 ◦C to 350 ◦C increased the intensity approximately to 150%
(Figs. 4.1 and 4.2). As the auxiliary gas temperature is also affecting the ionisation, the effect caused by its change was also tested. The increase of its temperature to 350 ◦C had caused a 120% increase in the inte- grated area values (Figs. 4.1 and 4.3). With the combined increase of the capillary and auxiliary gas temperature, doubled intensity of the monitored peaks was gained (Figs. 4.1 and 4.4). As further optimisation, the possible effects of using APCI as ion source had been tested, but even with a high increase of the capillary temperature from 250 ◦C first to 350 ◦C (Figs. 4.5 and 4.6) and then up to 400 ◦C did not give enough rise to the intensity (Figs. 4.6 and 4.7), which would have made further optimisation steps on this way promising. After finding that the usage of HESI ion source is more effective, the S-lens voltage, as an important factor in signal intensification, was also optimised. Its increase from 60 V to 70 V caused approximately 1.3 times increase in the intensity (Figs. 4.4 and 4.8). Further increase did not affect the intensity consid- erably (Figs. 4.8 and 4.9). Finally, the optimal settings of the MS were the following: the capillary and the auxiliary gas was heated to 350 ◦C, the spray voltage was set to 4 kV, while the S-lens voltage was 70 V (Fig. 4.8).
During the chromatographic run, M. tuberculosis MCs were eluting between 5.8 and 10.98 min (Fig. 3 A). The first eluting component was the C27 mycocerosic acid (Rt: 5.96), the second was the C29 (Rt: 8.15), followed by C30 (Rt: 8.73), C32 (Rt: 10.61) and C33 (Rt: 10.98), respectively. After the retention times had been observed, the divert Table 1
Details of the examined individual mummies and presence or absence of mycocerosic acid profiles typical of M. tuberculosis.
Name Body number Inventory number Age at death Sample weight (mg) MTB mycocerosic acid profile
Bone sample Soft tissue sample Bone sample Soft tissue sample
Ter´ezia Hausmann #68 2009.19.68. 28 400 284 + +
Anna Schneller #78 2009.19.78. 48 699 459 + +
Erzs´ebet Vir´agh #80 2009.19.80. 37 500 193 + +
L´aszlo Beniczky ´ #121 2009.19.121. ~38 500 482 + +
G´asp´ar Steitel #25 2009.19.25. 58 500 227 – –
Ter´ezia Damiani #79 2009.19.79. 37 519 257 – –
valve was set to switch to be open in the direction of the MS only from 5 to 15 min to avoid the contamination of the instrument. In the case of M. tuberculosis H37Rv strain, the C32 (100%) MC is the most abundant, followed by C29 (57%) and C30 (50%) MCs, with C27 (9%) and C33 (8%) as minor components (Fig. 3A). To check the repeatability of the whole method, including sample preparation and detection, the relative standard deviation (RSD) values were calculated for three individually prepared parallel samples. The highest RSD was determined for the C27 MC (28%), while C29 and C33 MCs showed 12% and 5% RSD,
respectively; the lowest RSD values were observed for the C30 (3%) and C32 MCs (0%).
The mycobacterial mycocerosate HPLC profiles, recorded here, correspond well with those recorded previously by NI-CI GC-MS of pentafluorobenzyl esters [2,25,26]. In the GC-MS method, however, C29 and C30 MCs co-chromatograph, the additional methyl branch in the C30 component (Fig. 2) providing enhanced volatility. In this HPLC study, the additional carbon in the C30 MC ensures that it is retained longer by the reverse phase column media (Fig. 3), subtle structural differences being less influential in the liquid phase. A similar rela- tionship is seen for the C32 and C33 MCs (Fig. 3). The current non-aqueous alkaline hydrolysis procedure is efficient in releasing MCs from the very hydrophobic parent phthiocerol dimycocerosate waxes [2, 25]. However, this non-aqueous environment promotes racemisation of the chiral centre at carbon-2 of MCs (Fig. 2), yielding diastereoisomers.
The high-resolution capillary columns employed in the NI-CI GC-MS procedure can resolve these diastereoisomers to give highly diagnostic double peaks [2,26]. Such resolution is not achieved by the reverse-phase HPLC used in this study.
4.2. Profiles of mycocerosic acids from standard mycobacteria
After the method optimisation, our aim was to build up an MC profile library for later comparisons. For establishing the MC profiles, three individually prepared parallel samples had been used in the case of every strain. First, the profile of M. bovis (ATCC, NR-31210) had been established. The C29 MC has been presented in the highest ratio (0%
RSD). It was followed by the C27 and C32 MCs with 30 and 28% (10 and 20% RSD, respectively). The least presented MCs were C30 and C33 MCs, and their area value was 21% and 2% of the highest peak (14 and 13% RSD, respectively) (Fig. 3B).
During the examinations of NTM isolates, in the case of M. kansasii, the C30 MC was recorded in the highest ratio (0% RSD). It was followed by the C29 (38%, 14% RSD) and C32 MC (30%, 7% RSD), while the C27 and C33 MCs were presented in 16% (2% RSD) and 2% (14% RSD), respectively (Fig. 3C). Among the rest of the NTM species (Supple- mentary Figure 1), a peak co-chromatographing with C27 MC was seen in the M. avium strain, but the other monitored MCs were not detectable;
the true identity of this component remains to be established. The remainder of the examined NTM species did not show any traces of the monitored MCs (Supplementary Figure 1 and Supplementary Figure 2).
These results correlate well with previously published data, which point to the fact that MCs can be found only in the following species:
M. tuberculosis, M. bovis, M. gastri, M. haemophilum, M. kansasii, M. leprae, M. marinum, and M. ulcerans [25,29–33]. An extended study presenting a THM-GC-MS based method for the differentiation of M. tuberculosis from NTM species came to a similar result [50]. In this study, the applied MC biomarkers have not been detected in the following NTM species:
M. avium, M. chelonae, M. fortuitum, M. gordonae, M. abscessus, M.
chimaera and M. intracellulare (Supplementary Figure 1 and Supple- mentary Figure 2). The MC profile from M. kansasii (Fig. 3C) includes significant proportions of C32 MCs, which correlates with its perceived close relation to the most recent common ancestors of the M. tuberculosis complex, including “M. canettii” [26,27]. Recent genomic investigations [51] have pinpointed Mycobacterium decipiens, Mycobacterium lacus, Mycobacterium riyadhense and Mycobacterium shinjukuense as species intermediate between M. kansasii and the conventional M. tuberculosis complex, so lipid profiles of these mycobacteria could be important in the evolutionary studies of TB.
To give a generally applicable reference MC profile, the average M. tuberculosis profile was established by the examination of five MTBC strains deriving from patients (Supplementary Figure 3). The M. tuberculosis complex 1/8508/2014 strain has been excluded from the calculation of the average M. tuberculosis profile establishment, as its profile resembled that of the M. bovis strain provided from BEI Resources (Fig. 3 B) and with the published M. bovis values [25]. The most Fig. 3. Standard HPLC-HESI-MS mycocerosate (MC) profiles for A,
M. tuberculosis H37Rv; B, M. bovis; C, M. kansasii. MC proportions are shown normalised to the major component [100].
well-marked difference of this strain is that C29 MC was most prominent (0% RSD), while C32 was only 22% (18% RSD). The C27 MC was 38%
(3% RSD), C30 and C33 were 15% and 0.1% (23–63% RSD), respec- tively. On the average M. tuberculosis profile, the C32 MC was the most prominent, while C29 and C30 MCs were present with similar 31% and 23% of the highest MC peak, respectively; the C33 MC reached only 2%
of C32. The relative proportions of these M. tuberculosis MCs are in general accord with previously published profiles [25,33]. The overall distribution of individual MCs from standard and clinical M. tuberculosis, M. bovis and M. kansasii is shown in Supplementary Figure 4.
4.3. Profiles of mycocerosic acids from individual subjects
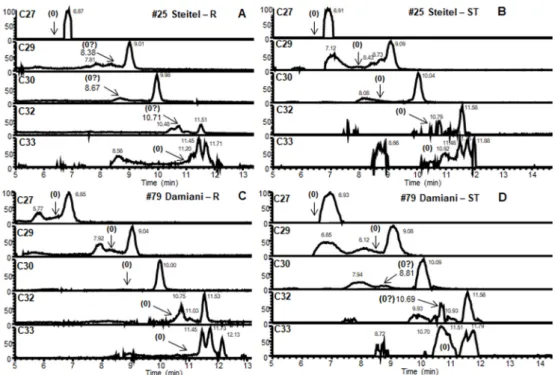
The lipid profiles observed for the extracts of both rib and soft tissue samples from four consistent cases are shown in Fig. 5. The M. tuberculosis C27 MC minor component (Fig. 3) was not detected in any of these extracts. The results for the samples taken from the remains of Ter´ezia Hausmann (#68) were positive. In the MC profile for the soft tissue sample (Fig. 5 B), the main C32 peak was accompanied by major C29, C30 and minor C33 peaks. The rib sample (Fig. 5 A) had clear main C32 and major C30; however, any minor C33 was indistinct and the area for expected C29 was obscured. The positive rib and soft tissue profiles, from the remains of Anna Schneller (#78) (Fig. 5 A and B), both had the expected main C32 and major C29 and C30, but the minor C33 was not so clear. Both types of samples belonging to Erzs´ebet Vir´agh (#80) (Fig. 5 E, F) proved to be also positive, with clear C29, C30, C32 and C33 peaks being detected; however, the C33 peak in case of the soft tissue sample was overrepresented, a rather broad peak suggesting overlap with an unknown component (Fig. 5 F). The rib and soft tissue of L´aszlo ´ Beniczky (#121) (Fig. 5 G, H) exhibited clear MC peaks for C30 and C32 mycocerosates, with little C33. The C29 signals were questionable, as the rib peak (Fig. 5 G) was not fully resolved, and in the soft tissue extract, the peak shape was atypical (Fig. 5 H). The soft tissue samples of G´asp´ar Steitel (#25) did not contain detectable MCs (Fig. 6 B), while the rib extracts (Fig. 6 A) showed very weak indecisive results for C30 and C32 MCs. Conversely, the rib extracts from Ter´ezia Damiani (#79) (Fig. 6 C) were devoid of MCs, but the soft tissue samples (Fig. 6 D) provided barely discernible indications of C30 and C32 MCs. These inconclusive results cannot be regarded as a positive indication of tuberculosis in these mummies, but the fact that the very weak signals are for two of the principal MC components (C30 and C32) may be useful signposts. The distribution of the individual MCs in the positive mummy
cases (Fig. 5) is summarised in Fig. 7.
It can be concluded that when the three most presented C32, C30, and C29 MCs, with a principal amount of the C32 component, are found in archaeological samples, infection with M. tuberculosis is indicated.
Compliance with these requirements was recorded for the rib and soft tissue samples from Ter´ezia Hausmann (#68), Anna Schneller (#78), Erzs´ebet Vir´agh (#80) and L´aszl´o Beniczky (#121) (Fig. 5). However, the cases of Gasp´ ´ar Steitel (#25) and Ter´ezia Damiani (#79) (Fig. 6) cannot be recognised as positive. In most cases, C32 MC was presented at least in a double ratio compared to the C30 MC, except for case #68 soft tissue, where the C30 and C32 mycocerosates were found in almost equal ratios (Fig. 5 B). Only traces of C33 mycocerosic acid were detected from both sample types of #68, #78, and #80, as well as from the soft tissue sample of #121, so the diagnostic use of this biomarker is limited for ancient tuberculosis. However, C33 and C34 mycocerosic acids have established value for recognising ancient Mycobacterium leprae, including joint tuberculosis-leprosy cases [26].
4.4. Correlation of mycocerosic acid profiles with aDNA results
The examined individuals were initially screened by Fletcher and colleagues [14] for the presence of the 123-bp region of the IS6110 insertion sequence. Positive samples were investigated for silent point mutations of the gyrA 95 and katG 463 genes; this differentiated the infectious agents into three genotypes, following the work of Sreevatsan and colleagues [52]. The mummy of Ter´ezia Hausmann was the subject of the first metagenomic determination by Chan and colleagues [18], followed by a more comprehensive whole genomic study by Kay and co-workers [15]. Correlations of lipid and DNA biomarkers are sum- marised below for each individual mummy.
Ter´ezia Hausmann (#68). Positive MC profiles (Fig. 5 A, B) matched the result of the DNA-based analysis; traits of gyrA 95 and katG 463 genes were found in the chest, with the silent point mutations charac- teristic to the group 3 genotype of M. tuberculosis [14]. Metagenomic analysis of a left lung specimen found a multiple infection by more than one M. tuberculosis strain [18]. One of the M. tuberculosis strains belonged to sublineage 4.1.2.1, also known as the Haarlem lineage [15, 21]. The other strain was assigned by Kay and colleagues to lineage 4.7 sublineage [15], a sublineage, which is currently part of sublineage 4.10 [21].
Anna Schneller (#78). Amplification of the katG 463 codon from a rib sample by Fletcher and colleagues [14] gave good support to the Fig. 4.Optimisation of the HESI ion source and the S-lens. 1, Basic HESI ion source settings: 300 ◦C capillary and 300 ◦C auxil- iary gas. 2, HESI ion source: 350 ◦C capillary and 300 ◦C auxiliary gas. 3, HESI ion source:
300 ◦C capillary and 350 ◦C auxiliary gas. 4, HESI ion source: 350 ◦C capillary and 350 ◦C auxiliary gas. 5, APCI ion source: 250 ◦C capillary. 6, APCI ion source: 350 ◦C capil- lary. 7, APCI ion source: 400 ◦C capillary. 8, HESI ion source: 350 ◦C capillary and 350 ◦C auxiliary gas, 70 V for S-lens. 9, HESI ion source: 350 ◦C capillary and 350 ◦C auxiliary gas, 80 V of S-lens.
positive MC profiles (Fig. 5C, D). Based on its sequence, the infectious agent could belong to the group 2 or group 3 genotype. Additional phylogenetic analysis revealed that the M. tuberculosis strain also belonged to the current MTBC sublineage 4.10 [15,21].
Erzs´ebet Vir´agh (#80). Similarly, Fletcher and colleagues [14] found that, based on the silent point mutations of gyrA 95 and katG 463 genes, the infectious agent belongs to the group 3 genotype. The full genomic examinations by Kay and colleagues [15] revealed that the M. tuberculosis strain belongs to the 4.1.2.1 sublineage. All this evidence backs the positive coherent MC profiles (Fig. 5 E, F).
L´aszl´o Beniczky (#121). The MC profiles had slightly decreased positivity due to questionable C29 peaks (Fig. 5 G, H), but diagnostic PCR products have been amplified earlier from a pleura sample, with a silent point mutation pattern belonging to group 3 [14]. Positive
sequencing data of a rib sample showed a mixed infection of M. tuberculosis sublineage 4.3 (also known as LAM) and two strains of the current sublineage 4.10 [15,21]. The sublineage 4.3 (also known as LAM) of M. tuberculosis is globally distributed, with high frequency [21].
G´asp´ar Steitel (#25). Unfortunately, the MC profiles were essentially negative (Fig. 6 A, B) in contrast with the previous detection of M. tuberculosis complex DNA [14,15]. The first PCR based aDNA ex- aminations, using a sample taken from the left chest, detected only the traits of katG 463 gene, with the silent point mutation suggesting that the infectious agent belonged to group 2 or 3 [14]. The later meta- genomic examinations of tissue from the abdomen region determined that the M. tuberculosis strain belongs to lineage 4 [15].
Ter´ezia Damiani (#79). In this case, the monitored MC biomarkers could not be detected (Fig. 6C, D). However, Fletcher and colleagues Fig. 5.Positive HPLC-HESI-MS mycocerosate (MC) profiles from mummy samples #68, #78, #80, #121. Rib (R) and Soft Tissue (ST) samples from: A and B, #68 - Ter´ezia Hausmann; C and D, #78 - Anna Schneller; E and F, #80 - Erzs´ebet Vir´agh; G and H, #121 - L´aszl´o Beniczky. MC distributions are shown normalised to the major component [100].
[14] amplified the fragment of the katG 463 gene in the sample taken from the pelvis region of this individual and found the silent point mutation characteristic of group 2 and 3. Metagenomic analyses have not been performed on extracts of this mummy.
Overall, in four of the six mummies studied, there is good correlation of mycocerosate profiles (Fig. 5) with positive ancient DNA analyses. In the two cases lacking significant mycocerosate presence (Fig. 6), but with good indications of aDNA biomarkers, the discrepancy may be due to differences in the samples investigated. Mummified individuals pro- vide a much greater choice of areas for sampling than in skeletons without soft tissue. Even though the cases of G´asp´ar Steitel and Ter´ezia Damiani (Fig. 6) were deemed negative, the very weak signals observed
in Fig. 6 A, D could be sufficient to encourage investigation of a wider range of samples from these mummies.
5. Conclusions
The diagnosis of ancient mycobacterial disease in archaeological material requires a multidisciplinary approach. Suspicions of leprosy and tuberculosis can be aroused in skeletal material by the manifesta- tions of characteristic bone lesions and deformities. An array of specific biomarkers can be brought into play to confirm initial skeletal diagnoses and search in the soft tissue of suspected cases [26]. The pioneering application of whole-genome sequencing [18] has opened the prospect Fig. 6. Negative HPLC-HESI-MS mycocerosate (MC) profiles from mummy samples #25, #79. Rib (R) and Soft Tissue (ST) samples from: A and B, #25 - G´asp´ar Steitel; C and D, #79 - Ter´ezia Damiani.
Fig. 7. The normalised distribution of positive mycocerosate profiles from mummy rib (R) and soft tissue (ST) samples. #68 – Ter´ezia Hausmann. #78 – Anna Schneller. #80 – Erzs´ebet Vir´agh. #121 – L´aszl´o Beniczky. Also shown are a “Mummy average” and an “MTB average”, excluding anomalous MTBC-1/8508/2014.
of obtaining comprehensive information regarding the nature and number of infecting M. tuberculosis strains [15,53]. However, for over a quarter of a century, amplification and study of key fragments of ancient DNA have been successful, including the mummies in the present study [14]. Confidence in aDNA diagnoses has been greatly reinforced by recording profiles of specific lipid biomarkers, which are particularly robust and accessible [26]. Initial lipid targets were the C70 to C90 mycolic acids [22–24], but the range was broadened to include the multimethyl-branched mycocerosic and mycolipenic acids [2,25] and phthiocerols [2].
A variety of analytical methods have been employed for mycobac- terial lipid biomarker profiling [26]. Fluorescence HPLC is well-developed for the analysis of mycolic acids and phthiocerols [2,26].
In a single study, on a Neolithic lesioned vertebra, HPLC-MS/MS with electrospray ionisation (ESI) yielded profiles of individual α-, methoxy- and ketomycolates characteristic of M. tuberculosis [35]. Mass spec- trometry, however, has been the basis of the analysis of ancient myco- cerosic acids, using selected ion monitoring, negative ion-chemical ionisation GC-MS of pentafluorobenzyl ester derivatives [2,25,26]. This is a well-proven procedure, but the popularity and availability of the necessary instrumentation have declined over the past two decades.
Conversely, HPLC-MS facilities have become routine in biological and other analytical laboratories and, in this study, an effective procedure has been developed. The optimised method provides an easy and quick way to confirm TB-infected cases among archaeological human remains.
In the case of four mummified individuals, profiles of characteristic M. tuberculosis MCs were recorded (Fig. 5), but two other mummies did not yield diagnostic MC profiles (Fig. 6). All the mummy samples had been found, previously, to be positive by aDNA examination, but the samples in this study were not identical with those used previously and the sampling site may affect the results. An extended study of confirmed cases, with multiple sampling sites of skeletal material and soft tissue, where available, is suggested to clarify the situation. The present results, however, provide further confirmation of widespread tuberculosis in the V´ac mummies.
The HPLC-HESI-MS method, developed in this study, opens up a new avenue for the detection of ancient mycobacterial disease, encompassing both tuberculosis and leprosy and joint cases. Currently, the instru- mentation required is available in many laboratories and technical de- velopments are likely to reduce complexity and increase sensitivity and affordability. A particular advantage is that no chemical derivatisation of the particular lipid biomarkers is needed, the free acids being utilised.
The method could be extended to include the related M. tuberculosis lipid biomarker, mycolipenic acid [26], and a comprehensive protocol could be developed to add profiles of free mycolic acids [26,35]. As noted above, free mycolic acids were successfully profiled in a Neolithic tuberculosis case [35] and this study demonstrates the powerful diag- nostic capability of direct mass spectrometry. In the well-established fluorescence HPLC procedure, the recognition of diagnostic mycolate profiles requires extensive derivatisation and sequential reverse and normal phase HPLC analyses [24,26]. In contrast, in a single selected ion monitoring HPLC run, all the diagnostic mycolic acid data are collected and are available for further processing.
CRediT authorship contribution statement
Orsolya Anna V´aradi: Conceptualization, Methodology, Formal analysis, Investigation, Data curation, Writing - original draft, Writing - review & editing, Visualization, Project administration, Funding acquisition. David Rakk: Methodology. Olga Spekker: Writing - orig-´ inal draft. Gabriella Terhes: Resources. Edit Urb´an: Resources. Wil- liam Berthon: Writing - original draft. Ildiko Pap: Resources. Ildik´ o ´ Szikossy: Resources. Frank Maixner: Resources, Supervision, Writing - review & editing. Albert Zink: Resources, Supervision, Writing - review
& editing. Csaba V´agvolgyi: Resources. Helen D. Donoghue: Super-¨
vision. David E. Minnikin: Conceptualization, Validation, Writing -
original draft, Visualization, Writing - review & editing. Andras Sze-´ keres: Conceptualization, Project administration, Supervision, Funding acquisition. Gy¨orgy P´alfi: Conceptualization, Resources, Funding acquisition, Supervision.
Declaration of competing interest None.
Acknowledgements
We thank BEI Resources (Manassas VA, USA) for providing identified mycobacterial standard strains. We are also grateful for Oona Y-C Lee and Houdini H T Wu (University of Birmingham, UK) for their help with figure editing.
Appendix A. Supplementary data
Supplementary data to this article can be found online at https://doi.
org/10.1016/j.tube.2020.102037.
Funding
This work was supported by the National Research, Development and Innovation Office (Hungary) (grant number: K 125561). The infrastructural background was established with the support of GINOP (grant number: GINOP-2.3.3-15-2016-00006). The publication fees were financed by University of Szeged Open Access Fund (grant number:
4935).
References
[1] Baker O, Lee OY-C, Wu HHT, Besra GS, Minnikin DE, Llewellyn G, Williams CM, Maixner F, O’Sullivan N, Zink A, Charmel B, Khawam R, Coqueugniot E, Helmer D, Le Mort F, Perrin P, Gourichon L, Dutailly B, Gy P´alfi, Coqueugniot H, Dutour O.
Human tuberculosis predates domestication in ancient Syria. Tuberculosis 2015;95 (Suppl.1):S4–19. https://doi.org/10.1016/j.tube.2015.02.001.
[2] Lee OY-C, Wu HHT, Donoghue HD, Spigelman M, Greenblatt CL, Bull ID, Rothschild BM, Martin LD, Minnikin DE, Besra GS. Mycobacterium tuberculosis complex lipid virulence factors preserved in the 17,000-year-old skeleton of an extinct bison, Bison antiquus. PloS One 2012;7(7):e41923. https://doi.org/
10.1371/journal.pone.0041923.
[3] Hut´as I. A tuberkul´ozis j´arv´anytana. In: Magyar P, Somosk¨ovi A, editors. ´ Pulmon´alis ´es extrapulmon´alis tuberkulozis. Budapest: Medicina K´ ¨onyvkiado Zrt.; ´ 2007. p. 33–47.
[4] Masson M, Moln´ar E, Donoghue HD, Besra GS, Minnikin DE, Wu HHT, Lee OY-C, Bull ID, Gy P´alfi. Osteological and biomolecular evidence of a 7000-year old case of hypertrophic pulmonary osteopathy secondary to tuberculosis from neolithic Hungary. PloS One 2013;8(10):e78252. https://doi.org/10.1371/journal.
pone.0078252.
[5] Gy P´alfi, Dutour O, Perrin P, Sola C, Zink A. Tuberculosis Evol Tuberculosis 2015;
95(Suppl. 1):S1–3. https://doi.org/10.1016/j.tube.2015.04.007.
[6] Pai M, Behr MA, Dowdy D, Dheda K, Divangahi M, Boehme CC, Ginsberg A, Swaminathan S, Spigelman M, Getahun H, Menzies D, Raviglione M. Tuberculosis Nat Rev Dis Primers 2016;2:16076. https://doi.org/10.1038/nrdp.2016.76.
[7] World Health Organization. TB disease burden. In: Global tuberculosis report 2019.
Geneva, Italy: WHO; 2019. p. 27–70.
[8] Roberts CA, Lucy D, Manchester K. Inflammatory lesions of ribs: an analysis of the Terry Collection. Am J Phys Anthropol 1994;95(2):169–82. https://doi.org/
10.1002/ajpa.1330950205.
[9] Santos AL, Roberts CA. A picture of tuberculosis in young Portuguese people in the early 20th century: a multidisciplinary study of the skeletal and historical evidence.
Am J Phys Anthropol 2001;115(1):38–49. https://doi.org/10.1002/ajpa.1054.
[10] Santos AL, Roberts CA. Anatomy of a serial killer: differential diagnosis of tuberculosis based on rib lesions of adult individuals from the Coimbra Identified Skeletal Collection. Portugal Am J Phys Anthropol 2006;130(1):38–49. https://doi.
org/10.1002/ajpa.20160.
[11] Gy P´alfi, Zs Bereczki, Ortner DJ, Dutour O. Juvenile cases of skeletal tuberculosis from the terry anatomical collection (smithsonian institution, Washington, D.C., USA). Acta Biol Szeged 2012;56(1):1–12.
[12] Spekker O, Hunt DR, Paja L, Moln´ar E, Gy P´alfi, Schultz M. Tracking down the white plague: the skeletal evidence of tuberculous meningitis in the Robert J. Terry anatomical skeletal collection. PLOS ONE 2020;15(3):e0230418. https://doi.org/
10.1371/journal.pone.0230418.
[13] Pap I, J´ozsa L, Repa I, Bajzik G, Lakhani SR, Donoghue HD, Spigelman M. 18–19th century tuberculosis in naturally mummified individuals (V´ac, Hungary). In:
Gy P´alfi, Dutour O, De´ak J, Hut´as I, editors. Tuberculosis: Past and Present.
Budapest – Szeged, Hungary: Golden Book Publisher Ltd., Tuberculosis Foundation; 1999. p. 419–28.
[14] Fletcher HA, Donoghue HD, Holton J, Pap I, Spigelman M. Widespread occurrence of Mycobacterium tuberculosis DNA from 18th–19th century Hungarians. Am J Phys Anthropol 2003;120(2):144–52. https://doi.org/10.1002/ajpa.10114.
[15] Kay GL, Sergeant MJ, Zhou Z, Chan JZ-M, Millard A, Quick J, Szikossy I, Pap I, Spigelman M, Loman NJ, Achtman M, Donoghue HD, Pallen MJ. Eighteenth- century genomes show that mixed infections were common at time of peak tuberculosis in Europe. Nat Commun 2015;6:6717. https://doi.org/10.1038/
ncomms7717.
[16] Szikossy I, Bernert Zs, Pap I. Anthropological investigation of the 18th–19th century ossuary of the Dominican Church, V´ac, Hungary. Acta Biol Szeged 1997;
42:145–50.
[17] Pap I, Gy P´alfi, Moln´ar E, Karlinger K, Kov´acs KB, Korom Cs, Schultz M, Schmidt–Schultz TH, Spigelman M, Donoghue HD, Kust´ar A, Szikossy I. ´ A tuberkul´ozis el˝ofordul´asa egy XVIII. sz´azadi v´aci csal´adban. Anthropol Kozl 2017;58:37–47. https://doi.org/10.20330/AnthropKozl.2017.58.37.
[18] Chan JZ-M, Sergeant MJ, Lee OY-C, Minnikin DE, Besra GS, Pap I, Spigelman M, Donoghue HD, Pallen MJ. Metagenomic analysis of tuberculosis in a mummy.
N Engl J Med 2013;369(3):289–90. https://doi.org/10.1056/nejmc1302295.
[19] Csepl´ak Gy, Pap I, Szikossy I. A v´aci múmi´akr´ol – Antropo-medicin´alis tanulm´anyok 52 v´aci múmia vizsgalat´ ´ar´ol egy b˝orgy´ogy´asz f´enyk´epes jegyzeteivel.
Budapest: Semmelweis Kiad´o ´es Multim´edia Stúdio Kft.; 2015. ´
[20] Kust´ar A, Pap I, Zs V´ ´egv´ari, Kristof LA, Gy P´ ´alfi, Karlinger K, Kov´acs KB, Szikossy I.
Using of 3D virtual reconstruction for pathological investigation and facial reconstruction of an 18th century mummified nun from Hungary. Yearbook Mummy Stud 2011;1:83–93.
[21] Stucki D, Brites D, Jeljeli L, Coscolla M, Liu Q, Trauner A, Fenner L, Rutaihwa L, Borrell S, Luo T, Gao Q, Kato-Maeda M, Ballif M, Egger M, Macedo R, Gagneux S.
Mycobacterium tuberculosis lineage 4 comprises globally distributed and geographically restricted sublineages. Nat Genet 2016;48(12):1535–43. https://
doi.org/10.1038/ng.3704.
[22] Gernaey AM, Minnikin DE, Copley MS, Power JJ, Ahmed AMS, Dixon RA, Roberts CA, Robertson JD, Nolan J, Chamberlain A. Detecting ancient tuberculosis.
Internet Archaeol; 1998. http://intarch.ac.uk/journal/issue5/gernaey_index.html.
[23] Donoghue HD, Spigelman M, Zias J, Gernaey-Child AM, Minnikin DE.
Mycobacterium tuberculosis complex DNA in calcified pleura from remains 1400 years old. Lett Appl Microbiol 1998;27(5):265–9. https://doi.org/10.1046/j.1472- 765X.1998.00436.x.
[24] Hershkovitz I, Donoghue HD, Minnikin DE, Besra GS, Lee OY-C, Gernaey AM, Galili E, Eshed V, Greenblatt CL, Lemma E, Bar-Gal GK, Spigelman M. Detection and molecular characterization of 9000-year-old Mycobacterium tuberculosis from a neolithic settlement in the eastern Mediterranean. PloS One 2008;3(10):e3426.
https://doi.org/10.1371/journal.pone.0003426.
[25] Redman JE, Shaw MJ, Mallet AI, Santos AL, Roberts CA, Gernaey AM, Minnikin DE. Mycocerosic acid biomarkers for the diagnosis of tuberculosis in the Coimbra skeletal collection. Tuberculosis 2009;89(4):267–77. https://doi.org/
10.1016/j.tube.2009.04.001.
[26] Donoghue HD, Taylor MG, Stewart GR, Lee OY-C, Wu HHT, Besra GS, Minnikin DE.
Positive diagnosis of ancient leprosy and tuberculosis using ancient DNA and lipid biomarkers. Diversity 2017;9(4):46. https://doi.org/10.3390/d9040046.
[27] Minnikin DE, Lee OY-C, Wu HHT, Nataraj V, Donoghue HD, Ridell M, Watanabe M, Alderwick L, Bhatt A, Besra GS. Pathophysiological implications of cell envelope structure of Mycobacterium tuberculosis and related taxa. In: Ribon W, editor.
Tuberculosis – Expanding Knowledge. InTech – Open Access Publisher; 2015.
p. 145–75. https://doi.org/10.5772/59585.
[28] Minnikin DE. Lipids: complex lipids, their chemistry, biosynthesis and role. In:
Ratledge C, Stanford J, editors. The Biology of Mycobacteria. London, UK: London, UK: Academic Press; 1982. p. 95–184.
[29] Minnikin DE, Dobson G, Goodfellow M, Magnusson M, Ridell M. Distribution of some mycobacterial waxes based on the phthiocerol family. J Gen Microbiol 1985;
131(6):1375–81. https://doi.org/10.1099/00221287-131-6-1375.
[30] Daff´e M, Lan´eelle MA. Distribution of phthiocerol diester, phenolic mycosides and related compounds in mycobacteria. J Gen Microbiol 1988;134(7):2049–55.
https://doi.org/10.1099/00221287-134-7-2049.
[31] Draper P, Payne SN, Dobson G, Minnikin DE. Isolation of a characteristic phthiocerol dimycocerosate from Mycobacterium leprae. J Gen Microbiol 1983;129 (3):859–63. https://doi.org/10.1099/00221287-129-3-859.
[32] Hartmann S, Minnikin DE. Mycobacterial phenolic glycolipids. In: Tyman JHP, editor. Surfactants in lipid chemistry: recent synthetic, physical and biodegradative studies. Cambridge: Royal Society of Chemistry; 1992. p. 135–58.
[33] Minnikin DE, Bolton RC, Hartmann S, Besra GS, Jenkins PA, Mallet AI, Wilkins E, Lawson AM, Ridell M. An integrated procedure for the direct detection of characteristic lipids in tuberculosis patients. Ann Soc Belg Med Trop 1993;73 (Suppl. 1):13–24.
[34] Donoghue HD, Lee OY-C, Minnikin DE, Besra GS, Taylor JH, Spigelman M.
Tuberculosis in Dr Granville’s mummy: a molecular re-examination of the earliest
known Egyptian mummy to be scientifically examined and given a medical diagnosis. Proc Biol Sci 2010;277(1678):51–6. https://doi.org/10.1098/
rspb.2009.1484.
[35] Borowska-Struginska B, Druszczy´ ´nska M, Lorkiewicz W, Szewczyk R, Ządzi˙ ´nska E.
Mycolic acids as markers of osseous tuberculosis in the Neolithic skeleton from Kujawy region (central Poland). Anthropol Rev 2014;77(2):137–49. https://doi.
org/10.2478/anre-2014–0012.
[36] Masson M, Zs Bereczki, Moln´ar E, Donoghue HD, Minnikin DE, Lee OY-C, Wu HHT, Besra GS, Bull ID, Gy P´alfi. year-old tuberculosis cases from Hungary, osteological and biomolecular evidence. Tuberculosis 2015;95(Suppl. 1):S13–7. https://doi.
org/10.1016/j.tube.2015.02.007. 7000.
[37] Moln´ar E, Donoghue HD, Lee OY-C, Wu HHT, Besra GS, Minnikin DE, Bull ID, Llewellyn G, Williams CM, Spekker O, Gy P´alfi. Morphological and biomolecular evidence for tuberculosis in 8th century AD skeletons from B´elmegyer-Cs¨om¨oki domb, Hungary. Tuberculosis 2015;95(Suppl.1):S35–41. https://doi.org/10.1016/
j.tube.2015.02.032.
[38] Eg´eszs´egügyi szakmai ir´anyelv – a tuberkul´ozis prevenci´oj´ar´ol, diagnosztik´aj´ar´ol, ter´api´aj´ar´ol ´es gondoz´as´ar´ol. 2014. https://www.hbcs.hu/uploads/jogszabaly/28 38/fajlok/EMMI_szakmai_iranyelve_tuberkulozis.pdf. [Accessed 1 August 2020].
[39] Horai S, Yamauchi N, Naraoka H. Simultaneous total analysis of core and polar membrane lipids in archaea by high-performance liquid chromatography/high- resolution mass spectrometry coupled with heated electrospray ionization. Rapid Commun Mass Spectrom 2019;33(20):1571–7. https://doi.org/10.1002/
rcm.8506.
[40] Zhu C, Lipp JS, Wormer L, Becker KW, Schr¨ oder J, Hinrichs KU. Comprehensive ¨ glycerol ether lipid fingerprints through a novel reversed phase liquid chromatography-mass spectrometry protocol. Org Geochem 2013;65:53–62.
https://doi.org/10.1016/j.orggeochem.2013.09.012.
[41] Byrdwell WC. Atmospheric pressure chemical ionization mass spectrometry for analysis of lipids. Lipids 2001;36(4):327–46. https://doi.org/10.1007/s11745- 001-0725-5.
[42] Nichols DS, Davies NW. Improved detection of polyunsaturated fatty acids as phenacyl esters using liquid chromatography-ion trap mass spectrometry.
J Microbiol Methods 2002;50(2):103–13. https://doi.org/10.1016/S0167-7012 (02)00030-1.
[43] Willmann J, Thiele H, Leibfritz D. Combined reversed phase HPLC, mass spectrometry, and NMR spectroscopy for a fast separation and efficient identification of phosphatidylcholines. J Biomed Biotechnol 2011:385786. https://
doi.org/10.1155/2011/385786.
[44] Yunker LP, Stoddard RL, McIndoe JS. Practical approaches to the ESI-MS analysis of catalytic reactions. J Mass Spectrom 2014;49(1):1–8. https://doi.org/10.1002/
jms.3303.
[45] Han X, Yang K, Gross RW. Multi-dimensional mass spectrometry-based shotgun lipidomics and novel strategies for lipidomic analyses. Mass Spectrom Rev 2012;31 (1):134–78. https://doi.org/10.1002/mas.20342.
[46] Wang C, Wang M, Han X. Applications of mass spectrometry for cellular lipid analysis. Mol Biosyst 2015;11:698–713. https://doi.org/10.1039/C4MB00586D.
[47] Koivusalo M, Haimi P, Heikinheimo L, Kostiainen R, Somerharju P. Quantitative determination of phospholipid compositions by ESI-MS: effects of acyl chain length, unsaturation, and lipid concentration on instrument response. J Lipid Res 2001;42(4):663–72.
[48] Crane AM, Hua HU, Coggin AD, Gugiu BG, Lam BL, Bhattacharya SK. Mass spectrometric analyses of phosphatidylcholines in alkali-exposed corneal tissue.
Invest Ophthalmol Vis Sci 2012;53(11):7122–30. https://doi.org/10.1167/
iovs.12-10448.
[49] Nzoughet JK, Gallart-Ayala H, Biancotto G, Henning K, Dervilly-Pinel G, Le Bizec B. Hydrophilic interaction (HILIC) and reverse phase liquid chromatography (RPLC)–high resolution MS for characterizing lipids profile disruption in serum of anabolic implanted bovines. Metabolomics 2015;11:1884–95. https://doi.org/
10.1007/s11306-015-0847-y.
[50] Dang NA, Kuijper S, Walters E, Claassens M, van Soolingen D, Vivi-Truyols G, Janssen HG, Kolk AHJ. Validation of biomarkers for distinguishing Mycobacterium tuberculosis from non-tuberculous mycobacteria using gas chromatography–mass spectrometry and Chemometrics. PloS One 2013;8(10):e76263. https://doi.org/
10.1371/journal.pone.0076263.
[51] Sapriel G, Brosch R. Shared pathogenomic patterns characterize a new phylotype, revealing transition toward host-adaptation long before speciation of
Mycobacterium tuberculosis. Genome Biol Evol 2019;11:2420–38. https://doi.org/
10.1093/gbe/evz162. 8.
[52] Sreevatsan S, Pan X, Stockbauer KE, Conell ND, Kreiswirth BN, Whittam TS, Musser JM. Restricted structural gene polymorphism in the Mycobacterium tuberculosis complex indicates evolutionarily recent global dissemination. Proc Natl Acad Sci USA 1997;94(18):9869–74. https://doi.org/10.1073/pnas.94.18.9869.
[53] Bos K, Harkins K, Herbig A, Coscolla M, Weber N, Comas I, Forrest SA, Bryant JM, Harris SR, Schuenemann VJ, Campbell TJ, Majander K, Wilbur AK, Guichon RA, Steadman DLW, Krause J. Pre-Columbian mycobacterial genomes reveal seals as a source of New World human tuberculosis. Nature 2014;514:494–7. https://doi.
org/10.1038/nature13591.